Kushal Kumar Baruah
E-mail ID: kkbaruah14@gmail.com / kushal_baruah@rediffmail.com
Tel: +919435082141 ; Fax: +91-3712-267005/6 ORCID: 0000-0002-6864-3550
© 2019 Sift Desk Journals. All Rights Reserved
VOLUME: 3 ISSUE: 2
Page No: 395-407
Kushal Kumar Baruah
E-mail ID: kkbaruah14@gmail.com / kushal_baruah@rediffmail.com
Tel: +919435082141 ; Fax: +91-3712-267005/6 ORCID: 0000-0002-6864-3550
Dipti Gorh, Kushal Kumar Baruah* and Nirmali Gogoi
Department of Environmental Science, Tezpur University, Napaam-784028, Assam, India
Kushal Kumar Baruah(kushal_baruah@rediffmail.com)
Kushal Kumar Baruah, Analysis of Greenhouse Gas (Methane and Nitrous Oxide) emission and global warming potential from rice fields: with reference to biological mitigation of climate change. (2018)SDRP Journal of Earth Sciences & Environmental Studies 3(2)
Methane (CH4) and Nitrous Oxide (N2O), being potent greenhouse gases (GHG) contribute largely to global warming and climate change. The association of plant factors of rice plants on Global Warming Potential (GWP) and Greenhouse Gas Intensity (GHGI) are not well documented. To address the problem of climate change, global warming need to be mitigated by cutting down the emission of CH4 and N2O at its source. A 02 year field experiment was conducted during April-September of 2016 and 2017 which includes 08 pre monsoon (Ahu) rice varieties: Dikhow, Disang, Jaya, Kolong, Kopilee, Lachit, Swabhagi and Abhishek to estimate their GWP, GHGI and Carbon Equivalent Emission (CEE). CH4 and N2O flux throughout the cropping season were measured using static chamber technique. Investigation shows significant differences in seasonal GHG emission, GWP, GHGI, photosynthetic efficiency, transpiration rate and grain productivity among the rice varieties. A good correlation of CH4 and N2O emission was recorded with GWP, GHGI, CEE and transpiration rate of the varieties. GWP and GHGI of the varieties Abhishek and Lachit were relatively low while grain productivity was high during both the years of experimentation. The results from this study suggest that cultivation of rice varieties with lower GHG emission efficiency accompanied by higher grain productivity can be an effective environment friendly biological mitigation strategy for emission reduction of GHG and global warming.
Key words: Methane, Nitrous Oxide, global warming potential, greenhouse gas intensity, carbon emission efficiency, photosynthetic efficiency.
Rice is an important staple food for more than half of the world population and provides ~19% of dietary energy globally [1]. Worldwide ~190Mha of area is dedicated to rice cultivation [2] and the demand for rice is expected to increase globally by 35% by 2030 [3].There is a need to increase the global agricultural productivity by 60-110% to provide food security by 2050 [1,4]. Various socio-economic constraints restrict the chances to expand area under rice cultivation. Hence to meet the increasing demand, per unit area rice production should be raised.
India is one among the top three rice growing nations but its yield growth rate per year is only 1.0% which is too low to ensure global food security by 2050 [1]. India cultivates about 44.4Mha of rice under four major agro-ecosystems, viz. irrigated (~22Mha), rainfed lowland (~14.4Mha), flood prone (~2.04Mha) and rainfed upland (~6 Mha) ecosystems. Indian rice ecosystems represent 49.5% of irrigated areas, 32.4% of rainfed lowlands, 4.6% of flood-prone areas and 13.5% of rainfed uplands cultivated to rice in the entire world [5]. No country other then India in the world has such diversity in rice ecosystems.
Assam, a state of far eastern part of India, a region inhabited by large number of ethnic groups and variation in their preferences to food and food habit is responsible for the evolution of a large number of indigenous rice cultivars in the region. Rice paddy contributes towards the emission of two most important GHGs responsible for global warming: Methane (CH4) and Nitrous Oxide (N2O). Rice fields are reported to contribute about 30% and 11% of CH4 and N2O emission respectively to the atmosphere [6]. Atmospheric N2O concentration has increased by 18% compared to the preindustrial level, with a linear increasing rate of 0.26% per year during the recent few decades [7]. There are several reports on contribution of rice paddy on significant quantity of emission of CH4 and N2O from North East region of India [8,9,10]. These two gases have a long atmospheric lifetime of 12 and 114 years respectively and accounts for 20% and 7% respectively to the global radiative forcing [7]. High GWP of 34 (CH4) and 298 (N2O) times that of CO2 at a 100-yr time horizon makes them a major contributor to climate change [11]. There is an urgent need to opt for solutions to meet the projected demand of rice yield while lowering greenhouse gas (CH4 and N2O) emission for a sustainable environment.
Mitigation of GHG emission plays a significant role in addressing climate change. Although many studies have been done for characterization of GHG emission from agricultural soils but mitigation needs more attention from country like India where agriculture is the dominant sector. Among the major cereals in the world, rice has a higher GWP of 3.8 Mg CO2 ha–1 season–1, than wheat (Triticum aestivum, 0.7Mg CO2 ha–1 season–1) and maize (Zea mays, 1.4Mg CO2 ha–1season–1), suggesting the importance of mitigating the GWP of rice eco-systems [12]. Investigation on individual contributions of CH4 and N2O to the atmosphere from an agricultural crop may give an understanding on control of global warming impact of a crop ecosystem [13]. It has been reported in many studies that plant factors regulates the GHG emission potential of a crop [14,15,10], therefore their might be differences in GWP and GHGI of different rice cultivars grown under the same ecosystem.The present investigation is an attempt to identify low GHG emitting rice variety with better yield scale. In this study eight pre-monsoon rice varieties (Dikhow, Disang, Jaya, Kolong, Kopilee, Lachit, Swabhagi and Abhishek) were investigated with the following objectives: (a) to estimate the CH4 and N2O flux, GWP, GHGI and CEE of the rice varieties, (b) to study the plant parameters (viz. photosynthetic efficiency, transpiration rate and grain productivity) of the varieties and work out a relationship of GHG emission with plant parameters. Further we tried to identify a suitable rice variety with lower GHG emission potential (CH4 and N2O) along with higher grain yield.
2.1. Site description and field management:
A field experiment was conducted in the experimental farm of Tezpur University (26˚41´ N latitude and 92˚499´ E longitude) which is located in the North Bank Plain Agro-climatic Zone of Assam, India. The experiment was carried out for two consecutive rice growing seasons (April-September) of 2016 and 2017. The region is subtropical humid and is characterized by moderately hot wet summers and dry winters. Maximum and minimum average daily temperature during the crop growth period was 31.64–24.65 ˚C (2016) and 31.15 –24.7 ˚C (2017). The total rainfall recorded during the experimental period was 426.0 mm in 2016 and 594.8 mm in 2017 (Figure 1).The soil is characterized as recent and old alluvium soils (typic endoaquepts) with sandy to sandy-loam texture (sand 54.47%, silt 17.1%, clay 27.42%) in the top 15 cm soil and slightly to moderate acidic soil pH (5.4) with bulk density of 1.45 Mg m-3, porosity 37.05%, water holding capacity 47.02% and soil organic carbon 11.10 g kg-1, available N, available phosphorous and available potassium contents of 145.15 kg ha-1, 33.34 kg ha-1and 236.17 kg ha1 respectively in the top 15 cm soil.
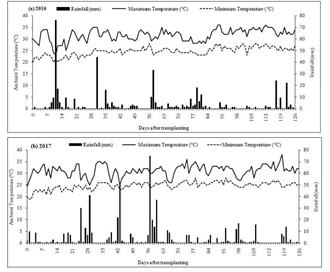
Figure 1: Meteorological graph showing maximum and minimum air temperature (°C) and rainfall (mm) during the crop growth period.
The experimental field was ploughed, puddled thoroughly to 15-cm depth, levelled and flooded 2-3 days before transplanting. The experiments were conducted in a randomized block design (RBD) with eight (8) varieties each replicated three (3) times (total plots 8 × 3 =24) in prepared plots (plot size, 3m × 2m) for two consecutive years (2016, 2017). The rice varieties selected for the experiment were Dikhow (V1), Disang (V2), Jaya (V3), Kolong (V4), Kopilee (V5), Lachit (V6), Swabhagi (V7) and Abhishek (V8) out of these, seven varieties (V1 to V7) were high yielding varieties and V8 was a popular indigenous variety. The 24 plots were prepared, keeping a gap of 0.5m between two plots. 30 days old seedlings of the rice varieties were transplanted in to the experimental plots in first week of May 2016 and 2017 at a spacing of 20×15 cm (plant×row). The NPK fertilizer was applied at a rate of 40:20:20 kg of N-P-K ha-1 in the form of urea, single super phosphate (SSP), and muriate of potash (MOP) as recommended by the Department of Agriculture, Government of Assam, India. The 1/3rd of N (as urea, 20 kg ha-1) was broadcasted as a basal application before the last ploughing. The remaining 1/3rd of N was applied at the tillering stage of each variety and the other 1/3rd of N was applied at panicle initiation stage. The whole of the P (20 kg ha-1) and K (20 kg ha-1 rate) was applied before transplanting. Irrigation was done during field preparation for proper mixing of the applied fertilizers before transplanting. The crop was allowed to grow after transplanting under rain fed condition (rainfall data are given in Figure 1). The variety Dikhow, Disang, Kolong, Kopilee, Swabhagi and Abhishek were harvested at 90-100 days after transplanting (DAT), Jaya and, Lachit were harvested at 105-115 DAT, depending on their physiological maturity. Agronomic practices in the field were followed as per the recommended practice for cultivation of rice.
2.2. Gas sampling and measurements:
CH4 and N2O flux from all the eight rice varieties were measured at 7-days intervals from the day of transplanting (0 DAT) until 2 weeks after harvest of the crop using the static chamber technique and gas chromatography methods [16,17]. The chambers of 50cm length, 30cm width and 90cm to 120cm height (depending upon the plant height) made of 6 mm thick acrylic transparent sheets were used for gas sampling. In each sampling plot, U-shaped aluminum channels (50 cm×30 cm) were inserted into the soil to a depth of 10 cm to accommodate the chambers. During gas sampling, the aluminum channel was filled with water, which acted as air seal when the chamber was placed on the channel. A battery operated fan was fixed inside the chamber to homogenize the inside air. A thermometer was also inserted in the chamber through a self-sealing rubber septum to monitor the inside temperature. A 50 ml syringe fitted with a three-way stopcock was used to draw gas samples from the chamber at an interval of 15 minutes (0, 15, 30, and 45 minutes). Gas samples were collected on every sampling day between 09:00 hour to 11:00 hour [18]. The samples were brought to the laboratory immediately after sampling and analyzed for CH4 and N2O concentrations using gas chromatograph (GC) (Varian 3800, USA). GC response was calibrated periodically using certified CH4 and N2O standard obtained from National Physical Laboratory, New Delhi, India. There are recent reports on suitability of closed chamber technique for screening large number of rice genotypes for GHG emission measurement [19].
Concentration of CH4 was determined by flame ionization detector (FID) and a chromopack capillary column (stainless steel column, 180 cm long and 3.2 mm outside diameter). Column, injector and detector temperature were maintained at 50, 90, and 150 °C, respectively. Methane flux was calculated from the temporal increase in the concentration of CH4 inside the box by the equation of Parashar et al., 1996 [20].
N2O fluxes were calculated from the linear increase in N2O inside the chamber during the gas sampling period [18] with an electron capture detector (ECD) and a stainless steel chromopack capillary column (50cm long, 0.53mm outside diameter, 1μm inside diameter).The temperature of the column, injector and detector were 80, 200, and 300 ˚C, respectively. The carrier gas was pure N2 (99.999%) with a flow rate of 15 ml min-1.
Seasonal emission of CH4 and N2O for the entire crop growth period was computed by following the formula of Ma et al., 2009 [21]:
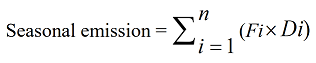
Where Fi indicates mean gas emission (CH4 or N2O) in the ith sampling interval, Di indicates the number of days and n is the total number of the measurements made during the experiment and expressed as kg ha−1.
2.3. Estimation of global warming potential, green house gas intensity and carbon equivalent emission:
To estimate the GWP, CO2 is typically taken as the reference gas and an increase or decrease in emission of CH4 and N2O is converted into CO2-equivalents by means of their GWPs. In this study, we used the IPCC 2013 [11] factors to calculate the combined GWPs for 100 years from the CH4 and N2O emitted from different rice varieties using the equation of Jain et al., 2014 [22]:
GWP = CH4 x 34 + N2O x 298
Greenhouse Gas Intensity (GHGI) was calculated by following the equation of Mosier et al., 2006 [23]:
GHGI = GWP/Grain yield
Carbon equivalent emissions (CEE) was calculated according to Bhatia et al., 2010 [24]:
CEE (kg C ha-1) = GWP x 12/44
2.4. Plant parameters analysis:
Gas exchange parameters viz., flag leaf photosynthesis and rate of transpiration were measured at panicle initiation and 50% flowering stage with an infrared gas analyzer (LI-6400, portable photosynthesis system, LI-COR, Lincoln, NE, USA). Four plants from each experimental unit were randomly selected for the measurement. The results presented are the mean of 12 readings from four experimental units (4×3 = 12) of each variety.
2.5. Soil sample collection and analysis:
Prior to rice cultivation soil samples were collected randomly from different locations of the experimental field from a depth of 0–15 cm for the basic physic chemical properties by following the methods of Page et al., 1982 [25].
2.6. Estimation of grain yield and yield attributing parameters:
Grain yield was recorded by harvesting the rice from 01 square meter (m2) area from each experimental unit. The grains were separated from the straw, dried and weighed. Number of fertile tillers per sq m, number of grains per panicle, filled grains percentage and thousand grain weight were counted manually [9].
2.7. Statistical analysis:
Collected data were statistically analyzed to determine whether there was any significant effect of varieties (V) and years (Y) and their interactions on the measured variables. Statistical analysis was performed by Analysis of Variance (ANOVA), Pearson correlation analysis, Least Significant Difference (LSD), Duncan multiple range test (DMRT) with the help of SPSS analytical tool (IBM SPSS 20, SPSS Inc., Chicago, USA). Pearson-correlation analysis was used to determine the significance of linear relationships between obtained variables. Standard error of mean of each replicates was also calculated.
3.1. Methane emission:
The emission of CH4 during early crop growth varied significantly at different growth stages after transplanting. Figure 2 (a–d) represents the seasonal variations in CH4 emissions of the crop during the growing period over the 02 years. Fluxes were relatively low during the initial growth period of the rice crop (0–7 DAT). The fluxes, however, increased to peaks of 0.345 (Dikhow), 0.405 (Disang), 0.383 (Jaya), 0.332 (Kolong), 0.404 (Kopilee), 0.356 (Lachit), 0.341 (Swabhagi) and 0.324 (Abhishek) µg m–2 h–1 during 2016 and 0.342 (Dikhow), 0.407 (Disang), 0.375 (Jaya), 0.326 (Kolong), 0.409 (Kopilee), 0.341 (Lachit), 0.358 (Swabhagi) and 0.317 (Abhishek) µgm–2 h–1 during 2017 at the active tillering stage of the crop growth (21-35 DAT). The fluxes decreased considerably at the end of the tillering stage, which coincides with the end of the vegetative growth. Thereafter, the fluxes increased gradually to second prominent peaks of 0.450 (Dikhow), 0.572 (Disang), 0.445 (Jaya), 0.392 (Kolong), 0.663 (Kopilee), 0.583 (Lachit), 0.530 (Swabhagi) and 0.425 (Abhishek) µg m–2 h–1 during 2016, and 0.454 (Dikhow), 0.549 (Disang), 0.463 (Jaya), 0.371 (Kolong), 0.665 (Kopilee), 0.575 (Lachit), 0.553 (Swabhagi) and 0.432 (Abhishek) µg m–2 h–1 during 2017 at the onset of there productive phase of crop growth (panicle-initiation stage, 42–70 DAT). Irrespective of the year, two prominent peaks of CH4 emission were observed at tillering and panicle-initiation stages and depending upon the varieties the peaks appeared at different days after transplanting. Emissions of CH4 decreased steadily until the rice cropwas harvested, although short pulse emissions occurred in between. Significant reduction in emission was observed after harvesting of the crop. The seasonal pattern of CH4 emission was similar in both the years (Figure 2, a–d). The differences in seasonal CH4 emission among the rice varieties were statistically significant (Table 1). Seasonal CH4 emission during the crop growth period was highest in the variety Swabhagi (6.87 kg ha-1 in 2016, 6.82kg ha-1 in 2017) and lowest in Abhishek during both the years of experimentation (5.22kg ha-1 in 2016 and 5.10kg ha-1 in 2017). The CH4 emission was in the order of Swabhagi > Jaya > Dikhow > Disang > Kopilee > Lachit > Kolong > Abhishek during 2016 and followed a similar order during 2017.

Figure 2: Methane emission recorded from fields planted with the rice varieties: (a, b) during 2016, (c, d) during 2017. Data presented are mean ± standard errors.
Table 1: Seasonal emission of CH4 and N2O, global warming potential, carbon equivalent emission and greenhouse gas intensity of rice varieties during 2016 and 2017.
|
|
Seasonal CH4 emission (kg ha–1) |
Seasonal N2O emission (kg ha–1) |
Global Warming Potential (kg CO2-eqiv. ha–1) |
Carbon Equivalent Emission (kg C ha–1) |
Greenhouse Gas Intensity (kg CO2-equiv. kg–1 grain yield) |
|
2016 |
|
|
|
|
|
|
Dikhow |
6.02 ± 0.04 c |
3.90 ± 0.04 bc |
1368.07 ± 12.65 c |
373.07 ± 3.45 c |
0.499 ± 0.004 d |
|
Disang |
6.50 ± 0.10 de |
4.19 ± 0.05 de |
1468.72 ± 18.39 de |
400.52 ± 5.02 de |
0.529 ± 0.017 d |
|
Jaya |
6.64 ± 0.06 e |
4.12 ± 0.03 cde |
1454.54 ± 11.24 cde |
396.65 ± 3.07 cde |
0.344 ± 0.008 abc |
|
Kolong |
5.41 ± 0.03 a |
3.65 ± 0.06 b |
1273.10 ± 19.00 b |
347.18 ± 5.11 b |
0.390 ± 0.010 c |
|
Kopilee |
6.34 ± 0.06 d |
3.94 ± 0.06 cd |
1390.57 ± 18.74 de |
379.21 ± 5.11 cd |
0.643 ± 0.012 e |
|
Lachit |
5.71 ± 0.04 b |
3.06 ± 0.03 a |
1105.79 ± 9.84 a |
301.55 ± 2.68 a |
0.306 ± 0.004 a |
|
Swabhagi |
6.77 ± 0.03 e |
4.32 ± 0.06 e |
1517.92 ± 19.86 e |
413.94 ± 5.41 e |
0.377 ± 0.004 bc |
|
Abhishek |
5.31 ± 0.03 a |
2.95 ± 0.04 a |
1060.32 ± 14.19 a |
289.15 ± 3.87 a |
0.330 ± 0.008 ab |
|
p value (V) |
0.000 |
0.000 |
0.000 |
0.000 |
0.000 |
|
LSD for V (p<0.05) |
0.130 |
0.120 |
39.007 |
10.636 |
0.022 |
|
2017 |
|
|
|
|
|
|
Dikhow |
5.96 ± 0.08 c |
3.89 ± 0.06 c |
1360.87 ± 15.34 c |
371.11 ± 4.18 c |
0.483 ± 0.004 c |
|
Disang |
6.51 ± 0.04 de |
4.17 ± 0.04 cd |
1464.78 ± 14.18 de |
399.45 ± 3.87 de |
0.540 ± 0.006 d |
|
Jaya |
6.57 ± 0.03 e |
4.11 ± 0.04 cd |
1447.63 ± 13.51 de |
394.77 ± 3.68 de |
0.340 ± 0.007 a |
|
Kolong |
5.38 ± 0.06 a |
3.62 ± 0.03 b |
1262.88 ± 10.93 b |
344.39 ± 2.98 b |
0.390 ± 0.005 b |
|
Kopilee |
6.29 ± 0.03 d |
3.91 ± 0.03 c |
1380.19 ± 10.28 cd |
376.38 ± 2.80 cd |
0.661 ± 0.006 e |
|
Lachit |
5.69 ± 0.05 b |
3.01 ± 0.07a |
1091.59 ± 20.06 a |
297.68 ± 5.47 a |
0.311 ± 0.004 a |
|
Swabhagi |
6.72 ± 0.03 e |
4.28 ± 0.06 d |
1505.20 ± 19.64 e |
410.47 ± 5.36 e |
0.378 ± 0.005 b |
|
Abhishek |
5.30 ± 0.07 a |
2.91 ± 0.07 a |
1048.57 ± 18.37 a |
285.94 ± 5.01 a |
0.317 ± 0.006 a |
|
p value (V) |
0.000 |
0.000 |
0.000 |
0.000 |
0.000 |
|
LSD for V (p<0.05) |
0.125 |
0.127 |
38.434 |
10.481 |
0.013 |
|
LSD for Y x V |
0.081 |
0.078 |
24.700 |
6.735 |
0.012 |
Note: Values (mean ± standard error) followed by same letters are not significantly different from each other in the same column at p< 0.05, according to Duncan’s multiple range test. LSD: Least significant differences, V: varieties, Y: year
3.2. Nitrous oxide emission:
The emission of N2O during early crop growth varied significantly across different times after transplanting. Seasonal variations in N2O emissions of the crops during the growing period is presented in Figure 3 (a–d). Fluxes were relatively low during the initial growth period of the rice crop (0–7 DAT).
Thereafter, the fluxes increased to peaks of 282.91 (Dikhow), 274.76 (Disang), 247.34 (Jaya), 249.01 (Kolong), 215.83 (Kopilee), 189.99 (Lachit), 353.76 (Swabhagi) and 145.91 (Abhishek) µg m–2 h–1 during 2016 and 246.95 (Dikhow), 256.45 (Disang), 268.26 (Jaya), 239.32 (Kolong), 231.50 (Kopilee), 174.52 (Lachit), 341.43 (Swabhagi) and 148.32 (Abhishek) µg m–2 h–1 during 2017 at the active tillering stage of the crop growth (21–35 DAT). It decreased considerably at the end of the tillering stage, which coincides with the end of the vegetative growth. Fluxes then increased gradually to second prominent peaks of 472.17 (Dikhow), 396.18 (Disang), 474.11 (Jaya), 362.75 (Kolong), 324.24 (Kopilee), 261.96 (Lachit), 450.86 (Swabhagi) and 394.62 (Abhishek) µg m–2 h–1 during 2016, and 452.36 (Dikhow), 388.32 (Disang), 364.32 (Jaya), 379.21(Kolong), 357.46 (Kopilee), 252.32 (Lachit), 461.32 (Swabhagi) and 387.47 (Abhishek) µg m–2 h–1 during 2017 at the onset of the reproductive phase of crop growth (panicle-initiation stage, 42–70 DAT). Few minor peaks were precieved at flowering stage (70-98 DAT) of the varieties of 283.58 (Dikhow), 337.37(Disang), 314.58 (Jaya), 266.76 (Kolong), 285.79 (Kopilee), 209.10 (Lachit), 409.56 (Swabhagi) and 248.74 (Abhishek) µg m–2 h–1 during 2016, and 272.35 (Dikhow), 313.21 (Disang), 295.32 (Jaya), 261.21 (Kolong), 264.90 (Kopilee), 152.64 (Lachit), 374.09 (Swabhagi) and 229.32 (Abhishek) µg m–2 h–1 during 2017. The order of N2O flux among the varieties were Swabhagi > Disang > Jaya > Kopilee > Dikhow > Kolong > Lachit > Abhishek during 2016 and a similar order was observed during 2017. Seasonal N2O emission rates weresignificantly different (p<0.05) among the varieties (Table 1).
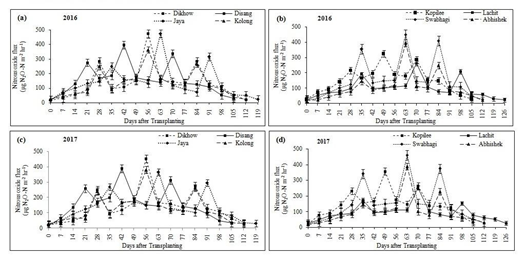
Figure 3: Nitrous oxide emission recorded from fields planted with the rice varieties: (a, b) during 2016, (c, d) during 2017. Data presented are mean ± standard errors.
3.3. Yield and yield related parameters:
Yield and yield attributing parameters like panicle m-2, grains per panicle, filled grain (%) and 1000-grain weight of rice varieties showed notable differences (Table 2). The grain yield of the rice varieties in the ecosystem ranges from 2133 to 4255 kg ha-1 and 2032 to 4295 kg ha-1during 2016 and 2017 respectively. More number of fertile tillers per unit area, grains per panicle and thousand grain weight resulted in higher economic yield in the variety Jaya followed by Swabhagi > Lachit > Kolong > Abhishek > Disang > Dikhow > Kopilee over 2 years. Grain productivity showed a good correlation with rate of photosynthesis (r = 0.371) and GHGI (r = -0.833) at (p < 0.01).
Table 2: Yield and yield attributing parameters of the rice varieties at harvest during 2016 and 2017.
|
|
Fertile tillers m-2 |
Grains panicle-1 |
Filled grains (%) |
1000 grain wt (gm) |
Yield (kg ha-1) |
|
2016 |
|
|
|
|
|
|
Dikhow |
410 ± 3 b |
82 ± 1 a |
55.16 ± 0.75 ab |
18.64 ± 0.37 ab |
2743 ± 13 b |
|
Disang |
396 ± 4 ab |
125 ± 1 c |
57.57 ± 0.75 bc |
19.83 ± 0.61 ab |
2787 ± 9 b |
|
Jaya |
479 ± 4 d |
129 ± 2 c |
71.35 ± 0.52 f |
23.16 ± 0.33 c |
4237 ± 7 f |
|
Kolong |
449 ± 1 c |
99 ± 5 b |
62.21 ± 0.51 de |
21.23 ± 0.18 bc |
3272 ± 4 c |
|
Kopilee |
389 ± 1 a |
80 ± 3 a |
52.27 ± 0.72 a |
17.03 ± 0.93 a |
2164 ± 14 a |
|
Lachit |
449 ± 3 c |
121 ± 1 c |
59.69 ± 0.79 cd |
23.89 ± 0.82 c |
3618 ± 13 d |
|
Swabhagi |
463 ± 2 cd |
130 ± 2 c |
76.68 ± 0.17 g |
23.09 ± 0.45 c |
4027 ± 14 e |
|
Abhishek |
386 ± 5 a |
119 ± 6 c |
64.94 ± 0.25 e |
21.18 ± 0.34 bc |
3220 ± 8 c |
|
p value (V) |
0.000 |
0.000 |
0.000 |
0.000 |
0.000 |
|
LSD for V (p<0.05) |
7.967 |
7.596 |
1.468 |
1.371 |
26.554 |
|
2017 |
|
|
|
|
|
|
Dikhow |
415 ± 1 b |
86 ± 1 a |
56.16 ± 1.24 ab |
18.31 ± 0.12 a |
2817 ± 9 c |
|
Disang |
396 ± 2 a |
127 ± 1 c |
58.57 ± 0.41 bc |
21.16 ± 0.57 b |
2710 ± 6 b |
|
Jaya |
480 ± 5 d |
127 ± 2 c |
71.02 ± 0.82 e |
24.49 ± 0.36 c |
4260 ± 16 h |
|
Kolong |
447 ± 1 c |
98 ± 4 b |
63.54 ± 0.42 d |
21.90 ± 0.50 b |
3235 ± 13 d |
|
Kopilee |
391 ± 2 a |
81 ± 3 a |
53.27 ± 0.72 a |
16.56 ± 0.44 a |
2088 ± 16 a |
|
Lachit |
450 ± 1 c |
119 ± 1 c |
60.02 ± 0.53 c |
22.56 ± 0.13 bc |
3508 ± 15 f |
|
Swabhagi |
460 ± 2 c |
129 ± 1 c |
75.35 ± 0.35 e |
22.42 ± 0.20 bc |
3983 ± 11 g |
|
Abhishek |
392 ± 5 a |
123 ± 3 c |
65.27 ± 0.30 d |
22.51 ± 0.39 bc |
3310 ± 9 e |
|
p value (V) |
0.000 |
0.000 |
0.000 |
0.000 |
0.000 |
|
LSD for V (p<0.05) |
6.745 |
5.686 |
1.637 |
0.916 |
30.321 |
|
LSD for Y x V |
4.758 |
4.311 |
1.026 |
0.805 |
28.959 |
Note: Values (mean ± standard error) followed by same letters are not significantly different from each other in the same column at p< 0.05, according to Duncan’s multiple range test. LSD: Least significant differences, V: varieties, Y: year.
3.4. Global Warming Potential,Carbon Equivalent Emission and Greenhouse Gas Intensity:
Statistical differences were observed among the varieties for GHG emission, GWP, GHGI and CEE (Table 1). GHG emission revealed a good correlation with GWP and CEE (p < 0.01) (Table 4). A good correlation of GWP with GHGI (r = 0.486) and transpiration rate (r = 0.820) at p < 0.01 was recorded. The GWP among the varieties over 2 years of experimentation was in the order of Swabhagi > Disang > Jaya > Kopilee > Dikhow > Kolong > Lachit > Abhishek. However, the GHGI shows a different trend due to difference in yield potential among the rice varieties and was in the order of Kopilee > Disang > Dikhow > Kolong > Swabhagi > Jaya > Abhishek > Lachit during both the seasons.
3.5. Plant parameters
There was a significant difference in flag leaf photosynthesis rate among the varieties (p < 0.05). The rate of photosynthesis was in the range of 20.73 to 27.97 μ mol CO2 m-2s-1 during 2016 and 20.10 to 28.02 μ mol CO2 m-2s-1 during 2017 (Table 3). Pool analysis of photosynthetic rate of the varieties throughout the season reveals the trend of photosynthetic efficiency as Kolong > Lachit > Swabhagi > Jaya > Kopilee > Disang > Abhishek > Dikhow.
The rate of transpiration among the varieties varied from 1.908 to 8.431 μmol H2O m-2s-1during 2016 and 2.114 to 9.352 μ mol H2O m-2 s-1 during 2017. The variety Swabhagi recorded the maximum transpiration rate followed by Disang, Jaya, Kopilee, Lachit, Dikhow, Kolong and Abhishek during both the seasons. The transpiration rate gradually increased upto flowering stage during the crop growing season and attained a range of 4.210 to 9.357 μmol H2O m-2s-1 (Table 3). The transpiration rate exhibited a strong correlation with CH4 (r = 0.907), N2O (r = 0.796) and CEE (r = 0.820) at p < 0.01(Table 4).
Table 3: Flag leaf photosynthetic rateand rate of transpiration of the rice varieties at two growth stages of the crop during 2016 and 2017.
|
Photosynthetic rate (μ mol CO2 m-2 s-1) |
Rate of transpiration (μ mol H2O m-2 s-1) |
|
Panicle initiation 50% Flowering |
Panicle initiation 50% Flowering |
2016
|
Dikhow |
20.84 ± 0.04 a |
23.66 ± 0.01 a |
2.529 ± 0.004 c |
6.635 ± 0.007 d
|
|
Disang |
22.58 ± 0.05 c |
25.26 ± 0.02 c |
4.657 ± 0.001 g |
8.205 ± 0.007 g
|
|
Jaya |
23.85 ± 0.01 e |
26.76 ± 0.01 e |
3.511 ± 0.000 f |
7.802 ± 0.008 f
|
|
Kolong |
25.32 ± 0.07 g |
29.14 ± 0.04 h |
2.447 ± 0.000 b |
5.166 ± 0.001 b
|
|
Kopilee |
23.31 ± 0.02 d |
25.94 ± 0.02 d |
3.131 ± 0.001 e |
7.242 ± 0.002 e
|
|
Lachit |
24.50 ± 0.05 f |
27.93 ± 0.02 g |
3.042 ± 0.000 d |
6.453 ± 0.001 c
|
|
Swabhagi |
24.30 ± 0.02 f |
26.92 ± 0.01 f |
4.955 ± 0.001 h |
8.430 ± 0.000 h
|
|
Abhishek |
21.90 ± 0.03 b |
24.91 ± 0.01 b |
1.915 ± 0.002 a |
4.215 ± 0.002 a
|
|
p value (V) |
0.000 |
0.000 |
0.000 |
0.000
|
|
LSD for V (p<0.05) |
0.100 |
0.05 |
0.003 |
0.01 |
2017
|
Dikhow |
20.20 ± 0.03 a |
24.66 ± 0.01 a |
2.374 ± 0.002 c |
6.103 ± 0.000 c
|
|
Disang |
22.37 ± 0.02 c |
25.72 ± 0.02 b |
3.815 ± 0.002 g |
8.716 ± 0.002 g
|
|
Jaya |
23.16 ± 0.01 d |
27.34 ± 0.07 d |
3.014 ± 0.000 f |
8.140 ± 0.002 f
|
|
Kolong |
26.48 ± 0.02 h |
29.50 ± 0.03 f |
2.323 ± 0.001 b |
5.987 ± 0.003 b
|
|
Kopilee |
23.60 ± 0.03 f |
26.19 ± 0.02 c |
2.943 ± 0.001 e |
7.423 ± 0.001 e
|
|
Lachit |
24.95 ± 0.01 g |
27.72 ± 0.07 e |
2.426 ± 0.001 d |
6.257 ± 0.002 d
|
|
Swabhagi |
23.35 ± 0.02 e |
27.17 ± 0.01 d |
4.225 ± 0.002 h |
9.355 ± 0.001 h
|
|
Abhishek |
21.54 ± 0.01 b |
25.64 ± 0.01 b |
2.126 ± 0.003 a |
5.052 ± 0.000 a
|
|
p value (V) |
0.000 |
0.000 |
0.000 |
0.000
|
|
LSD for V (p<0.05) |
0.05 |
0.094 |
0.004 |
0.004
|
|
LSD for Y x V |
0.218 |
0.179 |
0.157 |
0.192 |
Note: Values (mean ± standard error) followed by same letters are not significantly different from each other in the same column at p< 0.05, according to Duncan’s multiple range test. LSD: Least significant differences, V: varieties, Y: year.
Table 4: Pearson's correlation coefficients (r values) for different parameters
|
Parameters |
Methane emission |
Nitrous oxide emission |
Carbon equivalent emission |
Greenhouse Gas Intensity |
Global Warming Potential |
Rate of photosynthesis |
Rate of transpiration |
|
Carbon equivalent emission |
0.870** |
0.998** |
|
|
|
|
|
|
Greenhouse Gas Intensity |
0.357* |
0.494** |
0.486** |
|
|
|
|
|
Global Warming Potential |
0.870** |
0.998** |
1.000** |
0.486** |
|
|
|
|
Rate of photosynthesis |
-0.142 |
-0.082 |
-0.089 |
-0.330* |
-0.089 |
|
|
|
Rate of transpiration |
0.907** |
0.796** |
0.820** |
0.270 |
0.820** |
0.031 |
|
|
Grain productivity |
-0.162 |
-0.025 |
-0.041 |
-0.833** |
-0.041 |
0.371** |
-0.201 |
Note: **. Correlation is significant at the 0.01 level (2-tailed).
*. Correlation is significant at the 0.05 level (2-tailed).
4.1. Trend of GHG emission:
The variation in GHG emissions observed among the varieties suggests that the rate of emission and transport of greenhouse gas (CH4 and N2O) is influenced by the plant factors. Low emission of CH4 and N2O at early growth stage, might be due to limited substrate availability for both CH4 and N2O producing bacteria and also small quantity of biomass of the crop. The first prominent peak of CH4 and N2O was observed at tillering stage of each variety. Increased growth rate and development of the rice plants manifested as an increase in the canopy size and expansion of leaf blade surface area resulted in better conductance of GHG from soil to the atmosphere [26,27]. The applied fertilizer in the form of urea hydrolyses in the soil to NH4+ and NO3- ions and are the substrate for N2O production [28]. Higher rate of CH4 production is attributed by the availability of organic substrates in the form of plant derived C through processes like root exudation and release of sloughed off root cap cells and intensive reduced condition in the rice rhizosphere [29]. A gradual drop in emission after the maximum tillering stage might be the result of the vegetative lag phase of the growth period [30,31]. The application of the second dose of nitrogenous fertilizer at panicle initiation stage contributes to the high emission peaks at this stage. This increased emission rate is also facilitated by the increase in leaf surface area due to appearance of flag leaves. At flowering stage a minor N2O peak was observed due to higher rate of metabolic assimilation of the plants which might have influenced the microbial activity [32]. During the later stage of the crop growth the emission rate of CH4 and N2O declined due to senescence of older leaves and non availability of substrate as the crop approached maturity and our results are in good agreement with some recent findings [27,33]. Various factors such as supply of organic matter, size of the root space, availability of fertilizers, oxidation rate in the rhizosphere are reported to affect the GHG emission rates during tillering and panicle initiation stage [10,33-35]. There are several reports on the variations in CH4 and N2O emission from rice paddies during the growing period [10,18,19,31] which are in good agreement with the findings of present investigation. Our results of high peaks for CH4 and N2O at tillering and panicle initiation stage are well corroborated with some recent findings [10,18,36,37,31].
4.2. Difference in GWP, CEE and GHGI:
The results of the present study shows that transportation and emission of both CH4 and N2O to the atmosphere is influenced by the plant parameters. These results are well corroborated with the findings reported by Baruah et al., 2010 [8] and Shang et al., 2011 [38]. Plant and soil factors influence the seasonal CH4 and N2O emission from the rice paddies and their loading to the atmosphere, expressed as aggregate CO2-eqivalent GWP. The highest GWP is recorded from the field planted with variety Swabhagi and Disang, whereas variety Abhishek and Lachit recorded the lowest GWP. In the present study, GWP have a strong correlation with CEE which is in concordance with the findings of Bhatia et al., 2010 [24], Baruah et al., 2016a [34] and Bordoloi et al., 2018 [18]. Varietal difference in yield scale GWP i.e GHGI, is mainly contributed by the emission differences of the varieties [31,39] which might be the reason for highest GHGI recorded by the variety Kopilee and lowest by Lachit and Abhishek. In the present study, we have identified variety Abhishek and Lachit as most suitable rice variety with least GWP and CEE as they contribute less GHG (both CH4 and N2O) to the atmosphere. These two varieties also have better yielding ability in terms of economic yield (Table 2).
4.3. Plant factors influencing GHG emission:
Increased transpiration rate facilitate GHG transport to the atmosphere because in rice plants GHG is transported along with the transpiration stream through xylem and release through the open stomata [18,31]. This might be the probable reason for the observed correlation of transpiration rate with GHG emission and GWP (p < 0.01) and our results are well supported by some recent findings [14,18,31].
Genetic characteristics for carbon fixation and crop duration accredits the differences in photosynthetic efficiency among the varieties [40]. In the present study variation in flag leaf photosynthesis were observed among the varieties, the highest being recorded in variety Lachit followed by Kolong. We could not find any significant correlation of CH4 and N2O emission with photosynthetic rate of the varieties and the results are well corroborated with some recent findings [15,18,27,31,41].
4.4. Yield potential of the varieties:
Carew et al., 2009 [42] reported that a complex interaction between agricultural practices, genotypes and environmental factors results into yield development of a crop. The development of grain yield in crop is crucial to its flag leaf gas exchange characteristics. In the present study, the varieties Jaya and Swabhagi recorded superior yield and yield attributing characteristics along with its relatively higher photosynthesis rate over other varieties. This may be due to efficient photosynthate allocation towards the developing grain, which may have led to better yield development [15]. Grain productivity of the rice varieties shows an inverse relationship with GHGI. The possible reason might be relatively higher translocation of photosynthate towards the developing grain rather than towards other vegetative parts leading to higher grain yield and lower GHG emission as observed in variety Lachit and Kolong. Similar relationship is reported by Das and Baruah 2008a, 2008b, 2008c [26,43,44]. In low yielding variety like Kopilee and Disang less photosynthate allocation towards the grains and more towards the root indirectly enrich the carbon of the rhizosphere through root exudation resulting in higher GHG production and emission. These results are in concordance with the findings of Kuzyakov and Gavrichkova, 2010 [45] and Bharali et al., 2017a [10].
Observations from the present investigation helps us to draw a conclusion that variation in genetical characteristics among the varieties can result in variation in their ability to contribute towards greenhouse gas emission and global warming. We quantified the relationship of CH4 and N2O emissions with GWP, GHGI, CEE and different plant factors. We conclude that GWP of a variety is strongly affected by its rate of transpiration. Among the rice varieties Abhishek and Lachit, with lower GWP, GHGI and CEE accompanied by better grain productivity can be considered as relatively suitable rice variety over others. These two varieties emit less quantity of both CH4 and N2O, two important anthropogenic GHG which are produced in two contrasting soil environment (CH4 in anaerobic and N2O in aerobic soil environment). Cultivation of these varieties can be a suitable biological mitigation option for reduction of greenhouse gas emission and thus global warming. Differences in emission efficiency and grain productivity and their relationship with plant factors among the rice cultivars suggest that agricultural productivity and GHG mitigation can be simultaneously achieved by proper selection of rice varieties. Varieties Abhishek and Lachit can be recommended to the farmers for cultivation and policy makers to formulate the practice for adopting and popularizing these two varieties. Identification of suitable rice varieties which are equally efficient in reducing the emission of both CH4 as well as N2O bears significance for future climate change situation.
Supplementary material: Varietal description with parentage, stem type, days of panicle initiation and harvest.
|
Rice Cultivars |
Parentage |
Stem type |
Days of panicle initiation |
Days of harvest |
||
|
|
|
|
2016 |
2017 |
2016 |
2017 |
|
(V1) Dikhow |
Chilarai x Kalinga III |
Semi- dwarf |
56 |
55 |
98 |
99 |
|
(V2) Disang |
Lachit x Kalinga-3 |
Tall |
41 |
43 |
92 |
93 |
|
(V3) Jaya |
T(N)1 x T-141 |
Semi- dwarf |
60 |
62 |
106 |
107 |
|
(V4) Kolong |
Chilarai x Kalinga-3 |
Semi- dwarf |
54 |
55 |
99 |
100 |
|
(V5) Kopilee |
Heera x Annada 90 |
Semi- dwarf |
47 |
48 |
91 |
93 |
|
(V6) Lachit |
CRM-13-3241 x Kalinga-II |
Semi- dwarf |
68 |
70 |
112 |
114 |
|
(V7) Swabhagi |
IR5541-04 x Way Rarem |
Tall |
60 |
62 |
98 |
99 |
|
(V8) Abhishek |
Indigenous |
Semi- dwarf |
60 |
61 |
99 |
100 |
Note: The rice varieties are recommended and obtained from the Regional Rainfed Lowland Rice Research Station, Gerua, Kamrup, Assam.
We are grateful to Tezpur University, for providing financial support to carry out the present research work through Institutional fellowship to Dipti Gorh.
Authors contribution:
Gorh and K. K. Baruah contributes to the idea and design of the research and drafting of the manuscript. N. Gogoi contributes technical supervision to conduct the field experiments.
Ray DK, Muellet ND, West PC, Foley JA (2013) Yield trends are insufficient to double global crop production by 2050. PLOS one 8:e66428
View ArticleF.A.O. (2016) FAOSTAT. Food and agriculture data. Food and Agriculture Organization of the United Nations. (accessed 22 March 2018)
View ArticleYu L, Tang J, Zhang R, Wu Q, Gong M (2013) Effects of biochar application on soil methane emission at different soil moisture levels. Biol. Fertil. Soils. 49:119–128.
View ArticleTilman D, Balzer C, Hill J, Befort BL (2011) Global food demand and the sustainable intensification of agriculture. Proc. Natl. Acad. Sci. USA. 108:20260– 20264. PMid:22106295 PMCid:PMC3250154
View Article PubMed/NCBID. R. D.(2014) Status paper on rice. Chapter 4. Directorate of Rice Development.Government of India, Ministry of Agriculture & Farmer's Welfare, Patna.
Hussain S, Peng S, Fahad S, Khaliq A, Huang J, Cui K, Nie L (2015) Rice management interventions to mitigate greenhouse gas emissions: a review. Environ. Sci. Pollut. Res. 22:3342-3360. PMid:25354441
View Article PubMed/NCBIForster P, Ramaswamy V, Artaxo P, Berntsen T, Betts R, Fahey DW, Haywood J, Lean J, Lowe DC, Myhre G, Nganga J, Prinn R, Raga G, Schulz M, Van Dorland R (2007) Changes in atmospheric constituents and in radiative forcing. In: Solomon S, Qin D, Manning M, Chen Z, Marquis M, Averyt K, Tignor M, Miller H (Eds) Climate Change 2007: the physical science basis. Contribution of Working Group I to the Fourth Assessment Report of the Intergovernmental Panel on Climate Change. Cambridge University Press: UK and New York pp 129–234.
Baruah KK, Gogoi B, Gogoi P (2010) Plant physiological and soil characteristics associated with methane and nitrous oxide emission from rice paddy. Physiol. Mol. Biol. Plants 16:79-91. PMid:23572957 PMCid:PMC3550623
View Article PubMed/NCBIBordoloi N, Baruah KK, Maji TK (2016) Nitrous oxide emission from transplanted rice field in alluvial soil as influenced by management of nitrogen fertilizer. Soil Use and Management 32:573582.
View ArticleBharali A, Baruah KK, Gogoi N (2017a) Methane emission from irrigated rice ecosystem: relationship with carbon fixation, partitioning and soil carbon storage. Paddy Water Environment 15:221-236.
View ArticleIPCC: Intergovernment Panel on Climate Change (2013) Fifth Assessment Report (AR5) Contribution of Working Group III to Climate Change 2014: Mitigation of Climate Change.
Linquist BA, Arlene M, Borbe A, Pittelkow CM, Van Kessel C, Groenigen KJ (2012) Fertilizer management practices and greenhouse gas emissions from rice systems: A quantitative review and analysis. Field Crops Research 135:10–21.
View ArticleNishimura S, Akiyama H, Sudo S, Fumoto T, Cheng W, Yagi K (2011) Combined emission of CH4 and N2O from a paddy field was reduced by preceding upland crop cultivation. Soil Sci. Plant Nutr. 57:167-178.
View ArticlePangala SR, Gowing DJ, Hornibrook ERC, Gauci V (2014) Controls on methane emissions from Alnus glutinosa saplings. New Phytologist 201:887–896. PMid:24219654
View Article PubMed/NCBIBorah L, Baruah KK (2016a) Nitrous oxide emission and mitigation from wheat agriculture: association of physiological and anatomical characteristics of wheat genotypes. Environmental Science and Pollution Research 23:709-721. PMid:26335526
View Article PubMed/NCBIWang JY, Jia JX, Xiong ZQ, Khalil MAK, Xing GX (2011) Water regime- nitrogen fertilizer-straw incorporation interaction: Field study on nitrous oxide emission from a rice agroecosystem in Nanjing, China. Agric. Ecosyst. Environ. 141:437-446.
View ArticleBaruah KK, Gogoi B, Borah L Gogoi M, Boruah R (2012) Plant morphophysiological and anatomical factors associated with nitrous oxide flux from wheat (Triticum aestivum). J Plant Res 125:507–516. PMid:22146810
View Article PubMed/NCBIBordoloi N, Baruah KK, Thakur AJ (2018) Effectiveness of plant growth regulators on emission reduction of greenhouse gas (Nitrous oxide): An approach for cleaner environment. Journal of Cleaner Production 171:333-344.
View ArticleWassmann R, Alberto MC, Tirol-Padre A, Hoang NT, Romasanta R, Centeno CA, Sander BO (2018) Increasing sensitivity of methane emission measurements in rice through deployment of "close chambers" at nightime. PLoS ONE 13:e0191352. PMid:29390000 PMCid:PMC5794089
View Article PubMed/NCBIParashar DC, Mitra AP, Gupta PK, Rai J, Sharma RC, Singh N, Kaul S, Ray HS, Das SN, Parida KM, Rao SB, Kanungo SP, Ramasami T, Nair BU, Swamy M, Singh G, Gupta SK, Singh AR, Saikia BK, Batua AKS, Pathak MG, Iyer CSP, Gopalakrishnan M, Sane PV, Singh SN, Banerjee R, Sethunathan N, Adhya TK, Rao VR, Palit P, Saha AK, Purkait NN, Chaturvedi GS, Sen SP, Sen M, Sarkar B, Banik A, Subbarayam BH, Lal S, Venkatramanim S, Lal G, Chaudhary A, Sinha SK (1996) Methane budget from paddy fields in India. Chemosphere 33:737-757. 00223-8
View ArticleMa J, Ma E, Xu H, Yagi K, Cai Z (2009) Wheat straw management affects CH4 and N2O emissions from rice fields. Soil Biol Biochem. 41:1022-1028.
View ArticleJain N, Dubey R, Dubey DS, Singh J, Khanna M, Pathak H, Bhatia A (2014) Mitigation of greenhouse gas emission with system of rice intensification in the Indo-Gangetic Plains. Paddy Water Environ 12:355–363.
View ArticleMosier AR, Halvorson AD, Reule CA, Liu XJ (2006) Net global warming potential and greenhouse gas intensity in irrigated cropping systems in Northeastern Colorado. Journal of Environmental Quality. 35:1584–1598. PMid:16825479
View Article PubMed/NCBIBhatia A, Sasmal S, Jain N, Pathak H, Kumar R, Singh A (2010) Mitigating nitrous oxide emissions from soils under conventional and no tillage in wheat using nitrification inhibitors. Agric. Ecosyst. Environ. 136:247-253.
View ArticlePage AL, Miller RH, Keeney DR (1982) Methods of Soil Analysis, Part 2, Soil Science Society America, Madison, WI.
Das K, Baruah KK (2008a) A comparison of growth and photosynthetic characteristics of two improved rice cultivars on methane emission from rain fed agro ecosystem of northeast India. Agric. Ecosyst. Environ. 12:105-113.
View ArticleBorah L, Baruah KK (2016b) Effects of foliar application of plant growth hormone on methane emission from tropical rice paddy. Agriculture, Ecosystem and Environment 233:75–84.
View ArticleSutka RL, Ostrom NE, Ostrom PH, Breznak JA, Gandhi H, Pitt AJ, Li F (2006) Distinguishing nitrous oxide production from nitrification and denitrification on the basis of isotopomer abundances. Applied and Environmental Microbiology 72:638–644. PMid:16391101 PMCid:PMC1352222
View Article PubMed/NCBIKell DB (2012) Large-scale sequestration of atmospheric carbon via plant roots in natural and agricultural ecosystems: why and how. Philos. Trans. R. Soc. B. 367:1589–1597.
View ArticleMoldenhauer K, Wilson CE, Counce P, Jr Hardke J (2013) Rice growth and development. In: Hardke, J.T. (Eds) Arkansas rice production handbook. University of Arkansas Division of Agriculture, Cooperative Extension Service: Little Rock, AR, USA: 9–20.
Bharali A, Baruah KK, Gogoi N (2017b) Potential option for mitigating methane emission from tropical paddy rice through selection of suitable rice varieties. Crop and Pasture Science 68:421–433.
View ArticleChawanakul S, Chaiprasert P, Towprayoon S, Tanticharoen M (2009) Contributions of available substrates and activities of trophic microbial community to methanogenesis in vegetative and reproductive rice rhizospheric soil. J. Environ. Biol. 30:119–127. PMid:20112873
PubMed/NCBIDas S, Adhya TK (2014) Effect of combine application of organic manure and inorganic fertilizer on methane and nitrous oxide emissions from a tropical flooded soil planted to rice. Geoderma 213:185192.
View ArticleBaruah A, Baruah KK, Gorh D, Gupta P (2016a) Effect of organic residues with varied Carbon – Nitrogen ratio on grain yield, soil health and nitrous oxide emission from a rice agroecosystem. Communication in Soil Science and Plant analysis 47:1417–1429.
View ArticleBaruah A, Baruah KK, Bhattacharya P (2016b) Comparative Effectiveness of Organic Substitution in Fertilizer Schedule: Impacts on Nitrous Oxide Emission, Photosynthesis, and Crop Productivity in a Tropical Summer Rice Paddy. Water, Air and Soil Pollution 227:410-423.
View ArticleSuryavanshi P, Singh YV, Prasanna R, Bhatia A, Shivay YS (2013) Pattern of methane emission and water productivity under different methods of rice crop establishment. Paddy and Water Environment. 11:321–329.
View ArticleWang W, Lai DYF, Sardans J, Wang C, Datta A, Pan T, Zeng C, Bartrons M, Penuelas J (2015) Rice straw incorporation affects global warming potential differently in early vs. late cropping seasons in Southeastern China. Field Crops Research 181:42–51.
View ArticleShang Q, Yang X, Gao C, Wu P, Liu J, Xu Y, Shen Q, Zou J, Guo S (2011) Net annual global warming potential and greenhouse gas intensity in Chinese double rice-cropping systems: a 3-year field measurement in long-term fertilizer experiments. Global Change Biology 17:2196–2210.
View ArticleFeng J, Chen C, Zhang Y, Song Z, Deng A, Zheng C, Zhang W (2013) Impacts of cropping practices on yield-scaled greenhouse gas emissions from rice fields in China: Ameta-analysis. Agric. Ecosyst. Environ. 164:220–228.
View ArticleHirasawa T, Ozawa S, Taylaran RD, Ookawa T (2010) Varietal differences in photosynthetic rates in rice plants, with special reference to the nitrogen content of leaves. Plant Prod. Sci. 13:53-57.
View ArticleJiang Y, Huang X, Zhang X, Zhang Y, Zheng C, Deng A, Zhang J, Wu L, Hu S, Zhang W (2016) Optimizing rice plant photosynthate allocation reduces N2O emissions from paddy fields. Sci. Rep. 6:29333. PMid:27378420 PMCid:PMC4932627
View Article PubMed/NCBICarew R, Smith EG, Grant C (2009) Factors influencing wheat yield and variability: evidence from Manitoba, Canada. J. Agric. Appl. Econ. 41:625–639.
View ArticleDas K, Baruah KK (2008b) Association between contrasting methane emissions of two rice (Oryza sativa L.) cultivars from the irrigated agro-ecosystem of northeast India and their growth and photosynthetic characteristics. Acta Physiologiae Plantarum 30:569-578.
View ArticleDas K, Baruah KK (2008c) Methane emission associated with anatomical and morphological characteristics of rice (Oryza sativa) plant. Physiol. Plant. 134:303–312. PMid:18507814
View Article PubMed/NCBIKuzyakov Y, Gavrichkova O (2010) Time lag between photosynthesis and carbon dioxide efflux from soil: a review of mechanisms and controls. Global Change Biol. 16:3386-3406.
View Article