Adeoye B. K
Email: bkadeoye@futa.edu.ng
© 2019 Sift Desk Journals. All Rights Reserved
VOLUME: 5 ISSUE: 1
Page No: 18-26
Adeoye B. K
Email: bkadeoye@futa.edu.ng
ADEOYE B. K.1*, AKINBODE B. A.1, ADESIDA A. A.1 and Akpa C. T.2
1Department of Food Science and Technology, Federal University of Technology, Akure, Ondo State, Nigeria.
2Department of Food, Federal Institute of Industrial Research, Oshodi, Lagos, Nigeria
Adeoye Babatunde Kazeem, AKINBODE Badiu Akinola, ADESIDA Adewumi. A., Akpa Chinagorom T., Production and Evaluation of a Protein-Enriched Meal from Composite Flour of Cassava, Rice and Soybean(2020)Journal of Food Science & Technology 5(1) p:18-26
The study aimed at production and evaluation of composite flour produced from cassava, rice and soybean flours. Four blends of composite flours were prepared by mixing rice flour, cassava flour and soybean flour in the proportions of 30:40:30, 30:50:20, 30:60:10 and 30:70:0 and labelled T1, T2, T3 and T4 respectively. Composite flours produced were analysed for proximate, mineral, pasting and functional properties, sensory evaluation and hydrogen cyanide determination. The moisture content, protein, ash, fat, crude fiber and carbohydrate of the composites ranged from 11.57-12.40% dry bases, 1.37-13.17%, 0.37-0.74%, 0.12-0.34%, 3.23-3.65% and 70.48-82.37% respectively. The magnesium, iron, calcium and phosphorus of the composites in conc/ppm ranged from 184.67-221.33, 9.033-10.03, 216.33-544.66 and 0.167-3543.67 respectively while zinc was not detected. There was no significant difference (P > 0.05) recorded for pH, bulk density, swelling power, solubility index, water absorption capacity, oil absorption capacity and dispensability of the four blends of composite flour. The ranges of Peak 1, trough 1, breakdown, final viscosity, set back, peak time and pasting temperature are 737.00-1818.00 cP, 661.00-1369.00 cP, 62.00-449.00 cP, 868.00-1894.00 cP, 207.00-525.00 cP, 4.73-4.93 min and 75.85-77.65 oC respectively. There is no significant difference in all the attributes that were accessed at (P < 0.05) and the samples were generally acceptable by the panelists although sample T2 was the most generally accepted. The hydrogen cyanide content of the samples ranged from 3.42 to 3.60 mg/kg which is very safe when compared with standard lethal dose (10 mg/kg) recommended by Food and Agricultural Organization (FAO). Hence, it was concluded that the composite flours from rice, cassava, and soybean flour had the physicochemical and functional properties which is suitable for making an enriched meal and sample T2 containing 30% Rice Flour, 50% Cassava Flour and20% Soybean flour was the most generally accepted.
Keywords: Protein-enriched meal, malnutrition, composite flour, functional food, soybean flour
In a country where food security is not highly guaranteed due to increase in population and the economic epileptic, people tend to consume what they can afford or have access to, financially rather than what they need. Research efforts in developing countries have been focused on the improvement of protein quality of wheat-based product in order to reduce protein malnutrition. In Nigeria moreover, this has spurred pragmatic research on compositing flour from locally cultivated cereals, legume to reduce whole wheat dependency of the food intake.
Cassava(Manihot esculenta spp.) is a gluten-free root crop, rich in starch and used as staple food in tropical countries. Nigeria is its World’s highest producer and is classified as either sweet or bitter depending on the levels of anti-nutritional or cyanide factors (FAO, 2006). The rate at which cassava is consumed in developing countries is high, about 70% of cassava production is used as food in Africa and majorly processed into products such as garri, lafun, fufu and kpokpogari often taken with egunsi or leafy vegetable soup (Sanni, et al., 2009). Lafun is one of the local names given to cassava flour in Nigeria. It is produced through fermentation process and sun drying before milling into flour. It is a meal containing a very high amount of carbohydrate and its major limitation like other native meals include low protein content, low minerals, and vitamins and present of cyanide; toxic content.
Rice (Oryza sativa) is a gluten free cereal staple food in Nigeria. Rice flour which is a form of flour made from finely grounded milled rice (Rosniyan et al., 2009) can be used as a wheat flour replacement since it lacks gluten and contains low levels of sodium and a high amount of easily digested carbohydrates, making it desirable in celiac diets (Danbaba et al., 2014).
Soybean (Glycine max) is an important source of inexpensive and high quality source of protein and oil. With an average protein content of 40% and oil content of 20%, soybean has the highest protein content of all food crops and is second only to groundnut in terms of oil content among food legumes (Ibrahim et al., 2008). Soybean is rich in calcium, iron, phosphorus and vitamins, and also the only source of all the essential amino acids. Soybean proteins are rich in lysine but deficient in sulphur containing amino acids, whereas cereal proteins are deficient in lysine, but have adequate amounts of sulphur amino acids (Tharise, et al., 2014). The biological availability of minerals may be impaired due to presence of anti-nutrient factors such as trypsin and phytates that interferes with mineral absorption and palatability of the legume (Gebrelibanos et al., 2013). The phytates are however removed from soybeans during boiling or precooking operation through leaching into the boiling water which is then drained off before drying and milling into flour (Soetan and Oyewole, 2009)
Nutritional deficiency is a major limitation in native meals such as cassava products and this causes poor nutrition and leads to poor health conditions such as marasmus and kwashiorkor. More than 840 million people lack access to enough food to meet their daily basic needs, while more than one third of the world’s children are stunted due to diets inadequate in quantity and quality (Bankole, et al., 2013). Several efforts have been made to address the protein deficiencies of native meals such as cassava products in Nigeria. Possible solution that has been administered is the formulation of composite flour by blending flour from cereals and legumes which are rich in protein and minerals with flour from roots and tubers which are high in carbohydrates in proper proportion to make a balanced enriched meal. The incorporation of soybeans, groundnut and other legume seeds protein into cassava meal has been shown to yield fortified products of high protein values (Famurewa and Emuekele, 2014). In addition, use of composite flour serve as an alternative meal for people with gluten intolerance suffering from celiac disease which is as a result of consuming meals with high gluten content such as wheat flour. Some studies were reported on the use of cereal-tuber-legume combination for the production of various products (Akubor and Ukwuru, 2005; Oladunmoye et al., 2010; Kadam et al., 2012). It can be deduced from previous research reports that the nutritional qualities of product depend on the proportional composition of the composite flour properties (Oladunmoye et al., 2010).
This study is therefore, one of the efforts to promote the use of composite flours from locally grown crops (cassava and rice) with soybean which aimed at producing a native meal enriched with protein and minerals available to consumers of various standard of livelihood.
2.1 Materials
Cassava was purchased from Ogbese market, Akure Nigeria, soybean was purchased from Oba main market, Akure Nigeria while the rice specie used (popularly called tuwo rice or white rice) was obtained from mile 12 market, Lagos Nigeria. Chemical reagents for analyses were obtained from Pascal chemicals, Matador pharmaceuticals and FST food processing laboratory Akure, Nigeria.
2.2 Methods
2.2.1 Sample preparation and formulation of composite flour
Sample were prepared and formulated according to Dautant et al., 2007. Cassava roots were sorted, peeled, cut into smaller pieces and rinsed in clean water after which it was steeped for 3 days. After 72 hours, the steeped cassava were pulped into slurry, bagged, dewatered and then dried in a hot air oven at 60 0C for 3-4 hours after which it was milled. Raw rice grain were washed, parboiled, drained and dried at 50 0C for 2-3 hours after which it was milled. Soybean seeds were sorted, cleaned by rinsed in clean water, steeped for 30 minutes and boiled for 40 minutes. It was then drained, dried at 50 0C for 2-3 hours and milled. Dehulling step was skipped in order to increase the fibre content of the meal.
The flour were blended together in various ratio per 100 grams as shown in Table 1 using an automated mixer. The constant percentage of rice flour at 30% is due to its ability to increase the viscosity, elasticity and a solid dough of composite flour (Dautant et al.,2007). The different intervals of cassava flour and soybean flour used is to focus on the effect of the different ratio of each of flour on the characteristics of composite flours. The composite flour samples were sieved and packaged in polyethylene bags.
Table 1. Proportion table for composite flour blending
|
SAMPLE CODE |
RICE FLOUR (%) |
CASSAVA FLOUR (%) |
SOYBEAN FLOUR (%) |
|
T1 |
30 |
40 |
30 |
|
T2 |
30 |
50 |
20 |
|
T3 |
30 |
60 |
10 |
|
T4 |
30 |
70 |
0 |
2.2.2 Proximate Analysis
Proximate analysis of the composite flour samples was carried out using the method described by AOAC (2000). This was done to determine moisture content, protein, fat, ash content, crude fiber, carbohydrate and cyanide content.
2.2.3 Functional properties analysis
pH determination
It was determined according to AOAC (1990). The pH of the samples was measured with a pH meter. 10 g of each sample collected especially were homogenized in 50 ml of distilled water. The resulting suspensions were decanted and their pH determined using pH meter already standardized with buffer solutions of pH 4.0 and 7.0.
Bulk density determination
It was determined according to Bankole et al., (2013). 50 g flour sample was put into a 100 ml measuring cylinder. The cylinder was tapped several times on a laboratory bench to a constant volume. The volume of sample was recorded.
Bulk density(g/ml)=(Weight of sample)/(Volume of sample after tapping) (1)
Solubility index and Swelling power determination
It was determined according to Adebowale et al, 2012. 1.0g of flour sample was placed into a pre-weighed centrifuge tube. 40.0 ml of distilled water was then added and stirred. The mixture was placed on a water bath thermostatically controlled at 85°C with continuous stirring for 30 min. It was cooled to room temperature and then centrifuged at 2,200 rpm for 15 min. The supernatant was poured into a pre-weighed crucible and then placed in the oven to evaporate. The solid residue in the crucible was weighed again and the difference in weight calculated as percentage solubility using equation 2. The paste in the tube was then weighed and the swelling power determined from equation 3.
% Solubility=(Weight of soluble starch)/(Weight of original sample)×100% (2)
% Swelling power=(Weight of sediment paste)/(Weight of original sample)×100% (3)
Dispensability
It was determined according to Bankole et al., (2013). 10g of sample was placed in 100 ml measuring cylinder and distilled water was added to reach the graduated volume 100 ml. The mixture was stirred vigorously and allowed to settle for 3 hours. The volume of the settled particles was recorded and deducted from 100 and the difference reported as percentage dispensability.
Water absorption capacity
It was determined according to Adebowale et al., (2005). About 10ml of distilled water was added to 1g of the sample in a beaker. The suspension was stirred using magnetic stirrer for 3minutes. The suspension obtained was thereafter centrifuged at 3500rpm for 30 minutes and the supernatant was measured into a 10ml graduated cylinder. The density of water was taken as 1.0g/ml. The water absorbed by the flour was calculated as the difference between the initial volume of the water and the volume of the supernatant. The water absorption capacity is calculated as shown in equation 4.
WAC=(Volume of water used-Volume of water absorbed)/(Weight of Sample)×100 (4)
Oil absorption capacity
Oil absorption is an index of the amount of oil retained within a protein matrix under certain conditions. It was determined according Adebowale et al., (2005).About 10ml of oil known specific gravity was added to 1g of sample in a beaker. The suspension was stirred using magnetic stirrer for 3minutes. The suspension obtained was thereafter centrifuged at 3500rpm for 30minutes and the supernatant was measured into a10ml granulated cylinder. The density of oil used was 0.931g/ml. The oil absorbed by the flour was calculated as the difference between the initial volume of the oil and the volume of the supernatant as shown in equation 5.
OAC=((Volume of oil used-Volume of oil unabsorbed)×Density of oil)/(Weight of sample)×100 (5)
2.2.4 Pasting Properties Analysis
The pasting properties of the flour samples were determined using the rapid visco analyzer (RVA) according to (Newport scientific, Narrabeen Australia) as described by (Ikegwu et al., 2009), by adding 3 g of the samples plus 50 ml distilled water each. The paddle was placed into canisters containing the samples and water. The samples were then inserted in the rapid visco analyzer. The analysis was carried out at a programmed heating and cooling cycle where the samples were held at 50oC for 1 minute, heated at 95oC for 3.8 minutes and held at 50oC for 1.4 minutes and the pasting performance of the flour samples were automatically recorded on the graduated sheet of the instrument. The Rapid Visco Analyzer is a microprocessor controlled instrument designed to apply variable temperatures and shear rate to a hydrated starch or flour samples while measuring the sample’s change in viscosity.
2.2.5 Mineral Content Analysis
Sample ashing
Porcelain crucible was washed, dried and cooled in a desiccator. 1g of each sample was weighed into the clean crucible and covered with lid. The crucible and its content were then transferred into the muffle furnace to be maintained at 5500C for 6 hours for complete ashing. The crucible was removed from the furnace and cooled in the desiccators.
Sample digestion
The ash was the transferred into clean 100ml sample bottles. A certain quantity of distilled water of not up to 70ml was poured into a measuring cylinder, 5ml of nitric acid and 5ml of hydrochloric acid were added and distilled water was added to make it up to 100ml. The acid solution was poured into the sample bottle and tightly covered. Mineral contents of the samples were analyzed using atomic absorption spectrophotometry. Phosphorus (P) was determined using titrimetric method.
Mineral(conc/ppm)=(Machine Reading×Total Volume)/(Weight of sample) (6)
2.2.6 Data Analysis
The flour samples data were statistically analyzed using SPSS (Statistical Package for the Social Sciences) Version 16 for PC Windows. All data were subjected to Analysis of Variance (ANOVA) and means were separated using Duncan’s Multiple Range Test (DMRT). Data was presented as mean ± standard error. Differences were considered significant if Probability is less than 5% (P ≤0.05) for both sets of data.
3.1 Proximate Composition of Composite Flour
The proximate composition of the composite flour is presented in Table 2. Proximate composition of the flour revealed that the more the soybean content, the more the protein, fat, fibre and ash contents increased and the moisture and carbohydrate content decreased.
The moisture content of the samples T1, T2, T3 and T4 are 11.57%, 11.77%, 12.27% and 12.40% respectively. The lower the moisture content of the product to be stored, the better the storage stability, which also indicates potential for longer shelf-life of dried products (Akubor, 1997).The fat content of the samples are 0.34%, 0.32%, 0.17% and 0.12% respectively, generally soybean is high in fat and is responsible for the increase in the composite flour samples with increasing soybean. The fat content however is low enough not to allow occurrence of rancidity. The total ash content of the composite flour samples are 0.74%, 0.60%, 0.48% and 0.37% respectively. This could be attributed to the removal of the other components of the composite flour. The ash content of flour is simply a measure of its mineral content. The crude fiber of the flour samples are 3.65%, 3.81%, 3.49% and 3.23% respectively. Increase in fibre content is attributed to the fact that the soybean was not dehulled during processing into flour. The protein content of flour are 13.17%, 9.03%,4.73% and 1.37% respectively while carbohydrate content are 70.48%,74.56%, 78.85% and 82.37% respectively. Gradual increase in soybean content causes rise in the protein content as expected and reduces the carbohydrate content. However, the carbohydrate which is an inexpensive source of food energy is still adequate enough in the flour to serve its required function i.e. serve as good source of energy.
Table 2. Proximate composition of coposite flour samples
|
Sampe Code |
Moisture (%) |
Protein (%) |
Ash (%) |
Fat (%) |
Fibre (%) |
Carbohydrate (%) |
|
T1 |
11.57+0.58d |
13.17+0.06a |
0.74+0.001a |
0.34+0.006a |
3.65+0.005b |
70.48+0.01d |
|
T2 |
11.77+0.58c |
9.03+0.06b |
0.60+0.002b |
0.32+0.01b |
3.81+0.005a |
74.56+0.006a |
|
T3 |
12.27+0.06b |
4.73+0.58c |
0.48+0.001c |
0.17+0.01c |
3.49+0.006c |
78.85+0.01b |
|
T4 |
12.40+0.10a |
1.37+0.06d |
0.37+0.001d |
0.12+0.006d |
3.23+0.006d |
82.37+0.006a |
Values are means ± standard deviation of three determinations
Values on the same column followed by same letter are not significantly different (P < 0.05)
T1=30% Rice Flour, 40% Cassava Flour, 30% Soybean flour
T2=30% Rice Flour, 50% Cassava Flour, 20% Soybean flour
T3=30% Rice Flour, 60% Cassava Flour, 10% Soybean flour
T4=30% Rice Flour, 70% Cassava Flour, 0% Soybean flour
3.2 Mineral Composition of Composite Flour
The mineral composition of the composite flour is presented in Table 3. Magnesium content (conc/ppm) of the flour ranged from 184.67 to 221.33 with sample T1 with highest formulation of soybean having the highest magnesium content of 221.33 followed by sample T2 with content of 210.67, then sample T3 with magnesium content of 207.67 and lastly, sample T4 with magnesium content of 184.67. Calcium content also gradually increased with increasing soybean flour content from 216.33 to 544.66. Calcium content however is higher than magnesium content. Phosphorus content in sample T4 was very minute and almost not detectable but increased with increasing soybean content from 0.167 to 3543.67. Iron content of the composite flour was not greatly increased and ranged from 9.033 to 10.03 while zinc was not detectable. Zinc and iron are trace elements of minor constituent in soybeans and are of nutritional importance (Iwe et al., 2016).
Table 3. Mineral composition of composite samples(CONC/PPM)
|
Sample Code |
Magnesium (Mg) |
Iron (Fe) |
Zinc (Zn) |
Calcium (Ca) |
Phosphorus (P) |
|
T1 |
221.33+0.58a |
10.03+0.06b |
ND |
544.66+0.58a |
3543.67+0.57a |
|
T2 |
210.67+0.57b |
11.03+0.06a |
ND |
425.33+0.58b |
2544.33+0.58b |
|
T3 |
207.67+0.58c |
3.033+0.06d |
ND |
351.33+0.58c |
1720.33+0.58c |
|
T4 |
184.67+0.58d |
9.033+0.06c |
ND |
216.33+0.58d |
0.167+0.577d |
Values are means ± standard deviation of three determinations
Values on the same column followed by same letter are not significantly different (P < 0.05)
T1=30% Rice Flour, 40% Cassava Flour, 30% Soybean flour
T2=30% Rice Flour, 50% Cassava Flour, 20% Soybean flour
T3=30% Rice Flour, 60% Cassava Flour, 10% Soybean flour
T4=30% Rice Flour, 70% Cassava Flour, 0% Soybean flour
ND=Not Detected or No Detectable Value
3.3 Functional Properties of Composite Flour
The functional properties of the composite flour samples are presented in Table 4. The pH of the composite flour ranges from 4.30 to 5.91 which shows reduction in acidity level of the flour. The initial high acidity level was as a result of high cassava flour content in the composite flour which contained high acid produced during fermentation. This acidity however was reduced with increasing soybean content in the flour. Bulk density (g/ml), water and Oil absorption capacity (%) of samples ranges from 0.79 to 0.88, 54.83 to 63.37 and 152.83 to 244.53 respectively; while dispersibility (%) of the samples in water ranges from 71.17 to 72.17, indicating that sample T4 with higher dispensability has highest reconstitution time followed by T3, T2 and then T1 having the lowest reconstitution time. Dispersibility is a measure of the degree of reconstitution of starch flour in water. The higher the dispersibility, the better the flour reconstitutes in water (Kulkarni et al., 1991).
Table 4. Functional properties of composite flour samples
|
Sample Code |
pH |
Bulk Density (g/ml) |
Swelling Power (g/g) |
Solubility Index (%) |
Oil Absorption Capacity (%) |
Water Absorption Capacity (%) |
Dispensability (%) |
|
T1 |
5.91+0.01a |
0.79+0.01c |
11.96+0.02a |
16.10+0.10a |
152.83+105.8a |
63.37+0.06a |
71.17+0.29b |
|
T2 |
5.60+0.01b |
0.83+0.01b |
11.86+0.01b |
14.17+1.53b |
122.27+26.47a |
59.83+0.06b |
71.67+0.29ab |
|
T3 |
5.21+0.01c |
0.83+0.01b |
11.76+0.05c |
12.03+0.06c |
152.83+52.94a |
57.17+0.06c |
72.16+0.29a |
|
T4 |
4.30+0.01d |
0.88+0.01a |
11.67+0.02d |
10.10+0.10d |
244.53+52.94a |
54.83+0.06d |
72.17+0.29a |
Values are means ± standard deviation of three determinations
Values on the same column followed by same letter are not significantly different (P < 0.05)
T1=30% Rice Flour, 40% Cassava Flour, 30% Soybean flour
T2=30% Rice Flour, 50% Cassava Flour, 20% Soybean flour
T3=30% Rice Flour, 60% Cassava Flour, 10% Soybean flour
T4=30% Rice Flour, 70% Cassava Flour, 0% Soybean flour
The bulk densities of the samples ranges from 0.79 to 0.88g/ml. The bulk density is essentially a measure of the degree of coarseness of the sample, which implies that the particles in sample T4 are coarser followed by sample T3, T2, and T1. The change in bulk density was generally affected by the particle size and the density of the flour. Water absorption capacity is the ability of the flour to absorb and swell for improved food consistency. It is desirable in food system to improve yield and consistency and give body to the food (Osundahunsi et al., 2003). Low water binding capacity can be attributed to a close association of starch polymers within the sample’s starch granule, which was observed as result increase in cassava starch from T1 to T4. Oil absorption capacity refers to the total amount of oil held by a starch gel under a defined condition (Dolz et al., 2008). Swelling capacity and solubility of all the starches increased with increasing temperature and pH (up to their optimum point).The swelling power and solubility provide evidence of the magnitude of interaction between starch chains within the amorphous and crystalline domains. The highest swelling capacity and solubility were observed at sample T1 for native starch. The swelling power is the physical property which determines the ability of hydration of starch granules in flour (Osundahunsi, 2003). This shows the penetrating power of water into granule at high pH and temperature at which the water bath was set during analysis. Increase in solubility is a result of depolymerization and structural weakening of starch granules (Olayinka et al.,2013). The solubility of flour could be attributed in large extent to amylose leaching, which occur during gelatinization.
3.4 Pasting Properties of Composite Flour Samples
The pasting properties of the various starches are summarized in Table 5 showing the Peak 1, Trough 1, Breakdown, Final viscosity, setback, peak time and pasting temperature of the composite flour samples. The peak 1 i.e. peak viscosity ranges from 723.00cP to 1818.00 cP. The observed decrease in peak viscosity with proportionate increase in soya beans flour could be attributed to the partial cleavage of the glucosidic linkages due to dilution of the flour starch. The low peak time observed in sample T1 is an indication of its ability to cook fast, though the difference in peak time of the flour samples are not significant. Breakdown viscosity was significantly higher in sample T4 due to very weak cross-linking within the starch granules. The setback value ranges from 207cP to 525cP. The setback value, an index of retrogradation tendency in the starch paste, reduced with increasing soybean content. The pasting temperature of the flour was higher in all the four samples. The high pasting temperature of the flour indicates that it has higher resistance to swelling and rupture. The Trough viscosity ranges from 661cP to 1369cP. The value increase with decrease in soya beans content. Sample T4 had the highest tendency to withstand break down during cooling. The final viscosity ranges from 868cP to 1894cP. It is highest in sample T4 and sample T1 shows lowest final viscosity. The increase in the final viscosity might be due to the aggregation of amylose molecule which is higher in soya bean.
Table 5. Pasting properties of composite flour samples
|
Sample Code |
Peak 1 (cP) |
Trough 1 (cP) |
Breakdown (cP) |
Final Viscosity (cP) |
Setback (cP) |
Peak Time (Minutes) |
Pasting Temperature (0C) |
|
T1 |
723.00 |
661.00 |
62.00 |
868.00 |
207.00 |
4.73 |
77.65 |
|
T2 |
1012.00 |
889.00 |
123.00 |
1139.00 |
250.00 |
4.80 |
75.20 |
|
T3 |
1152.00 |
999.00 |
153.00 |
1372.00 |
373.00 |
4.73 |
76.75 |
|
T4 |
1818.00 |
1369.00 |
449.00 |
1894.00 |
525.00 |
4.93 |
75.85 |
T1=30% Rice Flour, 40% Cassava Flour, 30% Soybean flour
T2=30% Rice Flour, 50% Cassava Flour, 20% Soybean flour
T3=30% Rice Flour, 60% Cassava Flour, 10% Soybean flour
T4=30% Rice Flour, 70% Cassava Flour, 0% Soybean flour
Figure 1, 2, 3 and 4 shows the pasting profile of composite flour samples T1, T2, T3 and T4 respectively.
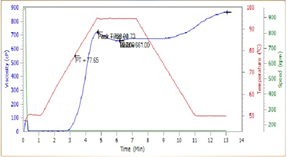
Fig. 1 Pasting profile of sample T1
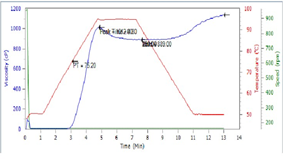
Fig. 2 Pasting profile of sample T2
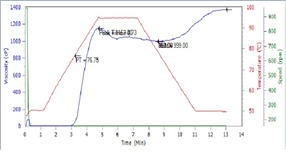
Fig. 3 Pasting profile of sample T3
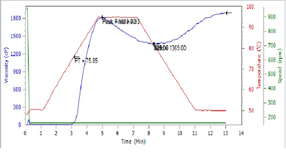
Fig. 4 Pasting profile of sample T4
3.5 Sensory Evaluation of Composite Flour
The sensory assessment of the composite flour samples is presented in Table 6. There is no significant difference in all the attributes that were accessed at (P < 0.05) and the samples were generally acceptable by the panelists although sample T2 is the most generally accepted.
Table 6. Sensory evaluation of composite flour samples
|
Sample Code |
Appearance |
Flavor |
Mouldability |
Texture |
Drawness |
Taste |
General Acceptability |
|
T1 |
6.89+1.69a |
6.22+1.92a |
6.67+2.60a |
6.78+1.39a |
6.33+1.50a |
6.11+1.97a |
6.78+1.56a |
|
T2 |
7.22+1.42a |
6.56+1.94a |
7.00+1.00a |
7.00+1.66a |
6.33+1.94a |
6.56+1.51a |
6.89+1.45a |
|
T3 |
6.78+1.20a |
5.56+1.13a |
6.44+1.01a |
6.78+1.20a |
6.67+1.23a |
5.89+1.83a |
6.33+1.41a |
|
T4 |
7.44+1.33a |
5.33+1.66a |
7.00+1.58a |
7.22+1.39a |
6.67+1.22a |
6.22+1.86a |
6.56+1.01a |
Values are means ± standard deviation of ten panelists
Values on the same column followed by same letter are not significantly different (P < 0.05)
T1=30% Rice Flour, 40% Cassava Flour, 30% Soybean flour
T2=30% Rice Flour, 50% Cassava Flour, 20% Soybean flour
T3=30% Rice Flour, 60% Cassava Flour, 10% Soybean flour
T4=30% Rice Flour, 70% Cassava Flour, 0% Soybean flour
3.6 Hydrogen Cyanide Content
The Hydrogen Cyanide Content of the composite flour samples are presented in Table 7. The cyanide content of the samples ranged from 2.93 to 3.71mg/kg. The result shows that sample T3 has the highest cyanide level of 3.71mg/kg while sample T2 has the least value of 2.93mg/kg. The cyanide content is due to the presence of cyanogenic glucosides, linamarin contained in cassava tuber which is the source of the cassava flour present in the composite flours. The cyanide level of 2.93 to 3.71mg/kg in the samples falls within the acceptable limits of 10 mg HCN equivalent/Kg dry weight recommended by FAO in 1988 for safe cassava products. The cyanide level is significantly lower than the lethal dose of cyanide intoxication of human which has been reported as 200 to 300 mg/kg (Akiyama et al., 2006) and the oral toxicity standard of 50 to 90 mg HCN equivalent/Kg body weight (WHO, 2004).
Table 7. Hydrogen Cyanide Content of composite flour samples
|
Sample Code |
Cyanide Content(mg/kg) |
|
T1 |
3.60+0.195a |
|
T2 |
2.93+0.195b |
|
T3 |
3.71+0.00a |
|
T4 |
3.42+0.34a |
Values are means ± standard deviation of three determinations
Values on the same column followed by same letter are not significantly different (P < 0.05)
T1=30% Rice Flour, 40% Cassava Flour, 30% Soybean flour
T2=30% Rice Flour, 50% Cassava Flour, 20% Soybean flour
T3=30% Rice Flour, 60% Cassava Flour, 10% Soybean flour
T4=30% Rice Flour, 70% Cassava Flour, 0% Soybean flour
All the four samples of composite flour of various blends had been examined. This research study indicates that meal are rich in carbohydrate and therefore serve as an excellent source of energy but the protein content however increased with increasing soybean flour blend. All nutritional components of the flour such as the proximate and mineral components increased favorably and sample T2 containing 30% Rice Flour, 50% Cassava Flour and 20% Soybean flour was the most generally accepted. The pasting and functional properties of the flour indicates that it is an excellent alternative to wheat flour and the hydrogen cyanide content is minimal and falls within the acceptable limit of standard lethal dose. The potential of incorporating soya beans flour in formulating composite flour for making an enriched meal will serve as the ready-made functional food needed for people who tend to consume what they can afford or have access to, financially rather than what they need.
Food and Agricultural Organization of the United Nation (FAO). (2006). A Cassava Industrial Revolution in Nigeria. FAO Corporate DocumentRepository. Retrieve on June, 5, 2016 from FAO Website: www.fao.org/3/y5548e/y5548e00.htm
Sanni, L. O., Onadipe, O. O., Ilona, P., Mussagy, M. D., Abass, A. and Dixon, A. G. O. (2009).Success and challenge of cassava enterprises in West Africa: A case study of Nigeria, Benin and Sierra Leone.International Institute of Tropical Agriculture (IITA).
Rosniyan, A., Hashiffah, M. A. and Shariffah Norin S. A. (2009). Improved quality and storage of rice flour (MR 220) by rice bran. Journal of Tropical Agriculture and Food Science, 37:53-59.
Danbaba, N., Nkama, I., Badau, M. H., Ukwungwu, M. N., Maii, A. T., Abo, M. E., Hauwawu, H., Fati, K. I. and Oko, A.O. (2104). Optimization of rice parboiling process for optimum head rice yield: a response surface methodology (RSM) approach. International Journal of Agriculture and Forestry, 4(3): 154-165
Ibrahim, M. A., Njoku, G. C. and Sallau, A. B. (2008). In vivo activity of stem bark aqueous extract of Khaya senegalensis in against Trapanosoma brucei. African Journal of Biotechnology, 7(5): 661-663
Tharise, N., Julianti, E. and Nurminahi, M. (2014). Evaluation of Physico-chemical and functional properties of composite flours from cassava, rice, potato, soybean and xanthan gum as alternative of wheat flour. International Food research Journal, 21(4):1641-1649.
Gebrelibanos, M., Tesfaye, D, Raghavendra, Y. and Sintayeyu, B. (2013). Nutritional and health implications of legumes. International Journal of Pharmaceutical Sciences and Research. 4(4), 1269
Soetan, K. O. and Oyewole, O. E. (2009). The need for adequate processing to reduce anti-nutritinal factor in plants used as human food and animal feed: A review. African Journal of Food Science. 3(9): 223-232.
Bankole, Y. O., Tanimola, A. O., Odunukan, R. O. and Samuel, D. O. (2013): Functional and Nutritional characteristics of cassava flour (Lafun) fortified with Soybean. Journal of Educational and Social Research, 3(8).
View ArticleFamurewa J. A. V. and Emuekele P. O. (2014). Cyanide reduction pattern of cassava (Mannihot esculenta) as affected by variety and air velocity using fluidized bed dryer. African Journal of Food Science Technology, 5(3):75-80
Akubor, P.I. (1997). Proximate composition and functional properties of African breadfruit kernel and sweat potato flour blends. Plant Foods for Human Nutrition, 52 (1): 53-60.
Akubor, P. I. and Ukwuru, M. U. (2005). Functional properties and biscuit making potential of soybean and cassava flour blends. Plant Foods for Human Nutrition, 58:1-12. PMid:12859008
View Article PubMed/NCBIOladunmoye, O. O., Akinoso, R. and Olapade,A. A. (2010). Evaluation of some physical chemical properties of wheat, cassava, maize and cowpea flours for bread making. Journal of Food Quality, 33:693-708.
View ArticleKadam, M. L., Salve, R. V., Mehrajfatema, Z. M. and More, S. G. (2012). Development andevaluation of composite flour for Missi roti/chapatti. Food Processing and Technology, 3:134.
Dautant, F. J., Simancas, K., Sandoval, A. J. and Muller, A. J. (2007). Effect of temperature, moisture, and lipid content on rheological properties of rice flour. Journal of Food Engineering, 78:1159-1166.
View ArticleAOAC (2000). Official Method of Analysis. Association of Official Analytical Chemists,Washington D.C, USA.
AOAC (1990). Official Method of Analysis 11th ed. Association of Official Analytical Chemists,Washington D.C, USA.
Adebowale, A. A., Adegoke, M. T., Sanni, S. A., Adegunwa, M. O. and Fetuga, G. O. (2012). Functional Properties and Biscuit Making Potentials of Sorghum-wheat Flour Composite. American Journal of Food Technology, 7: 372-379
View ArticleAdebowale, Y. A., Adeyemi, I. A. and Oshodi, A. A. (2005). Functional and physicochemical properties of flours of six Mucuna species.African Journal of Biotechnology, 4(12):1461-1468.
Ikegwu, O.J., Nwobasi, V.N., Odoh, M.O. and Oledinma, N.U. (2009) Evaluation of the pasting and some functional properties of starch isolated from some improved cassava varieties in Nigeria. African Journal of Biotechnology, 8:2310-2315.
Dolz, M., Hernandez, M. J. and Delegodo, J. (2008). Creep and recovery experimental investigation of low oil content food emulsions. Food Hydrocolloids, 22(3), 421-427
View ArticleOsundahunsi, O. F., Fagbemi, T. N., Kesselman, E. and Shimoni, E. (2003) Comparison of the physicochemical properties and pasting characteristics of flour and starch from red and white sweet potato cultivars. Journal of Agricultural Food Chemistry, 51:2232-2236. PMid:12670162
View Article PubMed/NCBIOlayinka, O. O., Adebowale, K. O. and Olu-Owolabi, I. B. (2013). Physicochemical properties, morphological and X-ray pattern of chemically modified white sorghum starch. Journal of food science and technology, 50(1); 70-77 PMid:24425889
View Article PubMed/NCBIOnyeneke, E. N. (2014). End-use quality of upland NERICA Rice (Oryza sativa L) as affected by the addition of sweet cassava (Low cyanide, Manihotesculenta) Flour. International Journal of Agriculture and Forestry, 4(3): 237-245.
Iwe, M. O., Onyeukwu, U. and Agiriga, A. N. (2016): Proximate, functional and pastingproperties of FARO 44 rice, African yam bean and brown cowpea seeds composite flour. Cogent Food and Agriculture, 2:1142409
View ArticleKulkarni, K. D., Kulkarni, D. N. and Ingle, U. M. (1991). Sorghum malt-based weaningformulations: preparation, functional properties and nutritive value. Food Nutrition Bullet, 13(4):322-327.
View ArticleLeach, H. W., McCovwen, D. L. and Schoch, T. J. (1959). Swelling and solubility patterns ofvarious Starches, structure of gramiles. Cereal Chemistry, 36:534-544.