Omolo, J.O
Email: oomolootienoo@gmail.com
© 2019 Sift Desk Journals. All Rights Reserved
VOLUME: 3 ISSUE: 1
Page No: 209-221
Omolo, J.O
Email: oomolootienoo@gmail.com
Omolo, J.O*1, Otieno, C. A2, Musita A3
1School of Post graduate studies of Busoga University, P.O. Box 154, Iganga - Uganda.
2Jaramogi Oginga Odinga University of Science and Technology (JOUST), P.O. Box 210-40601, Bondo-Kenya
3Faculty of Agriculture, Science and Technology, Busoga University, P.O. Box 154, Iganga-Uganda.
Mohammed F El Basuini(m_fouad_islam@yahoo.com)
Ebru Yilmaz(ebruyilmaz@adu.edu.tr)
Lucila Andriani Coral(lucilacoral@utfpr.edu.br)
James Omolo, Review of the Distribution and yield performance of Oreochromis niloticus (Linnaeus 1758) in different microhabitat types around Port Bunyala Bay of Lake Victoria, Kenya(2020)Journal of Aquaculture, Fisheries & Fish Science 3(1)
It has been reported that Wild L. Victoria Oreochromis niloticus have disappeared from about 40% of their historical breeding ranges. This study was conducted to determine the effect of different microhabitat types on the species distribution and yield performance around Port Bunyala Bay. Physical parameters (Temperature, Total depth and Conductivity) which contributes to the dispersal and yield performance of the species in freshwater systems were measured Insitu by multi-parameter probe YSI - 16820, Instrument readable up to 0.01°C while, multi-mesh gillnet of 14 – 90 mm was used to capture fish specimen. Chemical water parameters were sampled and analyzed in laboratory according to procedures outlined in [30], [18] and [2]. Fish yield and distribution data collected were analyzed by One Way ANOVA, p < 0.05 to determine if there existed any significant difference in Oreochromis niloticus distribution and yield among microhabitat types and Post hoc Tukey’s HSD, p < 0.05, to determine if there was significant difference between a pair of microhabitat types. Finally, Karl- Pearson product moment correlation coefficient, r, was used to determine the relationship between measured values of water quality, variables, yield and the fish distribution. Results of One Way ANOVA, p < 0.05, gave significant differences among microhabitats: for distribution, (F0.05, 3, 16 = 1201.09) and yield (F0.05, 3, 16 = 49.45) with MH 3 having highest number of fish caught (31%) and total yield (41.50%). Turkey’s HSD comparison of results revealed significant differences for distribution and the total fish yields. Estimated potential yield were far below gillnet catches and showed that the species potential yield has declined by between 65-99 % in yields. The study concluded Port Bunyala Bay is under abiotic stress and therefore, a cross-sectoral approach to ecosystem-based management of the important to rehabilitate and protect the fish breeding sites.
Key words: Port Bunyala Bay, microhabitat type, Oreochromis niloticus, distribution, yield
‘Fisheries catch data’ refers to information detailing how much fish is caught per country on a global basis. ‘Catch’ refers to the total amount of whole fish captured. It has a fundamental impact on fish populations and food webs because it represents removal of biomass and individuals from an ecosystem [14].
Catch data are also used to compile a “stock assessment”, which provides detailed information regarding the biological characteristics of a species or stock under fisheries’ management. This data can inform decisions regarding management regulations, fishery targets and future performance of selected stocks and species on a global basis. The concept of sustainability has been embedded in fisheries literature for about half a century at least in the concept of Maximum Sustainable Yield (MSY).
This concept has been used for decades as a measure of fishery potential and, unfortunately, sometimes as a development and management target. In the post UNCED era, the general concept requires explicitly that both the conditions of the ecosystem and the people living in it be either "good" or improving. There may be several interpretations of "goodness". [12], considers that "ecosystem well-being is a condition in which ecosystems maintain their quality and diversity and thus their potential to adapt to change and provide a wide range of choices and opportunities. Human well-being is a condition in which all members of the society can define and meet their needs and have a large range of choices and opportunities to fulfill their potential.
A sustainable society would be able to achieve both conditions as well as having the capacity to anticipate change and recover from eventual setbacks". Oreochromis niloticus or Linnaeus 1758 or O.niloticus, is a member of the Cichlidae family which is a group of warm water fish and the third most important aquaculture fish group in the world [3]. Their tropical and sub-tropical origins are clearly reflected in their thermal preferendum: The fish does not grow well at temperatures below 160C and cannot usually survive for more than a few days below 10.10C [1] but are remarkably tolerant to high temperatures up to 40.10C [12].
Yield performance and distribution of O.niloticus is a complex process affected by many behavioral, physiological, nutritional and environmental factors. Among all the tilapias, this species is the only one that grows to the largest length and size [19]. The maximum size attained by species in L. Victoria is 60 cm TL [20].
These diet differences between the two different habitats are ascribed to trophic changes occurring in the lake, some of which were due to the introduction of large piscivorous species the Nile perch or Lates niloticus (L. niloticus)which wiped out the dominant surface dwelling haplochromines, zooplanktivores and insectivorous of the 1970’s [6] were replaced by the pelagic cyprinid, Ratrineobola argenta (R. argenta) which fed on zooplankton and insect larvae [4].
In waters of the Lake Victoria basin in East Africa, the species was introduced in the 1950s and 1960s along with other species with an objective, to boost the native tilapiine cichlid fishery that declined due to overfishing [1].
However, of both the introduced cichlids and the native cichlids (Oreochromis esculentus Graham and Oreochromis variabilis Boulenger) in L. Victoria, it is only the Nile Tilapia that has become abundant, commercially important, and managed to flourish with the introduced predatory Nile perch [16].
The Lake fishery has changed considerably during the last two decades from a multi-species fishery to only three commercial species: L. niloticus, the R. argentea and the tilapiine[29].
There have been declining catch trends in the O. niloticus along the lake beaches [9]. In some areas, it has been noted that there is selective fishing for O. niloticus because of the market demand, a practice that brought overspecialization to the fishery common in restricted areas of the lake like Homa Bay; Mirunda Bay, Luanda Gembe, Asembo Bay, Paga beach, Usenge and Uwaria among others. These bays including Port Bunyala Bay are shallow and, in most cases, are the breeding and nursery grounds for fish[1]. Ecological changes caused by water pollution, alteration, destruction and degradation of these important fish habitats by destructive fishing methods, have undermined productive capacities of O. niloticus fishery in Port Bunyala Bay, leading to declining yields at high socio-economic costs [31].
[21], found that there has been destruction of the fish breeding, nursery and the bottom aquatic biomass with the juvenile fish removed from the fishery. The reduction in the fish catch rates in the landing beaches around Port Bunyala Bay is now a common scenario, which is a clear pointer that, the fishery is under threat of collapse and livelihoods of the communities that depend on it were at risk and costing opportunities in national revenue.
In such situation as in the case of the changing of this particular fish stocks, there was a need to identify and investigate the different fish microhabitats around the port and specifically determine its relative distribution and yield performance among the microhabitat types.
[23], found the abundance and distribution appear to be determined by water quality factors, primarily water temperature and food availability that varies over time. Since microhabitats around Port Bunyala Bay are part of the wider L. Victoria aquatic systems, water turbidity in the bay is mostly determined by phytoplankton and Total Dissolved Organic matter (DOM). Phytoplankton is at the base of O.niloticus food chain and usually plays an import role in dissolved oxygen balance of a microhabitat.
Phytoplankton comprised of photosynthetic organisms, include essential species of algae and diatoms. Some of these are golden algae, green algae and cyanobacteria (Blue-green algae). They usually carryout out photosynthesis near water surfaces providing food for grazing zooplankton and the fish life it supports.
Previous research by [24] and [25] indicated that Port Bunyala Bay water has become eutrophic with TP:TN value > 5 since, phytoplankton comprised of photosynthetic organisms, include essential species of algae and diatoms forms the food base for O.niloticus in Port Bunyala Bay.
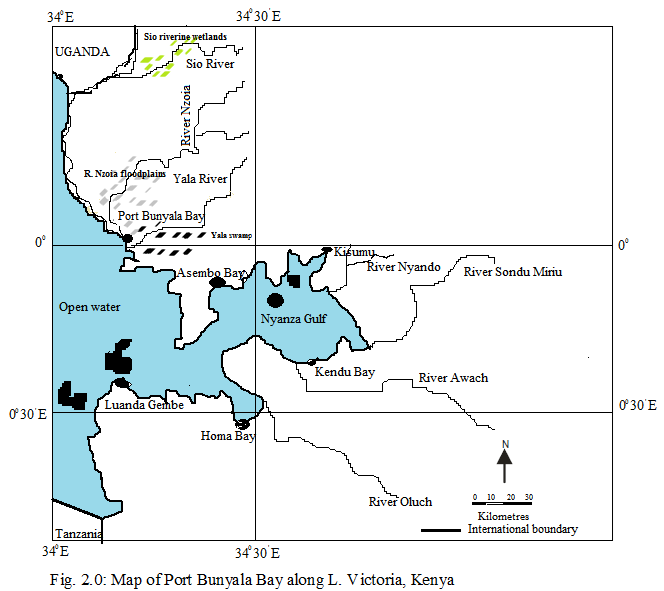
2.1 Study area
Port Bunyala Bay has an approximate total area of 50 Km2 (0.0833N, 33.9756 E), 10.4 Km North of the equator and approximately 1Km from Port Bunyala Town. It has an elevation of 1,130m above sea level and 0.45 - 6 m water level.
The area experiences a bimodal rainfall pattern between 1020 mm and 1270 mm with the long rains, falling between March and May and the short rains falling between August and October. Air temperature ranges from 260C to 300C with mean temperatures between 140C and 180C. The bay has an approximate 12 Km shoreline dotted by Cyperus papyrus (C. papyrus), Typha domingensis (T. domingensis), Phragmites mauritianus (P. mauritianus), Vossia cuspidate (V. cuspidate) and the floating Eichhornia crassipes (E. crassipes).
2.2 Research design
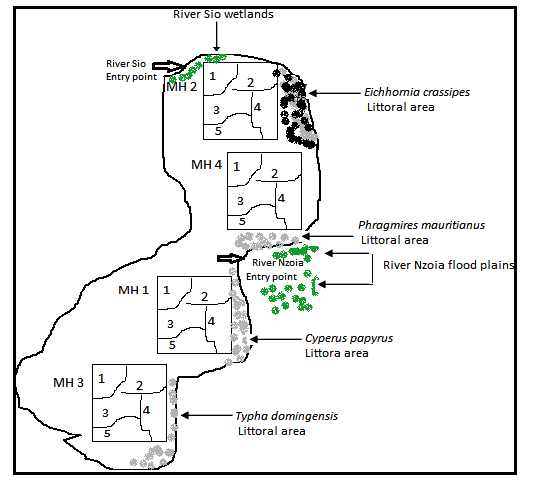
Fig. 2. Experimental field design
2.2.1 Completely Randomized Design
The Completely Random Design (CRD) was used for setting up field experiments due to the following reasons:
(a) More than two microhabitat types were studied (and were considered as treatment groups) which, required a complex statistical experimental design, particularly the CRD as guided by [11].
(b) It enables casual inferences about the relationship between microhabitat types, fish yield performances and distribution [11].
(c) It reduces variability within treatment conditions which makes it easier to detect differences in the treatment outcomes [25].
(d) According to [3], the CRD was the most appropriate for studying an environment with several non-experimental variables such as the macrophytes that contributes to the complexity and quality of microhabitats which were studied.
MH 1, MH 2, MH 3 and MH 4 experimentally designated as treatment groups.
Each treatment group was further sub-divided into five transects (1-5) or sampling units, giving of total 20 sampled units (N = 20).
2.3 Sampling methods
Oreochromis niloticus specimen were captured using, multi-filament gillnets, with mesh sizes ranging from 14 to 90 mm, knot-to-knot). Two gillnets of mesh size 14 - 30 mm (2 m height, 100 m length) were set in parallel and close to the shore (in MH 1, depth < 3 m) while, nets of 40-90 mm mesh-sizes (2.2 - 4 m height, 100 m length) were set in the areas considered deep parts of the bay (in MH2, MH3 and MH4 where, 3.3 m ≤ microhabitat depth ≥ 5 m). The gillnet survey was done once monthly from March 2014 to August 2014 from 0600 Hrs and retrieved 6 hours later in accordance to [23].
At each station a Conductivity-Temperature-Depth (CTD) probe with additional sensors YSI 16820, YSI Instrument readable up to 0.01°C and calibrated in Laboratory using the Winkler titration method against known, freshly made standards before going out in the field, was used to measure temperature, dissolved oxygen (DO), pH, conductivity and turbidity at different depths down the water column.
2.3.1 Data collection
Fish data were collected to reflect distribution and yield performance of Oreochromis niloticus at each sampling site.
O. niloticus Distribution Data
A total of N = 2, 374 Oreochromis niloticus specimen were caught from all the four microhabitat types where, N = n1, + n2, + n3, + n4 as the total number of fish specimen caught from microhabitat type 1, 2, 3and 4 respectively.
Table 1. Distribution of Oreochromis niloticus across microhabitat types
|
Sampling sites |
MH 1 |
MH 2 |
MH 3 |
MH 4 |
|
1 |
90 |
118 |
148 |
126 |
|
2 |
88 |
116 |
145 |
124 |
|
3 |
86 |
117 |
146 |
125 |
|
4 |
85 |
119 |
147 |
123 |
|
5 |
87 |
115 |
147 |
122 |
|
Total number of fish specimen (ni) |
436 |
585 |
733 |
620 |
Yield Performance Data
Wet weights measured per month and microhabitat type from all fish specimens. Average wet weight was calculated (Wav). Total wet weight was thus calculated as (Wav*ni), where ni = total number of fish samples caught from microhabitat type i, (where i = 1, 2, 3 and 4).
Fish yield performances were calculated from microhabitat type fish data which was divided into five mean weight group each corresponding to the different sampling sites wet weights (Table 3). The final fish yields were then calculated from the product of the mean fish yield weights (Wav Kg) and total number of fish (ni) caught by gillnet per sampling site (Total yield = Wav *ni Kg).
Table 2. Values of mean O. niloticus yield (Kg) per sampling site
|
Sampling site |
MHI |
MH2 |
MH 3 |
MH 4 |
|
1 |
3.13 |
3.64 |
5.74 |
4.36 |
|
2 |
3.14 |
3.63 |
5.75 |
4.35 |
|
3 |
3.12 |
3.63 |
5.73 |
4.35 |
|
4 |
3.12 |
3.62 |
5.75 |
4.35 |
|
5 |
3.13 |
3.62 |
5.75 |
4.35 |
The total fish yields obtained from the experimental gill-net survey were compared with the potential fish yield estimates arrived at by employing Ryder’s Morpho-Edaphic Index (MEI) modified by [15] and [27] using conductivity in the MEI models.
Physicochemical Parameters
Water quality parameters influence habitat quality suitable for fish growth, distribution and productivity (yield performance, breeding, nesting etc). Table 3 and Table 5 shows the values of both the Physical and Chemical water quality variables determined at the various microhabitat types around the bay.
Table 3. Summary of physicochemical variables determined at various microhabitat types
|
Microhabitat |
East |
North |
TN (mg/L) |
TP (mg/L) |
Mean Temp. (0C) |
Cond. (µScm-1) |
|
MH 1 |
33.945 |
0.0442 |
0.67 ± 0.02 |
0.13 ± 0.01 |
23.59 ± 0.16 |
118.63 ± 0.07 |
|
MH 2 |
33.9756 |
0.0936 |
0.63 ± 0.03 |
0.08 ± 0.01 |
24.66 ± 0.30 |
132.42 + 0.06 |
|
MH 3 |
33.9364 |
0.0373 |
0.63 ± 0.01 |
0.11 ± 0.02 |
25.64 ± 0.12 |
98.06 ± 0.90 |
|
MH 4 |
33.97583 |
0.1405 |
0.59 ± 0.02 |
0.11 ±0.03 |
26.48 ± 0.20 |
102.78 ± 4.29 |
Table 4. Summary of physicochemical variables determined at various microhabitat types
|
Microhabitat |
East |
North |
TD (m) |
DO (mg/L) |
pH |
Trans. (m) |
|
MH 1 |
33.945 |
0.0442 |
3.41 ± 0.25 |
6.13 ± 0.10 |
7.26 ± 0.20 |
0.41 ± 0.02 |
|
MH 2 |
33.9756 |
0.0936 |
4.49 ± 0.14 |
5.45 ± 0.18 |
6.91 ± 0.15 |
0.33 ± 0.03 |
|
MH 3 |
33.9364 |
0.0373 |
5.55 ± 0.17 |
7.16 ± 0.17 |
8.36 ± 0.22 |
0.71 ± 0.02 |
|
MH 4 |
33.97583 |
0.1405 |
6.53 ± 0.17 |
8.64 ± 0.22 |
7.16 ± 0.24 |
0.89 ± 0.03 |
2.4 Data analysis
One Way ANOVA, p < 0.05 was purposely employed to estimate the true differences [11] among the groups (or microhabitat types) means with any single variate decomposed as follows:
Yij = µ +αi + єij
Where Yij was the observed responses representing the measurements on the jth experimental unit, receiving the ith treatment; µ is the overall mean measurement across all treatments; αi is the effect of the ith treatment and єij is the random error component.
The F Statistic values were generated following [11] as follows:
SSTotal = ∑a∑nY2- 1/an (∑a∑nY) 2, Where 1/an (∑a∑nY) = CT or Correction factor
SS Groups = 1/n ∑a (∑nY) 2- 1/an (∑a∑nY) 2, Where a = number of groups and n = number of data entries per group and N = Total number of data entries for all groups.
SSError = SSTotal - SS Groups
SSGroups = SSGroups/DFGroups, Where DFGroups = a-1
MSError = SSError / DFError, Where DFError = N- a and DFTotal = N-1
F Statistic value = MSGroups / MSError
Physico-chemical variables, Fish distribution and yield performance data were subject to Tukey- HSD test in order to determine the level of differences between pairs of these factors among the treatment groups since, the One Way ANOVA test gives a significant result, this indicates that at least one microhabitat type differs from the other three microhabitats. Yet, the omnibus test does not inform on the pattern of differences between means, the ANOVA was then subjected by specific comparisons which compared two means or pairwise comparisons.
(2) Post- hoc analysis: The Turkey’s HSD and Studentized range statistic (q) were utilized for post hoc test to compute the HSD (Honestly significant difference) between two means using a statistical distribution defined by Student and called the q distribution. The rationale behind the HSD technique comes from the observation that, when the observation the null hypothesis is true, the value of q statistic evaluates the difference between groups.
(3) Karl-Pearson Correlation moment of correlation and regression, p < 0.05, was utilized to determine an association between distribution, yield and the various ecological variables.
3.1 Distribution among Microhabitats
Results indicated different distribution patterns of O. niloticus around the bay (Fig 3.1.1): MH 3 had the highest % (31%), followed by MH 4 (26%), MH 2 (25%) and the least distribution was recorded in MH 1, (18%).
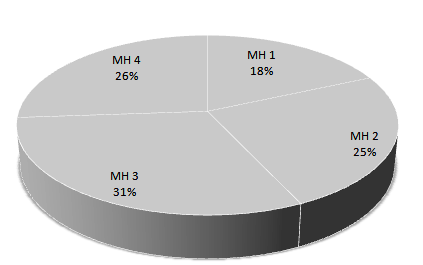
Fig. 3. % Microhabitat Distributions
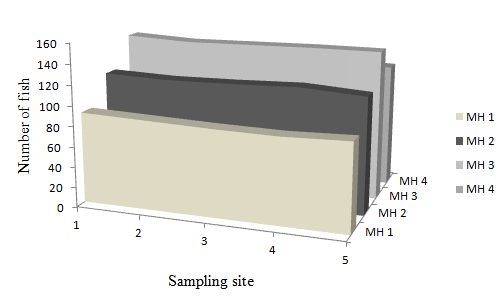
Fig. 4. Distribution (No./Microhabitat/0.025Ha)
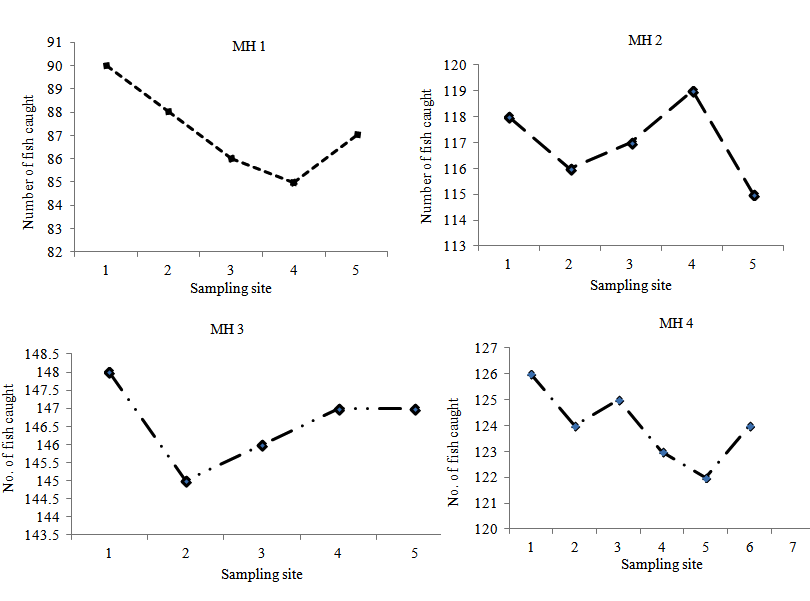
Fig. 5. Microhabitat Distribution Patterns
In MH 1, fish were distributed in all sampling sites in almost equal proportions of approximately 20% which was found in sampling sites 2, 3 and 5; 21% of fish was found in sampling site 1 and 19% in sampling site 4. Microhabitat types MH 2, MH 3 and MH 4 had 20% of fish found in each of their five sampling sites. Fish distribution among sampling sites for each microhabitat types are shown in Fig. 4.
Results for the determination if, there existed significance differences in fish distribution among microhabitat types by One Way ANOVA, p < 0.05 method, revealed significant differences.
Table 5: One Way ANOVA, p < 0.05, for determination of F- value.
|
Sources of Variation |
dF |
SS |
MS |
F |
F-Critical |
|
Group |
3 |
9008.2 |
3002.73 |
1201.09 |
3.24 |
|
Error |
16 |
40 |
2.50 |
|
|
|
Total |
19 |
9048.2 |
|
|
|
Table 6. Post hoc Tukey HSD pairwise distribution analysis (p < 0.05)
|
Treatments |
Treatment means |
Mean differences |
Comparison with the HSD value (1.83) |
Level of difference |
|
MH 1 and MH 2 |
87.2 and 117 |
29.8 |
Larger |
Significantly different |
|
MH 1 and MH 3 |
87.2 and 146.6 |
59.4 |
Exceptionally large |
Significantly different |
|
MH 1 and MH 4 |
87.2 and 124 |
36.8 |
Exceptionally large |
Significantly different |
|
MH 2 and MH 3 |
117 and 146.6 |
29.6 |
Larger |
Significantly different |
|
MH 3 and MH 4 |
146.6 and 124 |
22.6 |
Larger |
Significantly different |
In order to make conclusive analysis of significance differences of the fish distribution between microhabitat types, a Post hoc Tukey’s Honestly pair-wise significant difference analysis was performed, p < 0.05, which gave the results of the level of the differences presented in Table 6.
Association between fish distribution with water temperature, water depth was also determined and following were results of the Karl-Pearson product moment correlation coefficient, p < 0.05:
There was an indication of a strong, positive and significant correlation between the species distribution and water temperature of Port Bunyala Bay, (r = 0.77, R2 = 0. 59, and Student t-Test value of 5.07).
However, the relationships between the two variables at microhabitat levels were different at different microhabitats as follows:
In MH 1, the relationship between O. niloticus distribution and water temperature was not significant in MH 1, (r = 0.12, R2 = 0.01 and t-TEST, = 0.20) in agreement with [23]. In MH 2, there exists a positive and significant relationship between the Oreochromis niloticus and its distribution, (r = 0.58, R2 = 0.34 and the Student t-Test value of 1.24). However, in MH 3, the relationship was not significant (r = - 0.37, R2 = 0.14 and t-Test, = - 0.70) and in MH 4, (r = - 0.02, R2 = 0.00 and t-Test, = - 0.04).
Generally, water depth and the species distribution around Port Bunyala showed mi significant, positive correlation, p < 0.05, (r = 0.75, R2 = 0.56, t-TEST value of 4.83) but variation appeared between the two values at microhabitat levels as follows:
There was a strong, significant and positive relationship between the two variables in MH 1, (r = 0.92, R2 = 0.84, t-TEST value of 3.98). However, in MH 2, the association was weak, not significant and inverse (r = - 0.17, R2 = 0.03, t-TEST value of -0.31). In MH 3, (r = 0.92, R2 = 0.85, t-TEST value of 4.13) and in MH 4, (r = 0.75, R2 = 0.56, t-TEST value of 1.96).
Correlation between water conductivity and fish distribution around Port Bunyala Bay had no significant relationship, (r = 0.59, R2 = 0.35, t-TEST value of – 3.09). Other correlation results between the two in MH 1, MH 2, MH 3 were not significant while in MH 4, the association between the two values were found to be significant, (r = 0.58, R2 = 0.33, t-TEST value of 1.23).
3.2 Microhabitat YP trends
Results of the Oreochromis niloticus yields in various microhabitat types investigated showed performance trends was analogous to the distribution patters around Port Bunyala Bay (Fig.6).
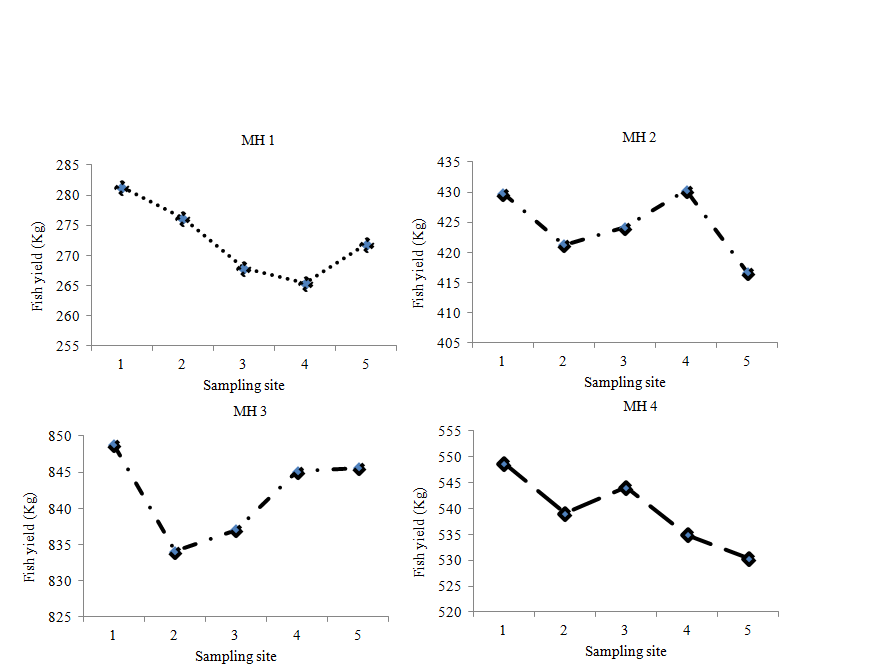
Fig. 6. Transects YP of Microhabitats
Out of 10,392.87 Kg (Fig. 7) total yield from 2,347 fish caught in the six months sampling period, MH 3 had the highest yield percentage, (40.51 %) followed by yield in MH 4 (25.95 %) and the least yield was the yield realized in MH 1(13.11 %) as per the graphical presentation shown in Fig. 8.
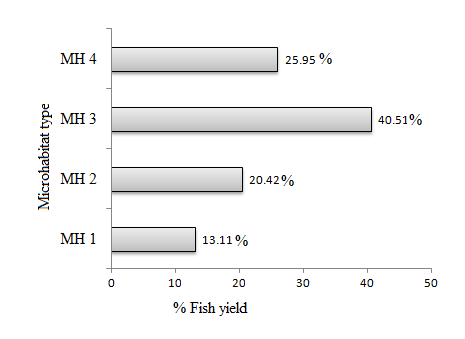
Fig. 7. Microhabitat % YP
Yield performances among different microhabitat types subjected to a One-Way ANOVA, p < 0.05 showed significant differences with F value far much greater than the critical value, (F Observed; 0.05, dF = 3,16 = 49.45). Fish yields values subjected to Post hoc Tukey’s HSD, p < 0.05, revealed significant differences between individual microhabitat types as shown in Table 9.
Table 9. Post hoc Tukey’s HSD at p < 0.05
|
Treatments |
Treatment means |
Mean Differences |
Comparison with HSD = 9.67 |
Level of difference |
|
MH 1 and MH 2 |
272.52 & 424.50 |
151.98 |
Large |
Significant |
|
MH 1 and MH 3 |
272.52 & 842.10 |
569.58 |
Very Large |
Significant |
|
MH 1 and MH 4 |
272.52 & 539.45 |
266.93 |
Larger |
Significant |
|
MH 2 and MH3 |
424.50 & 842.10 |
417.6 |
Very Large |
Significant |
|
MH 2 and MH 4 |
424.50 & 539.45 |
114.95 |
Large |
Significant |
|
MH3 and MH4 |
842.10 & 539.45 |
302.65 |
Larger |
Significant |
The fish production estimates compared with catches obtained through experimental gillnet sampling, as well as potential fish yield estimates using Ryder’s Morpho - Edaphic Index (MEI) as modified by [15] and [27] using conductivity and mean water depths respectively.
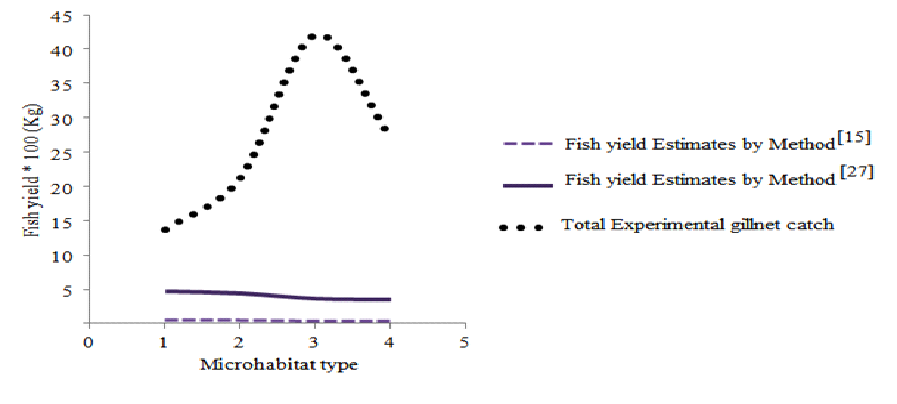
Fig. 8. YP Estimates by different methods
Results of the comparison of fish yield estimates obtained through experimental gillnet sampling, as well as potential fish yield estimates using Ryder’s Morpho - Edaphic Index (MEI) as modified by [15] and [27] using conductivity and mean water depths revealed substantial variation in each microhabitat potential fish yield when compared to the experimental gillnet catches.
Table 11. Comparison of Experimental and potential fish yield estimates
|
Microhabitat type |
Henderson et al.,(1974), Kg. |
Toews et al.,(1979), Kg. |
Gill-net (Kg) |
|
MH 1 |
51.60 |
474.01 |
1362.62 |
|
MH 2 |
49.20 |
445.97 |
2122.49 |
|
MH 3 |
41.80 |
369.06 |
4210.49 |
|
MH 4 |
40.10 |
353.59 |
2697.27 |
Potential fish yields determined by the 1st method was 28% compared to 27% for MH 2, 23% for MH 3 and 22% for MH 4. The 2nd method determined yields was even much higher, 29% for MH 1, 27% for MH 2, 22% for MH 3 and 22% for MH 4.
4.1 Effects of microhabitat types on fish yield in microhabitats around Port Bunyala Bay, Lake Victoria, Kenya.
Distribution patterns of Oreochromis niloticus at the various microhabitat types did not follow similar patterns though, the species was found to be distributed in all microhabitat types around Port Bunyala Bay possibly almost in the same proportions (Fig.3). This is because this species exhibits a wide range of behavioral patterns particularly, in breeding. This species is potentially able to establish naturalized populations in different ecological zones despite of their different environmental factors.
In spite of the fact that the microhabitat types are characterized by different geographical and ecological conditions, water temperature regimes found in all the microhabitat types are well within survival limits for O. niloticus which is between 110 C and 420 C, [13]. Apart from survival, results obtained by this study are in agreement with the fact that food availability and temperature appear to be limiting factors to growth for O.niloticus and that is why there was observed variation in the species yield among microhabitat types. Optimal growth is achieved at 280C- 360C but declines with decreasing temperature.
The mean water temperature differences were approximately 10C from MH 1 to MH 4, therefore it was expected that optimal growth accompanied by substantial yields trends increased from MH 1 upwards to MH 4 in a greement with yield trends determined by this study (1362 Kg for MH 1; 2122.42 Kg for MH 2, 4210 Kg for MH 3 and 2697.27 for MH 4- Fig. 8). The drop in potential yield by a mean of 92.70% could be the main cause. The massive decline in potential species yield in MH 4 must have been caused by overfishing using illicit gears which might have destroyed benthic organisms, micro and macro-invertebrates which form the largest part of Oreochromis niloticus food items.
Temperature is known to influence breeding in the female Oreochromis niloticus whereby when water temperature increases above 240C, the female will lay her eggs into the nest [13]. The results obtained by this study revealed that in general, there existed a strong and significant association between water temperature and this species distribution and yield around Port Bunyala Bay. The fact that water temperature did not significantly influences distribution and yield of O.niloticus in MH 1, must have contributed its low productivity and distribution in this particular microhabitat type which only contributed about 18% of the total O.niloticus yield determined around Port Bunyala Bay during the study period though its potential fish yields determined by the 1st and the 2nd method of the potential yield estimates placed MH 1 at a higher potential yield performance compared to the other three microhabitat types. The other factors that could have contribution to the decline in the species distribution and yield (by 96 % -1st Method and 65% by 2nd Method) could have been due to over fishing and degradation caused by anthropogenic activities. The potential yield estimates agree with [24] findings that the species prefers shallow, still waters on the edge of lakes and wide rivers with sufficient vegetation.
Water depth positively influenced fish yields in MH 1, MH 3 and MH 4 but negatively affected fish yields in MH 2. In MH 1 because it is a shallow depth along the edge of the lake, it is a preferred habitat area for the fish survival. Since the species is a mouth brooder, it moves to more suitable areas for spawning as MH 1 habitat quality must have been compromised by heavy fishing and degradation. In MH 2 water depth was found to be negatively related to the species yield due to the fact that fish distribution is determined by the floating E. crassipes which offers a safe zone for the fish against predation by its main predator the L. niloticus or Nile perch. The reduced water transparency, dissolved oxygen level in the water column offered an exclusive environment for its survival than any other species found in the larger Port Bunyala Bay habitat.
In MH 3, it was found that water depth positively and significantly influenced the fish yield. Two issues could have contributed the successful fish recruitment and growth. Considered as deeper microhabitat compared to MH 1 and MH 2, water reaching this microhabitat type have met water quality requirements for sustaining and supporting better yields for the species. However apart from the two conditions, Typha domingensis which is a dominant vegetation, could have influenced the elevation of the sediment’s redox potential and allow adequate dissolved oxygen levels in the water column to support the highest density of fish found in this microhabitat compared to comparatively smaller fish densities found in the reaming microhabitat types (O.niloticus density = 1.17 fish m-2 in MH 3 > 0.99 fish m-2 in MH 4 > 0.94 fish m-2 in MH 2 > 0.00 fish m-2 in MH 1).
The results show that the lake area around Port Bunyala Bay is overfished based on [7] statistical records, as well as low fish catch. Catches are lower both quantitatively and qualitatively. This general decline observed in the species yield around the bay, was, attributed to the declining fishery catch in concomitant with [7] findings that Tilapia catch rates in parachute boats using gillnet decreased from 3.94 ± 2.41 kg boat-1 day-1 in June 2005 to 3.67 ± 1.4 kg boat-1 day-1 in September 2011 and further to 2.4 ± 0.4 kg boat-1 day-1 in April 2014.
The findings are in agreement with the earlier findings by [21], [29], and [10] that Overexploitation attributed to increase in boats, gears and fishers in the lake has been on the rise and because There is also a substantial amount of illegal and undersized nets in the lake, which mostly target juveniles. The net effect was the cause of a serious decline in fish yield in all microhabitats found around Port Bunyala Bay since, illegal fishing activities variably affected recruitment, growth, and breeding of O. niloticus.
The fishermen around Port Bunyala Bay are always on the move once they receive information about improved catches at different habitats; they migrate to such a new ‘greener pasture’.
Reproduction is very vital to the sustenance, replenishment, and progeny maintenance of every living organism. Since fish stock is a renewable natural resource, which gets replenished from incessant cropping by fishermen through reproduction. The conversion and survivability of depends more importantly on its reproductive potential. The statistics on the species decline trends in microhabitats around the Bay suggests a fishery under stress with continued environmental degradation and hence though described as a resilient fishery by [20]; the extent of microhabitat alterations, modification affects overall fishery productivity.
Though water depth and temperature were found to be major factors which influenced the distribution and yield of fish across microhabitats around Port Bunyala Bay, vegetation type also played fundamental role. The role of role of E. crassipes as a macrophyte in MH 2 must have been the main driving factor behind O. niloticus distributions and yield performance since results on the relationship between water temperature, depth and water conductivities failed to have impact on both fish distribution and yield. The weed presence in the habitat has modified water quality but also expanded the weed’s surface area coverage used as protection by O. niloticus in avoidance strategy against predation by L. niloticus. Since the weed reduces dissolved oxygen level in water column, the reduced Dissolved oxygen level condition offered an exclusive microhabitat for O. niloticus to survive and maximize its feeding strategy. Water hyacinth increased density attracts insects which are also part of the feed for the species [20] and [5]. Due to the fact that MH 2 is near shoreline, relative effects of water depth changes are expected to play minimal role on the distribution and yield performance while, temperature do have a significant effect on the growth of is the reason why the effect must have been significant on yield in MH 2.
Port Bunyala Bay is a free access area to the lake and the fisheries around the bay are exposed to daily vigorous harvesting regime by fishermen yet the fish stock had been able to sustain itself even in the face of such onslaught through its resilience. This resilience is made possible through its reproduction potentials.
The fishermen recorded for all the landing sites around Port Bunyala Bay are in their hundreds which is more than expected; the bay with surface area of approximately 50 Km2, ought not to have more than 25 fishermen at the recommended rate of 2 fishermen per square kilometer [15].
As in many other environments, Port Bunyala Bay aquatic habitats occupied by fish are not stable but characterized by natural and anthropogenic change has caused serious natural environmental variations which present their own challenges to fishery managers. The low yield potential prediction has substantiated that microhabitats in Port Bunyala Bay have r been modified, altered, deranged both by natural cycles of events and by anthropogenic activities. Over fishing and illegal fishing methods also account for environmental degradations of the habitats around Port Bunyala Bay.
Macrophytes dominating Port Bunyala Bay, acts important water quality regulators. They effectively regulate water column temperatures, making availability of dissolved oxygen in water column, remove toxic elements in water and are also important areas for fish breeding with formation of fish protective areas in the wider Port Bunyala Bay habitat.
Enrichment of the bay by chemical nutrients thus rendering the bay a eutrophic habitat which has altered the size of the food web through changes in primary productivity and hence Port Bunyala Bay ecosystem of L. Victoria, Kenya is suffering from abiotic stress.
The distribution and yield performance of Oreochromis niloticus often depends not only on the past biogeographic and climatic events but also the contemporary and ecological factors, such as current connectivity and habitat heterogeneity. In fact, these factors interact with each other and shape the species distribution and yield performance in various microhabitat types in the lake.
RECOMMENDATIONS
Freshwater system such as that of Port Bunyala Bay of Lake Victoria, Kenya is strongly influenced by human activities in catchments and overfishing both of which affect the quality and quantity of aquatic habitats. Therefore, a cross-sectoral approach to ecosystem based management of the important fish breeding sites found around bays along the Kenyan section of the Lake Victoria is urgently needed to maximize the opportunities, and minimize the adverse effects on production, expected also to occur as a result of climate change.
Key challenges for cross-sectoral management are to protect undisturbed habitats prevent further damage, and to restore degraded habitats where practical. Improved fisheries management of freshwater resources is also essential to take advantage of the opportunities presented by climate change, and to oversee sustainable harvesting practices as demand grows to prevent overexploitation.
Innovative strategies will be needed to maintain ecosystem function so that fish and invertebrates can exercise their natural capacity to adapt to climate change and to manage fishing effort and gear. Estimating future production under climate change with confidence is difficult, because of the limited information on fish catches, the meager knowledge of the biology of most freshwater species in the region and the habitats that support them, and the uncertainty of climate projections at the scale of bays and catchments. Nevertheless, managers need to initiate responses to projected impacts based on knowledge available now and call for support for the additional information required to improve decision-making.
In general terms, increasing the value and production of the L. Victoria fisheries in a sustainable way in the face of climate change will depend on:
(1) improving habitat management to reduce exposure and sensitivity to the changing environment; (2) building the capacity of local communities to manage habitats and fisheries resources; (3) adopting more efficient fishing and processing methods (e.g. smoking and drying), and limiting fishing effort; (4) managing threats from unwanted invasive alien species and seeking ways to benefit from those that are already established; and (5) monitoring catches and measuring the success of management interventions.
I am heartily thankful to my spouse Judith Ywaya Som for financial and moral support, James Achiya of KMFRI for carrying out Laboratory analysis and Kevin Asanda and staff of Dark Allison secondary school for providing an office space during the writing of this repot.
Atonga, A.A., (2013): The history of species introduction into L. Victoria
APHA. (2005): Standard Methods for the Examination of Water and Wastewater. American Public Health Association, Washington, D.C.
Bailey N.T.J. Statistical methods in biology. 3rd edition, Cambridge Univ. press, Univ. of Liverpool, Britain, 1994, 116-120
Boyd, E.C. (2004): Farm-Level Issues in Aquaculture Certification: Tilapia. Report commissioned by WWF-US in 2004. Auburn University, Alabama 36831.
Bwanika, G.N., Murie, D.J. and Chapman, J.L. (2007): Comparative age and growth of Nile tilapia (Oreochromis niloticus L.) in lakes Nabugabo and Wamala, Uganda
View ArticleBwanika, G. N., Chapman, L. J., Kizito Y. and Balirwa, J.S. (2006): Cascading effects of introduced Nile perch (Lates niloticus) on the foraging ecology of Nile tilapia (Oreochromis niloticus).
View ArticleCAS Report (2014): Lake Victoria (Kenya) Fisheries Catch Assessment Survey
Cheruiyot C., Muhandiki, V., (2014): Review of Estimation of Pollution Load to Lake Victoria
Chitamwebwa, D., Kamanyi J., Kayungi, J., Nabbongo, H., Ogolla A. and Ojuok J. (2009): The Present Status of the Hook Fishery and its Impact on the Fish Stocks of Lake Victoria.
Cowx, I.G., Van der Knaap, M., Muhoozi, L.I. & Othina, A. (2003): Improving fishery catch statistics for Lake Victoria. J. Ecosystem. Health Mgmt 6, 299-310.
View ArticleDean, Susan and Illowsky, B. (2012): Collaborative statistics for MT 230- Spring 2012
De Leo, G. A., and S. Levin. (1997): The multifaceted aspects of ecosystem integrity. Conservation Ecology
View ArticleFAO (2005-2012): Cultured Aquatic Species Information Programme. Oreochromis niloticus. Cultured Aquatic Species Information Programme. Text by Rakocy, J. E. In: FAO Fisheries and Aquaculture Department [online]. Rome. Updated 18 February 2005.
Hellsten S., (2000): Environmental Factors and Aquatic Macrophytes in the Littoral zone of Regulated Lakes. Causes, consequences and possibilities to alleviate harmful effects. PhD Thesis, Finnish Environment Institute, Hydrology and Water Management Division, Water Engineering and Ecotechnology Research Group, Oulu, and Department of Biology University of Oulu, Finland.
Henderson, H.F., and R. L. Welcomme, (1974): The relationship of yield to Morpho-Edaphic Index and numbers of fishermen in African inland fisheries. CIFA Occas. Pap. 1. FAO.
I. Naigagaa, H. Kaiserb', W.J. Mullerc, L. Ojokd, D. Mbabazie, G. Magezie, E. Muhumuzae (2011): Fish as bioindicators in aquatic environmental pollution assessment: A case study in Lake Victoria wetlands, Uganda
Kleisner, K., Zeller, D., Froese, R. & Pauly, D. (2012). Using global catch data for inferences on the world's marine fisheries. Fish and Fisheries No. (2012).
View ArticleMackereth, F.J.H., Heron, J. & Talling, J.F. 1978. Water analysis: Some revised methods for limnologists. Freshwater Biological Association, London. 121p. (Scientific Publications, 36)
Njiru, M., J. Ojuok, A. Getabu, T. Jembe, M. Owili & C. Ngugi (2008): Increasing dominance of Nile tilapia, Oreochromis niloticus (L) in Lake Victoria, Kenya: Consequences for the Nile perch Lates niloticus (L) fishery.
View ArticleNjiru, M., Ojuok, J. E., Okeyo-Owuor, J. B., Ntiba, J. M & Cowx, I.G. (2004): Some biological aspects and Life History Strategy of Nile tilapia Oreochromis niloticus in Lake Victoria, Kenya. African Journal of Ecology 44, 30-37.
View ArticleNjiru, M., Othina, A., Getabu, A., Tweddle, D. & Cowx, I.G. (2002) 'The invasion of water hyacinth, Eichhornia crassipes Solms (Mart.), a blessing to Lake Victoria fisheries. In: Management and Ecology of Lake and Reservoirs Fisheries, (Ed. I. G. Cowx). Fishing News Books, Blackwell Science, Oxford, U.K.
Okwach, R., (2008): The legal and policy framework governing beach seine fishery in Lake Victoria: Ministry of Fisheries.
Omolo, J.O., (2016): Effect of Microhabitat types on Oreochromis niloticus (Linnaeus 1758) Biomass and Distribution: Case study for Port Bunyala Bay of Lake Victoria, Kenya. MPhil. Thesis. Busoga University, Uganda. 74 pp.
Omolo, J.O., (2009): Effects of Phytoplankton density on the changing water chemistry in Lake Victoria, Kenya. First Annual Nile Basin Research Conference, 2009.
Omolo, J.O., (2009): Bio manipulation of Phytoplankton for tilapia farming in Western Kenya. Technical Institute's western region conference and exhibition fair, Sigalagala Technical Training Institute, (2009).
Pagano A.M. and Titus J.E., (2004): Submersed macrophyte growth at low pH: contrasting responses of three species to dissolved inorganic carbon enrichment and sediment type. Aquatic Botany 79: 65-74.
View ArticlePicker, M.D. and Griffiths, C.L., (2011): Alien and Invasive Animals - A South African Perspective. Random house / Struik, Cape Town, South Africa. 240 pp.
Robert R. Sakal and F. James Rohlf (2009): Introduction to Biostatistics Second Edition
Rosenberg, A. A. & Garcia, S. M. (2010). Food security and marine capture fisheries: characteristics, trends, drivers and future perspectives. Philosophical transactions of the royal society b: biological sciences (2010). Global education project.
Toews, D. R., and J. S. Griffith, (1979): Empirical Estimates of potential fish yield for the Lake Bang- Weulu system, Zambia, Central Africa. Trans. Am. Fish. Sot. 108:241-252. 108<241:EEOPFY>2.0.CO;2
View ArticleVander Bruno dos Santos1, Edson Assunção Mareco2 and Maeli Dal Pai Silva (2013): Growth curves of Nile tilapia (Oreochromis niloticus) strains cultivated at different temperatures
Van der Knaap, M., Ntiba, M.J. & Cowx, I.G. (2002) Key elements of fisheries management on Lake Victoria. J. Ecosystem Health Manag. 5, 245-254.
View ArticleWetzel R.G. 2001. Limnology. Lake and River Ecosystems. 3rd edition. Academic Press, NY, USA.
Yongo, E.O., (2000): Poor Fisheries, Poor fisher folk: Sustaining the Fisheries of Lake Victoria for future Use. MSc. Thesis. University of Hull, United Kingdom. 118 pp.