Steinar Sanni,
NORCE, P.O. Box 8046, N-4068, Stavanger, Norway, Tel +47 51875500, Fax +47 51875540,
E-mail: stsa@norceresearch.no
© 2019 Sift Desk Journals. All Rights Reserved
VOLUME: 2 ISSUE: 1
Page No: 77-87
Steinar Sanni,
NORCE, P.O. Box 8046, N-4068, Stavanger, Norway, Tel +47 51875500, Fax +47 51875540,
E-mail: stsa@norceresearch.no
Steinar Sannia,b*, Steven Brooksc Emily Lynga, Daniela M. Pampanina,b,
aIRIS - International Research Institute of Stavanger, P.O. Box 8046, N-4068, Stavanger, Norway. IRIS became part of and changed name to NORCE - Norwegian Research Center from October 1st 2018.
bUniversity of Stavanger, Faculty of Science and Technology, Department of Mathematics and Natural Science, N-4036 Stavanger, Norway
cNorwegian Institute for Water Research, Gaustadalléen 21, NO-0349 Oslo, Norway
Gerhard Scherer(Gerhard.Scherer@abf-lab.com)
F Y Yamamoto(fla_yama@hotmail.com)
Jeffrey K Wickliffe(jwicklif@tulane.edu)
Steinar Sanni, Experience with the use of Biomarkers as Risk Indicators in Environmental Risk Assessment of oil based discharges offshore(2018)Journal of Chemical Engineering And Bioanalytical Chemistry 2(1)
An approach using probabilistic risk assessment for off shore oil based discharges utilising biomarkers has recently been developed (called “Biomarker Bridges). The purpose is to enable the use of biological responses (biomarkers) as Risk Indicators in procedures for Environmental Risk Assessment. The aim of the present paper is to discuss experiences gained from applying the Biomarker Bridges approach to existing data from the monitoring of an offshore oil field.
The data are from the biomonitoring case study of an oil field on the Norwegian Continental Shelf. The field had no discharge of produced water at the time of the survey and sediment contaminated with drill cuttings was expected to be the main source of contamination. Applying the Biomarker Bridges approach revealed that different response patterns could indeed be detected using this method when compared to responses that would commonly be associated with produced water. Examination of the different biomarker responses in this pattern revealed effects of a different chemical discharge than produced water.
Keywords Assessment criteria, Biomarkers, Biomonitoring, Environmental impact,Produced water, Risk based management.
For risk based management of produced water (PW) discharges being carried out on the Norwegian Continental Shelf (NCS), the operators use simulation modelling tools to predict the environmental impact and risk (‘DREAM-EIF’; Dose related Risk and Effect Assessment Model-Environmental Impact Factor) [1] and biomarker based monitoring surveys to assess effect responses in oil field areas [2-4]. Laboratory experiments have been performed to develop tools to integrate predictions and monitoring data obtained in field surveys [5-7]. A shortcoming in the management system prior to this was that there were no clear links between the variables that can be measured during monitoring and those used for risk characterisation [8].
Tools to integrate predictions of risk and measured effect (i.e. biomarker data) are based on Species Sensitivity Distributions (SSDs) [9,10]. The specific SSDs used in the present context were SSDBiomarkers established for different types of biomarker responses relevant to monitoring of oil based discharges [7]. The data to establish the SSDs were derived from statistically significant biomarker responses in organisms exposed to oil [6,7]. The application of these SSDs to link biomarkers to higher order effects and risk is called Biomarker Bridges and represents a method to link monitoring and predictions, or diagnosis to prognosis. Hence it allows biomarkers to be used as risk indicators in environmental risk assessment and to serve as assessment criteria for the measured biomarker responses [7,8].
The Biomarker Bridges concept is particularly relevant and has been developed for the monitoring of PW discharges in the NCS [11,12]. In cases where effects deviate from the biomarker response pattern expected from PW or crude oil exposures it may therefore be caused by a different type of discharge, which is the particular interest in this study.
The data used for this paper were derived from a survey conducted in the Water Column Monitoring (WCM) program on the NCS [13]. This program uses an environmental toxicological approach, and the main activity of the survey was to assess the chemical exposure and health status of fish populations living in the vicinity of an oil and gas installation. Fish collected at a clean site, about 60 km away from the platform, were used as reference material.
Fish were collected by rod and line within 100 meters of the platform. Biomarkers were analysed in four species: redfish (Sebastes sp., A.), saithe (Pollachius virens, L.), tusk (Brosme brosme, A.) and ling (Molva molva, L.). In saithe, 12 individuals were analysed and in all other species 20 individuals were analysed. At the reference site, 4 individuals of ling, 18 of tusk, and 20 of both redfish and saithe were collected. Supplementary reference values for ling obtained in the 2013 sampling were added to the data set.
Biomarker analyses
The following biomarkers were included in the data set: polycyclic aromatic hydrocarbon (PAH) bile metabolites analysed by both gas chromatography-mass spectrometry (GC-MS) and fixed wavelength fluorescence (FF) [14,15], ethoxyresorufin O-deethylase (EROD) [16,17], lysosomal membrane stability (LMS) [18], DNA adducts [19] and histological evaluation of gills [20,21]. Acetyl choline esterase (AChE) [22] was also analysed in the study. However, since no SSD has yet been developed for this biomarker, the results are included herein for interpretation support.
PAH metabolites (FF method). FF analysis was conducted as described by [23]. In brief, bile samples were diluted 1:1600 in 50% methanol. Slit widths were set at 2.5 nm for both excitation and emission wavelengths. Samples were analysed at the wavelength pairs 290/335, 341/383 and 380/430 nm, optimised for the detection of 2-3 ring, 4-ring and 5-ring PAH metabolites, respectively. The fluorescence signal was transformed into pyrene fluorescence equivalents (PFE) through a standard curve made by pyrene. Pyrene was measured at the optimal wavelength pair, 332/374 nm (excitation/emission). The concentration of PAH metabolites was expressed as µg PFE/ mL bile.
PAH metabolites (GC-MS method). Fish bile was prepared for analysis as described by [14, 15]. Briefly, β-glucuronidase was diluted 1:10 in sodium acetate buffer (0.4 M, pH 5); internal standards and 25–30 µl bile were added, followed by incubation at 40°C for 2h. The OH-PAH were extracted with ethyl acetate (4 times 0.5 ml), and the combined extract was dried with anhydrous sodium sulfate and concentrated to 0.5 ml. Trimethylsilyl (TMS) ethers of OH-PAH were prepared by addition of 0.2 ml N,O-Bis(trimethylsilyl) trifluoroacetamide (BSTFA), followed by heating for 2h at 60°C, and the GC-MS performance standard terephthalic acid (TPA) was added before transferal to capped vials. TMS ethers of OH-PAH in fish bile samples were analyzed with a GC-MS system consisting of an HP5890 series II gas chromatograph, Shimadzu QP2010 GC-MS. Helium was used as the carrier gas and the applied column was CP-Sil 8 CB-MS (Varian). The temperatures for the injector, transfer line, and ion source were held at 250, 300, and 240°C, respectively, and the GC oven temperature program was as follows: 80–120°C at 15°C/min, 120–300°C at 6°C/min, and held at 300°C for 30 min. Mass spectra were obtained at 70 eV in selected ion mode (SIM).
EROD. Liver samples were homogenized in a potassium phosphate buffer (0.1 M, pH 7.8) containing KCl (0.15 M), dithiothreitol (DTT) (1 mM), and glycerol (5% v/v). Microsome samples were diluted to ~2 mg/mL in buffer in 6 technical replicates onto a 96 well microplate. Pre-prepared resorufin standards (duplicates) were then added to subsequent wells. Reaction mixture (200 μL, containing 0.1 M potassium phosphate buffer, pH 8, and 3 μM 7-ethoxyresorufin) was added to the sample wells, before NADPH solution (2.4 mM in final well volume of 275 μL) was added to initiate the reaction. Transformation of 7-ethoxyresorufin to resorufin was read in 8 steps on the plate reader. Excitation was at 530 nm and fluorescence emission was measured at 590 nm. The EROD activity values were normalized to the protein content in the microsomal fraction and expressed as pmol/min/mg microsomal protein. Total protein content was determined according to [24].
LMS. The determination of LMS is based on the time of acid labilisation treatment required to produce the maximum staining intensity after demonstration of naphthol AS-BI phosphate activity in digestive cell lysosomes [18]. The longer the acid buffer exposure period needed to destabilise the lysosomal membrane represents high membrane integrity of lysosomes and vice versa. Serial cryotome sections (10 μm) were cut and subjected to acid labilisation in intervals of 0, 3, 6, 10, 15, 20, 30, 35, 40 and 50 min in 0.1 M citrate buffer (pH 4.5 containing 2.5% NaCl), in order to find out the range of pre-treatment time needed to completely labilise the lysosomal membrane. Following this treatment, sections were transferred to the substrate incubation medium for the demonstration of Hex activity. The incubation medium consisted of 20 mg naphthol AS-BI phosphate dissolved in 2.5 mL of 2-methoxyethanol, and made up to 50 mL with 0.1 M citrate buffer (pH 4.5) containing 2.5% NaCl and 3.5 g of low viscosity polypeptide to act as a section stabiliser. Sections were incubated for 20 min at 37ºC, rinsed in a saline solution (3.0% NaCl) at 37ºC for 2 min and then transferred to 0.1 M phosphate buffer (pH 7.4) containing 1 mg/mL of diazonium dye Fast Violet B salt, at room temperature for 10 min. Slides were then fixed for 10 min in Baker's formol calcium containing 2.5% NaCl and 10% CaCl at 4ºC and mounted in aqueous mounting medium Kaiser’s glycerine gelatine. Slides were evaluated under a microscope. Lysosomes stain reddish-purple due to the reactivity of the substrate with Nacetyl-b-hexosaminidase. The average labilisation period (LP) corresponds to the average incubation time(s) in the acid buffer that produces maximal staining reactivity. Each set of tissue sections were analysed and compared with the staining intensity of the section showing maximal staining (i.e. from which the LP was derived).
DNA adducts. Fish liver samples (70 to 90 mg per sample) were taken for the DNA extraction. For each sample, a purified DNA solution was obtained by a method of phenol-chloroform/liquid-liquid extraction, after crushing the liver pieces, isolation of cell nuclei (in sucrose 0.32 M) and sample treatment with RNases A, T1 and proteinase K. The DNA concentrations were calculated from the absorbance (optical density) at the wavelength of 260 nm (A260). The absorbance ratios A260/A280 and A260/A230 coupled with the absorbance profile of the samples between 230 nm and 300 nm were used to check the quality of the DNA solutions, particularly with respect to RNA and/or protein contamination. The 32P-postlabelling method used for this analysis is considered suitable for the detection of so-called "bulky" DNA adducts, which are additional compounds in DNA associated to complex molecules such as PAHs. Method details are reported in [25,26]. Each analysis was performed from 5 μg of DNA. The limit of detection was fixed to half the smallest DNA adduct level (relative adduct level=RAL) calculated for an observed spot, i.e. 0.5 x 0.02 = 0.01 adducts per 108 nucleotides (RAL x 10-8). For analysis without detectable adducts ("null" results), the concentration of adducts was defined as <0.01 x 10⁻⁸ nucleotides. In each set of analyses, DNA from both positive and negative controls was systematically included.
Histopathology of gills. One piece of gill arch from each side of the fish was dissected in the field and immediately fixed in Baker’s solution (4% formaldehyde, 1% CaCl2). Tissues were dehydrated in ethanol, rinsed and cleaned in a tissue processor before embedding in paraffin wax. Histological sections (3 µm), obtained using a microtome, were mounted on slides and stained in haematoxylin, eosin and saffron (HES) using an automated staining machine. Finally, sections were evaluated using a microscope (Zeiss Axioplan 2) and all micrographs were captured with a digital colour camera (AxioCam). Gills were examined for histopathological alterations related to physiological conditions, inflammatory pathologies and pathogen/parasites infections. Each lesion was scored according to the severity and the frequency of the lesion: 0 = absence of lesion, 1 = ≤ 10 % of the histological section showed the lesion, 2 = between 10% and 50% of the histological section showed the lesion, 3 = between 50% and 70% of the histological section showed the lesion and 4 = between 70% and 100% of the histological section showed the lesion [20,21]. Slides were analysed blind by two analysts to ensure quality.
AchE. The method from [27] to determine the AChE activity in biota tissue was used to assess AChE in extracts from fish fillet samples. The microsomal fraction was obtained as for the EROD analysis. The enzyme activity was followed by the production of the yellow coloured 5-thio-2-nitrobenzoic acid (TNB) anion. The conversion of DTNB to TNB can be used as a measure of the hydrolysis of ATC into thiocholine. ATC is produced from hydrolysation of the neurotransmitter acetylcholine by AChE. AChE inhibitors will induce a decrease in the production of ATC and therefore a decrease in the production of TNB will be observed. Experiments were performed in 96-well microplates and the protocol was automated on a robotic workstation (a Biomek 3000 laboratory automation workstation) to allow high-throughput analysis. Every sample was run in triplicate, 340 μL of 0.02 M phosphate buffer (at pH 7) were mixed together with 20 μL of 0.01 M DTNB and 10 μL of supernatant. After 5 minutes of incubation, 10 μL of 0.1 M ATC were added to start the reaction. The enzyme activity was then followed by an absorbance plate reader at 405 nm at room temperature. AChE activity was reported as µmol ATC/min/mg proteins. Total protein content was determined according to [24].
Statistical analysis of biomarkers. With the exception of histological evaluation of gills, all raw data and levels of significance were obtained from the report [13], where statistical differences between the groups of biological data were assessed with analysis of variance (ANOVA). Homogeneity of variance for the different groups was checked using the Levene’s test and data were log transformed when necessary to obtain homogeneity. Where homogeneity could not be achieved non-parametric analysis was performed, either as a Kruskal-Wallis test or Mann-Whitney U test. Where homogeneity of variance was achieved a Dunnett’s post-hoc test was performed with the parametric ANOVA to compare significant differences from the reference group. Gill histology results were analysed in SPSS® v24 using the Mann Whitney U test. The level of significance was set at p<0.05.
Affected fraction of species. In our study the number of significant biomarker responses in the different fish species were added up to yield the affected fractions of species in different biomarker groups. The distribution of the above biomarkers into groups are shown in Table 1. These numbers were examined using the SSD curves for the different biomarkers established in relation to PW exposures [7]. Evaluations were made using so-called “forward” and “backwards” (“inverse”) assessments in relation to the SSD curves [8,28].
There were no PW discharges at the site during the survey [29], however seabed areas in the field are known to be contaminated with hydrocarbons and process chemicals originating from drilling discharges. The operator estimated the amount to be 3400 tons [30]. In relation to the Norwegian environmental classification of chemicals [31] about half were in the green category, while approximately 47% were in yellow, 3.9% in red and 0.16% in black categories About two thirds of the yellow category chemicals were oil based drilling fluids [30]. Chemicals in the green category are nonhazardous, those in the yellow category are usually defined as not being environmentally hazardous, while chemicals in the red and black categories are prioritized for substitution [31].
Biomarker raw data are reported in 2014 WCM final report [13]. The statistically significant biomarker responses in the four fish species used in this study are shown in Table 1, histopathology raw data are provided in supplementary file 1.
The fraction of the affected species in Table 1 are plotted for each biomarker group in Figure 1a. Since the number of species were limited to four, the possible outcomes of Actually Affected Fraction of species in terms of biomarker responses (AAF Biomarkers) were limited to 0%, 25%, 50%, 75% and 100%. In the detoxification system I group (Detox I) only one of the four species was affected (25%), while in the other groups two of the species were affected (50%). Details regarding the use of AFF in term of biomarker reponses can be found in [8].
Table 1: Biomarker responses in the different fish species and biomarker groups. Data reported as mean ± standard deviation. Statistically different responses between fish collected in the proximity of the platform (Platform) and the ones from the reference area (Reference) are indicated by * (= p<0.05). SSD = species sensitivity distribution, polycyclic aromatic hydrocarbon = PAH, LMS = Lysosomal membrane stability, AChE = Acetylcholine esterase, EROD = Ethoxyresorufin O-deethylase. For biomarker unit see material and method section.
|
Biomarker SSD group |
Representative biomarker |
|
Fish species |
|||||||
|
|
|
|
Tusk |
|
Ling |
|
Saithe |
|
Redfish |
|
|
|
|
|
Platform |
Reference |
Platform |
Reference |
Platform |
Reference |
Platform |
Reference |
|
PAH metabolites |
PAH metabolites: FF method
|
2-, 3-rings 4-rings 5-, 6- rings |
396 ± 227 * 139 ± 73 59 ± 46 |
232 ± 142 116 ± 39 89 ± 65 |
454 ± 394 99 ± 53 44 ± 48 |
401 ± 188 117 ± 58 28 ± 18 |
129 ± 108 * 110 ± 87 42 ± 45 |
613 ± 577 111 ± 47 63 ± 48 |
68 ± 58 99 ± 50 38 ± 34 |
98 ± 70 86 ± 53 28 ± 24 |
|
PAH metabolites: GC-MS method |
1-OH-Naphthalene 2-OH-Naphthalene C1-OH-Naphthalene C2-OH-Naphthalene C3-OH-Naphthalene 1-OH-Phenanthrene C1-OH-Phenanthrene C2-OH-Phenanthrene 1-OH-Pyrene |
3 ± 2 5 ± 3 270 ± 104 87 ± 38 258 ± 111 26 ± 51 267 ± 148 286 ±103 12 ± 12 |
4 ± 2 20 ± 46 280 ± 73 68 ± 25 271 ± 75 9 ± 4 239 ± 81 261 ± 97 5 ± 2 |
2 ± 1 3 ± 2 243 ± 27 68 ± 20 264 ± 41 5 ± 2 208 ± 43 233 ± 75 3 ± 2 |
4 ± 3 4 ± 2 221 ± 13 92 ± 88 250 ± 38 9 ± 3 232 ± 52 248 ± 63 8 ± 6 |
3 ± 1 3 ± 2 222 ± 31 56 ± 8 184 ± 32 7 ± 2 165 ± 34 275 ± 70 7 ± 7 |
6 ± 3 7 ± 3 186 ±61 119 ± 85 259 ± 71 5 ± 3 61 ± 36 50 ± 42 3 ± 1 |
5 ± 2 5 ± 2 242 ± 27 65 ± 12 257 ± 38 12 ± 4 226 ± 67 265 ± 94 6 ± 3 |
5 ± 3 5 ± 2 312 ± 98 114 ± 62 253 ± 51 17 ± 8 225 ± 64 304 ± 108 9 ± 8 |
|
|
Detoxification system I |
EROD |
|
11.7 ± 7.0 |
12.1 ± 5.0 |
4.5 ± 5.0 |
3.8 ± 6.7 |
62.1 ± 17.1 |
119.2 ± 54.8 * |
36.9 ± 22.7 |
23.8 ± 9.7 |
|
Histopathology |
Gill histopathology |
|
* |
|
* |
|
|
|
|
|
|
Genotoxicity |
DNA adducts |
|
0.39 ± 0.56 |
0.14 ± 0.16 |
0.34 ± 0.38 |
0.01 ± 0.00 |
0.55 ± 0.47 * |
0.10 ± 0.17 |
0.73 ± 0.89 * |
0.14 ± 0.22 |
|
General toxicity |
LMS |
|
22 ± 6 * |
30 ± 7 |
23 ± 6 |
28 ± 10 |
21 ± 3 * |
33 ± 9 |
24 ± 7 |
29 ± 7 |
|
Neurotoxicity |
AChE |
|
148 ± 65 * |
273 ± 132 |
378 ± 174 |
317 ± 223 |
171 ± 38 * |
238 ± 83 |
152 ± 52 |
114 ± 49 |
Figure 1a shows a backwards assessment made from affected species back to the probable exposure concentrations that could have caused the effect. The total PAH (TPAH) concentrations that the different biomarker results correspond to are also shown. TPAHs includes 26 different PAH compounds analysed in water samples based on a standard protocol (EPA 610) with modifications as previously described [15]. The five different biomarker groups indicated a wide range of exposure concentrations (378-1764 ng TPAH/L). Expressing this as mean ± standard deviation (SD) gives a concentration of 1148 ± 980 ng TPAH/L).
A forward assessment can be made from this mean exposure concentration and the SD values via the SSD for Whole Organism Responses (SSDWOR) of the Potentially Affected Fraction of species in WOR (PAF WOR) (also based on crude oil profile exposures). This is shown in Figure 1b with a mean PAF WOR of 30%, and the lower and higher SD values corresponding to 2% and 48 % PAF WOR, respectively.
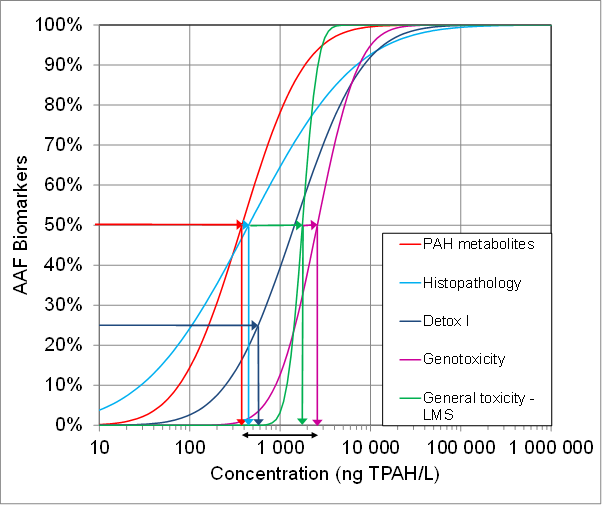
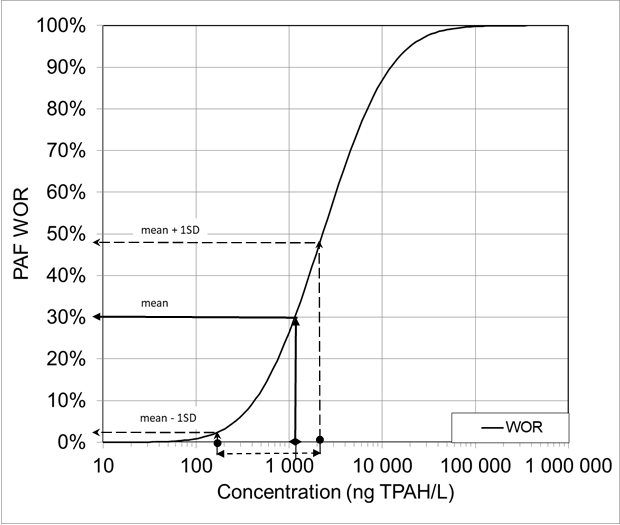
Figure. 1.( a) Backward assessment of Actually Affected Fractions of species (AAF) in different biomarker groups detected in the field monitoring survey projected to corresponding concentrations of Total Polycyclic Aromatic Hydrocarbons (TPAH) according to the biomarker based Species Sensitivity Distributions (SSDBiomarkers) in [7,8].
(b) Forward assessment from mean concentration of TPAH and +/- 1 SD (in 1a) to Potentially Affected Fraction of species (PAF) in Whole Organism Responses (WOR).
Ideally, when applied to a crude oil based exposure it would be expected that in a backward assessment using the biomarker SSD concept the different biomarker responses would point back to a common exposure concentration. This is because we expect that one common exposure concentration has caused the different biomarker responses and given this particular fingerprint based on our set of SSDBiomarker curves.
In our study, it was considered likely that the fish had been exposed to toxicants other than those typically found in PW. A different distribution of concentrations might therefore be expected in the backwards assessment. This is reflected in the range of concentrations in Figure 1a and 1b, by the SD values of the mean concentration corresponding to a wide range of 2-48 % PAF WOR in the forward assessment.
The next question is if the wide ranges in toxicant concentration and PAF WOR were due to high uncertainty, e.g. as a result of few species, or if it is due to other toxicants involved in the exposure of the organisms in the survey. This can be evaluated by a closer examination of the different biomarker group responses, and the fish species in which the responses were seen.
Figure 2 shows direct links from each different AAF Biomarker group to PAF WOR. When the range of responses are projected to the linear PAF WOR scale (different from the logarithmic concentration scale in Figure 1a), the wide response range is more clearly visualised, and the responses seem to be divided into two groups: PAH metabolites, Detox I and Histopathology are grouped together at a lower concentration and LMS and Genotoxicity are grouped together at a higher concentration.
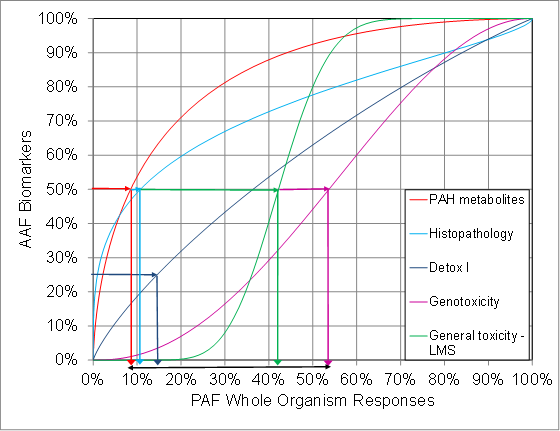
Figure. 2. Actually Affected Fraction of species (AAF) in different biomarker groups detected in the field monitoring survey projected to corresponding Potentially Affected Fraction of species (PAF) in Whole Organism Responses according to the Biomarker Bridges curves in [7,8].
The PAH metabolites and Detox I groups are typically biomarkers of exposure, and their responses are usually indications of ongoing or recent exposure of the organisms to PAHs [32,33]. Histopathology has been shown to give similar indications [7], especially in gill tissues. This may be due to the fact that gills are exposed directly to the oil constituents in the water and have a large surface area (i.e. the respiratory epithelium) and a high perfusion rate that facilitates the entry of pollutants into this tissue [34]. During exposure to PW discharges more species will normally show a response in other biomarkers than in LMS and genotoxicity [7]. LMS is a biomarker of general cellular stress which responds to various chemicals, including PAHs [35]. The same fish species were affected in LMS as in AChE (Table 1), which may indicate that neurotoxins have contributed to the elevated lysosomal membrane stress [22].
In relation to PW discharges, the responses of the genotoxicity biomarker (DNA adducts) are usually considered to be adducts of large PAHs [33]. Even if the biomarkers of exposure did not indicate an ongoing exposure of hydrocarbons, the DNA adduct responses could have originated from a recent, but ended hydrocarbon exposure. This is due to the fact that DNA adduct responses in general are expected to remain longer after the end of exposure than EROD and PAH metabolites [19,36]. On the other hand, DNA adducts might also have responded to other chemicals. Although the biomarker responses to different process chemicals are not known in great detail, simultaneous exposures to several different process chemicals in the yellow, red and black categories can generally be assumed to result in stress on lysosomal membranes, AChE and DNA. Additionally, the larger PAH compounds in oil based drilling fluids are likely to cause more DNA adduct formation than the smaller PAH compounds in PW [37]. Thus, a division in the two biomarker groups can be considered in accordance with the responses being caused by other sources than PW discharges.
In the four sampled fish species, two have a more demersal lifestyle (tusk and ling) than the others (redfish and saithe) [38-40]. Therefore, the distribution of species affected by the different biomarkers might in some cases provide indications to the source of the toxicants inducing responses [41]. If the two species affected in LMS and genotoxicity biomarkers were the two demersal species it could be an indication that the sediment is the toxicant source for those effects. However, this was not the case (Table 1), and overall the significantly elevated biomarker responses were rather evenly distributed between demersal and pelagic species.
The interpretation in this case points more towards a generally elevated level of affected species in the area. This is in accordance with the conclusions reported from the survey, that the observed biological responses can partly be explained by the wide range of oil and gas related chemicals that were not measured but were likely to be present [13]. The point of value in our study is that deviances from the expected pattern of biomarker responses can guide further inspections of the data and may add information regarding toxicant types and sources.
The above discussion shows that the wide ranges in estimated toxicant concentration and PAF WOR were likely due to other toxicants than those found in PW. Besides, the study highlights the necessity to establish the number of species needed to identify PW biomarker response profiles. For this a study with PW discharges will be necessary. Further the study did not provide data for a direct comparison to predicted impact and risk. This will be tested with data from the WCM survey conducted in spring/early summer 2017, where PW is expected to be the major source of contamination, and where a regional DREAM risk prediction was carried out before the survey. The Risk Indicator interpretation will commence as soon as all analytical data are available.
The experience gained by this case study of using biomarkers as Risk Indicators was that despite limited data on only four fish species, it was still possible to reveal biomarker responses corresponding to a higher risk level than expected, possibly caused by toxicants from sources other than PW. Genotoxic and other chemical stress effects were shown to have higher levels than normally found at the PW exposure level indicated by the exposure biomarkers in the study. This was in accordance with the predicted low impact and risk from PW.
In a follow-up study focused on a case where PW is expected to be the major source of contaminants, more experience will be gained with how well backward assessment using the biomarker based Risk Indicators will correspond to predicted environmental toxicant concentrations and risk.
We would like to thank our colleagues in the Norwegian Institute for Water Research and IRIS Environment for contributions to the Water Column Monitoring survey in 2014, and to Norwegian Oil and Gas, represented by Statoil ASA for funding the work
Financial disclosure
The field study was financed by Norwegian Oil and Gas, represented by Statoil ASA within the project: ´WCM 2014’. The present study based on ‘WCM 2014’ manuscript results were financed within the project ‘WCM 2017’.
Reed M and Rye H, 2011. The DREAM model and the environmental impact factor: decision support for environmental risk management. In: Lee K and Neff J, (eds.), Produced Water. Environmental Risks and Advances in Mitigation Technologies. Springer, New York, ISBN 978-1-4614-0045-5, pp. 189-203.
View ArticleSundt RC, Pampanin DM, Grung M, Baršienė J and Ruus A, 2011. PAH body burden and biomarker responses in mussels (Mytilus edulis) exposed to Produced Water from a North Sea oil field: laboratory and field assessments. Marine Pollution Bulletin 62: 1498-1505. PMid:21558042
View Article PubMed/NCBISundt RC, Ruus A, Jonsson H, Skarphéðinsdóttir H, Meier S, Grung M, Pampanin DM, 2012. Biomarker responses in Atlantic cod (Gadus morhua) exposed to Produced Water from a North Sea oil field: laboratory and field assessments. Marine Pollution Bulletin 64: 144-152. PMid:22070981
View Article PubMed/NCBIBrooks SJ, Harman C, Grung M, Farmen E, Ruus A, Vingen S, Godal BF, Baršienė J, Andreikėnaitė L, Skarphéðinsdóttir H, Liewenborg B, Sundt RC, 2011. Water Column Monitoring of the Biological Effects of Produced Water from the Ekofisk Offshore Oil Installation from 2006 to 2009. J Toxicol Environ Health, Part A 74 (7): 582-604.
View ArticleSmit MGD, Bechmann RK, Hendriks AJ, Skadsheim A, Larsen BK, Baussant T, Bamber S and Sanni S, 2009. Relating biomarkers to whole-organism effects using species sensitivity distributions: a pilot study for marine species exposed to oil. Environ. Toxicol. Chem. 28: 1104-1109. PMid:19045938
View Article PubMed/NCBISanni S, Björkblom C, Jonsson H, Godal BF, Liewenborg B, Lyng E and Pampanin DM, 2017a. I: Biomarker quantification in fish exposed to crude oil as input to Species Sensitivity Distributions. Mar Environ Res. 125: 10-24.
View ArticleSanni S, Lyng E, Pampanin DM and Smit MGD, 2017 b: II: Species Sensitivity Distributions based on Biomarkers and Whole Organism Responses for integrated impact and risk assessment criteria. Mar Environ Res. 127: 11-23.
View ArticleSanni S, Lyng E and Pampanin DM, 2017c. III: Use of biomarkers as risk indicators in environmental risk assessment of oil based discharges offshore. Marine Environ Res. 127: 1-10.
View ArticlePosthuma L, Suter II GW, and Traas TP (eds.) 2002. Species Sensitivity Distributions in Ecotoxicology. Lewis Publishers, Boca Raton, FL, USA, 587pp. PMCid:PMC126734
Del Signore, A, Hendriks, AJ, Lenders, HJR, Leuven, RSEW and Breure AM, 2016. Development and application of the SSD approach in scientific case studies for ecological risk assessment. Environ. Toxicol. Chem. 35 (9): 2149-2161. PMid:27144499
View Article PubMed/NCBIBakke T, Klungsøyr J and Sanni S, 2013. Environmental impacts of produced water and drilling waste discharges from the Norwegian offshore petroleum industry. Mar Environ Res. 92: 154-169. .
View ArticleIversen PE, Lind MJ, Ersvik M, Rønning I, Barman Skaare B, Green AMV, Bakke T, Lichtenthaler R, Klungsøyr J, and Hylland K, 2015. Environmental monitoring of petroleum activities on the Norwegian continental shelf. Norwegian Environment Agency. Guidelines. M-408. 63 pp.
View ArticleBrooks S, Pampanin D, Harman C and Grung M, 2014. Water Column Monitoring 2014: Determining the biological effects of an offshore platform on local fish populations. Report Norwegian Institute of Water Research (NIVA) no. 6735-2014. ISBN 978-82-577-6470-8. 70pp.
Jonsson G, Beyer J, Wells D and Ariese F, 2003. The application of HPLC-F and GC-MS to the analysis of selected hydroxy polycyclic hydrocarbons in two certified fish bile reference materials. Journal of Environmental Monitoring. 5: 513-520. PMid:12833997
View Article PubMed/NCBIJonsson G, Taban IC, Jørgensen KB and Sundt RC, 2004. Quantitative determination of de-conjugated chrysene metabolites in fish bile by HPLC-fluorescence and GC-MS. Chemosphere. 54: 1085-1097. PMid:14664837
View Article PubMed/NCBIBurke MD and Mayer RT, 1974. Ethoxyresorufin – direct fluorimetric assay of a microsomal O-dealkylation which is preferentially inducible by 3-methylcholanthrene. Drug Metabolism and Disposition 2: pp. 583-588. PMid:4155680
PubMed/NCBIEggens ML and Galgani F, 1992. Ethoxyresorufin-O-deethylase (EROD) activity in flatfish: Fast determination with a fluorescence plate-reader. Mar Environ Res. 33: 213-221. 90149-G
View ArticleBroeg K, Zander S, Diamant A, Korting W, Kruner G, Paperna I, and von Westernhagen H. 1999. The use of fish metabolic, pathological and parasitological indices in pollution monitoring - 1. North Sea. Helgoland Marine Research. 53(3-4): 171-194.
View ArticleLe Goff J, 2017. Carcinogenicity of petrogenic PAHs. In: Pampanin DM and Sydnes OM (Eds.), "Petrogenic Polycyclic Aromatic Hydrocarbons in the Aquatic Environment: Analysis, Synthesis, Toxicity and Environmental Impact". Bentham Science Publishers, pp. 65-110. DOI: 10.2174/97816810842751170101
View ArticleBenli ACK, Köksal G and Özkul, A, 2008. Sublethal ammonia exposure to Nile tilapia (Oreochromis niloticus L.): effects on gill, liver and kidney histology. Chemosphere 72: 1355-1358. PMid:18514258
View Article PubMed/NCBISensini C, Della Torr C, Corsi I and Focardi S, 2008. First observations of histopathological effects of 2,4,6-trinitrotoluene (TNT) in gills of European eel Anguilla anguilla (Linnaeus, 1758). Cell Biol. Toxicol. 24: 621-628. PMid:18297406
View Article PubMed/NCBILionetto MG, Caricato R, Calisi A, Giordano ME, and Schettino T, 2013. Review Article. Acetylcholinesterase as a Biomarker in Environmental and Occupational Medicine: New Insights and Future Perspectives. BioMed Research International. Article ID 321213, 8p. https://doi.org/10.1155/2013/321213
View ArticleAas E, Beyer J, Jonsson G, Reichert WL, Andersen OK, 2001. Evidence of uptake, biotransformation and DNA binding of polyaromatic hydrocarbons in Atlantic cod and corkwing wrasse caught in the vicinity of an aluminium works. Marine Environmental Research. 52:213-229. 00269-5
View ArticleLowry OH, Rosenbrough NJ, Farr, Randall RJ, 1951. Protein measurement with the Folin Phenol Reagent, Journal of Biological Chemistry 192, 265-275.
Reichert WL, and French B, 1994. 32P-postlabeling protocols for assaying levels of hydrophobic DNA adducts in fish. NOAA Technical Memorandum. NMFS-NWFSC-14. tions/scipubs/techmemos/tm14/tecmem14.html
View ArticleLe Goff J, Gallois J, Pelhuet L, Devier MH, Budzinski H, Pottier D, André V, and Cachot J, 2006. DNA adduct measurements in zebra mussels. Dreissena polymorpha. Pallas. Potential use for genotoxicant biomonitoring of fresh water ecosystems. Aquat. Toxicol. 79: 55–64. PMid:16780971
View Article PubMed/NCBIBocquené G, and Galgani F, 1998. Biological effects of contaminants: Cholineesterase inhibition by organophosphate and carbamate compounds. ICES Techniques in Marine Environmental Sciences, 22 pg. 19.
van Straalen NM, 2002. Theory of Ecological Risk Assessment Based on Species Sensitivity Distributions. In: Posthuma L, Suter II GW and Traas TP (eds.), Species Sensitivity Distributions in Ecotoxicology. Lewis Publishers, Boca Raton, FL, USA, pp. 37-48.
Statoil, 2015. Årsrapport 2014 - utslipp fra Njord AU-NJO-00005. 47 pp. (in Norwegian)
Norwegian Environment Agency, 2013. (in Norwegian. Accessed 22. December 2017).
View ArticleKelland, MA, 2014. Production chemicals for the oil and gas industry (second ed.). CRC Press. Taylor & Francis Group. Boca Raton, ISBN 978-1-4398-7379-3. 436 pp.
View Articlevan der Oost R, Beyer J and Vermeulen NP, 2003. Fish bioaccumulation and biomarkers in environmental risk assessment: a review. Environmental Toxicology and Pharmacology 13 (2): 57-149. 00126-6
View ArticlePampanin DM, 2017. Introduction to petrogenic polycyclic aromatic hydrocarbons (PAHs) in the aquatic environment. In: Pampanin DM and Sydnes OM (eds.), "Petrogenic Polycyclic Aromatic Hydrocarbons in the Aquatic Environment: Analysis, Synthesis, Toxicity and Environmental Impact". Bentham Science Publishers, pp 3-17. DOI: 10.2174/97816810842751170101
View ArticleSantos DMS, Melo MRS, Mendes DCS, Rocha IKBS, Silva JPL, Cantanhêde SM and Meletti PC, 2014. Histological Changes in Gills of Two Fish Species as Indicators of Water Quality in Jansen Lagoon (São Luís, Maranhão State, Brazil). Int J Environ Res Public Health 11(12): 12927–12937. doi: 10.3390/ijerph111212927
View ArticleMoore MN, 2012. Background document: lysosomal membrane stability as a global health status indicator in biomonitoring. In: Davies IM and Vethaak D (eds.): Integrated marine environmental monitoring of chemicals and their effects. ICES Cooperative Research Report 315: 68-70.
Lyons B and Davies IM, 2012. Background document: DNA adducts of polycyclic aromatic hydrocarbons. In: Davies IM and Vethaak D (eds.): Integrated marine environmental monitoring of chemicals and their effects. ICES Cooperative Research Report 315: 60-69.
Balk L, Hylland K, Hansson T, Berntssen MHG, Beyer J, Jonsson G, Melbye A, Grung M, Torstensen BE, Børseth JF, Skarphedinsdottir H and Klungsøyr J, 2011. Biomarkers in Natural Fish Populations Indicate Adverse Biological Effects of Offshore Oil Production. PLoS One 6 (5): e19735. doi: 10.1371/journal.pone.0019735
View ArticleHare, JA, Manderson JP, Nye JA, Alexander MA, Auster PJ, Borggard DL, Capotondi AM, Randall KB, Heupel E, Mateo I, O'Brien L, Richardson DE, Stock CA and Biege ST, 2012. Cusk (Brosme brosme) and climate change: assessing the threat to a candidate marine fish species under the US Endangered Species Act.- ICES Journal of Marine Science, 69: 1753-1768.
View ArticleWheeler A, 1969. The Fishes of the British Isles and NW Europe. Macmillan and Co. London, pp. 284-285.
Pikanowski RA, Morse WW, Berrien PL, Johnsen DL and McMillan DG, 1999. Essential Fish Habitat Source Document: Redfish, Sebastes spp., Life History and Habitat Characteristics. NOAA Technical Memorandum NMFS-NE-132.
Beyer J, et al., 2004. Frøy biomarker survey: A field study of pollutant responsive markers in fish and invertebrates collected at a decommissioned oil production site in the North Sea. Report AM-2004/009; IRIS-2004/342. 41pp.