Md. Azizul Haque, Ph. D., Assistant Professor, Department of Biochemistry and Molecular Biology, Faculty of Agriculture, Hajee Mohammad Danesh Science and Technology University, Dinajpur 5200, Republic of Bangladesh. Tel.: +8801761106098; Fax: +88-0531-61311.
Validation and extended application of cellulose microfibril swelling enzyme assay method to alkali induced swelling of cellulose
Corresponding Author
Affiliation
Md. Azizul Haquea*, Mahfuza Akhtara, Abubakar Halilua,b, Han Dae Yunc
aDepartment of Biochemistry and Molecular Biology, Hajee Mohammad Danesh Science and Technology University, Dinajpur-5200, Bangladesh.
bDepartment of Pharmaceutics and Pharmaceutical Microbiology, Usmanu Danfodiyo University, Sokoto State, Nigeria.
cResearch Institute of Agriculture and Life Science, Gyeongsang National University, Chinju 660-701, Republic of Korea
Article Reviewed By:
C%C3%A9line Moreau(Celine.Moreau@inra.fr)
Bin Li(libin@qibebt.ac.cn)
Citation
Md. Azizul Haque, Mahfuza Akhtar, Abubakar Halilu, Han Dae Yun , Validation and extended application of cellulose microfibril swelling enzyme assay method to alkali induced swelling of cellulose(2017)Journal of Chemical Engineering And Bioanalytical Chemistry 2(1)
Abstract
Abstract: The aim of this study was to develop a simple colorimetric method to determine the swelling degree of cotton cellulose based on the UV absorbance shift of Congo Red (CR). To induce swelling, the cotton was treated with NaOH (0, 2, 4, 6, 8, 9, 10, and 12%) solution at -20 °C for 60 min. The FTIR analyses revealed that the 2 to 8% NaOH treated cotton were swollen and less crystalline by decreasing the strengths of cellulose inter and intramolecular hydrogen bonds. The swollen cotton cellulose (10 mg) adsorbed more CR molecule when stained using 1 mL CR solution (100 µM). The amount (?M) of CR adsorption on cotton was enhanced with higher degree of swelling. The study proposed 1 µM of CR adsorption enhancement on 10 mg of swollen cotton cellulose is equal to 1 unit of swelling. The swelling behavior of cotton cellulose was, validated by varying treatment temperature and time, reflected properly by this method. Therefore, it is a promising sensitive colorimetric method for the easy and rapid determination of the swelling degree of cotton cellulose.
Key words: Cellulose swelling, colorimetric assay, cotton cellulose, FTIR analysis, H-bonds, Congo Red.
Introduction
Cellulose biopolymer is an attractive source of alternative energy such as bioethanol. Its crystalline nature provides insolubility into the water. To boost the saccharification, several attempts are being tested to increase the solubility of cellulose by structural modification. Chemicals including organic and inorganic solvents are tested over the years to increase the solubility or swelling of cellulose as additives during saccharification. Since the saccharification is an ultimate process of cellulose modification by enzymes; therefore, to have some proteins regarding swelling instead of chemicals would be more beneficiary for bioethanol production. Although, some proteins such as expansin (Kim et al., 2009), swollenin (Saloheimo et al., 2002) have been reported for the modification of hydrogen bonds of crystalline cellulose, the physio chemical properties are not well characterized due to lack of a sensitive analytical method. Moreover, researchers are interested to isolate some novel enzymes for cellulose swelling. However, although several methods for measuring of cellulose swelling are reported a sensitive colorimetric method is not reported yet. Thus a colorimetric method is needed for basic research of cellulose structural modification.
In plant cell walls, the basic structural unit of cellulose is slender aggregates of cellobiose chains called elementary fibrils or microfibrils (Kim et al., 2009). A wide range of diameters (2-20 nm) and lengths (0.1-100 μm) of microfibrils are observed. Such lengths correspond to a degree of polymerization ranging from the hundreds to the tens of thousands of glucose units along the axial direction of the microfibril. Free hydroxyl groups present in cellulose are involved in various possible intramolecular and intermolecular hydrogen bonds giving rise to different crystalline arrangements of cellulose (Agarwal, 2011]. The crystalline structures of these microfibrils create a complex network of hydrogen bonding and van der Waals interactions that resist deconstruction by solvent or mechanical forces (Jager et al., 2011), are recalcitrance for cellulase enzymes. The structures consist of cellulose chains with alternate glucose units facing in opposite directions. These chains are arranged in a parallel fashion and are linked through interchain OH· · ·H hydrogen bonds. Because of the close proximity of glucose residues in the structures, a complex network of nonbonded interactions permeates the crystals. Sheets of polymeric chains are stacked over one another, stabilized by weaker CH· · ·O interactions and van der Waals attractions (Mackenzie, 1956). Both allomorphs consist of polymerized cellobiose chains arranged in parallel to form flat sheets. These sheets are stacked on top of each other to form the full three-dimensional crystal structure (Richter, 1957).
Sodium hydroxide is a simple chemical that can swell cellulose in a certain concentration, and even can dissolve cellulose at high NaOH concentration. The dissolution mechanism is that soda hydrates can penetrate the amorphous area of cellulose, and destruct the neighboring crystalline regions by destroying inter and intra-hydrogen bonds between cellulose molecules (Saloheimo et al., 2002). In its reaction with cellulose, aqueous sodium hydroxide above a certain concentration is able to penetrate the cellulose crystalline lattice to yield a series of more or less well defined crystalline complexes holding a number of sodium ions and water molecules within their crystalline lattice (Porro F., 2007).
In the semi crystalline polymers, the accessible areas for dyeing are the amorphous areas and the surfaces of the crystalline phase (Ougiya et al., 1998). According to Venkataraman (1952) Congo red is bound mainly to primary alcohol groups of cellulose and does not react with aldehyde groups. It is an anionic azo dye that may interact with surface of cellulose fibers in different ways: by electrostatic forces through the sulfonic groups, by hydrogen bonding through the azo and amino groups, and by hydrophobic interactions through the conjugated ð-electron system (Yamaki et al., 2005). In Congo red the resonance along the chain of conjugated double bonds favors coplanarity of the aromatic structures. Moreover, formation of chelate hydrogen bonds between ortho-amino and azo groups assists the planarity of the molecule and facilitates hydrogen bond formation with suitable groups of cellulose (Shore, 1997). Thus, hydrogen bond plays an important role in the Congo red adsorption on modified cellulose fibers. Moreover, the electron donor capability of the azo dyes is important for their penetration and fixation in the fiber polymer, which may also reflect a respective impact of the hydrogen bond acceptor capability of the substrates (Yamaki et al., 2005).
The Congo red molecule is about 2.5 nm in length along its longitudinal axis. It is smaller than the micropore diameter and would be absorbed into micropores, macro pores and to the external surfaces of the fibers of wood pulp, micro fibrillated cellulose pulp from wood and bacterial cellulose samples. Due to strong binding affinity of Congo red with cellulose, several studies used Congo red for the assay of cellulase enzymes. Cellulase degrades the cellulose β (1–4) glycosidic chain, thus the adsorbed Congo red released and formed clear holo zone on agar media plate (Park et al., 2002). Recently, Rembrandt et al. (2012) reported the application of Congo red for quantitative measurement of cellulose degradation by cellulases. However, in swelled cellulose, the hydrogen bond degradation occurs instead of cellulose degradation, may cause more exposure of free hydroxyl groups that may enhance the Congo red binding site. Chemical structure of an individual dye determines the possibility of a break up of fiber-fiber hydrogen bonds, with a simultaneous creation of fiber-dye bonds (Mazeau et al., 2012). Thus amorphous area generated by the disruption of H-bonds that expose more –OH in crystalline cellulose, further binds with Congo red. The cellulose hydroxyl group may act as electron acceptor and Congo red amino or azo group as electron donar to make hydrogen bonds. Therefore, the more exposure of hydroxyl group on amorphous area of cellulose the more chances for Congo red hydrogen bonding and the more adsorption of Congo red. This basic idea of Congo red adsorption by hydrogen bond formation is considered in this study to analyze the degree of swelling or structural modification of cellulose. Meanwhile, we reported the cellulose microfibril swelling enzyme from Bacillus sp. AY8 that was characterized by the Congo red adsorption method (Haque et al., 2015).
The objective of this study is to establish a colorimetric method to evaluate the swelling and chemical modification of cellulose structure. To this end, the cotton fiber is treated using varying concentrations of NaOH at different temperatures. The amount of Congo red adsorption enhancement on treated cotton fiber is measured compared to the untreated cotton fiber. The swelling behavior of cotton fiber cellulose is satisfied by the Congo red adsorption method.
Materials & Methods
2.1. Materials
The sodium hydroxide was procured from Wako Pure Chemicals Industries, Ltd. (Chuo-ku, Osaka, Japan). Congo red was bought from High media (India). Impurities (non-cellulosic materials) free medical grade cotton cellulose was procured from TAE MYONG (Sung Ju Gum, Kyeung Buk, Korea). All other reagents used in this study were of analytical reagent grade.
2.2. Preparation of Congo red standard solution
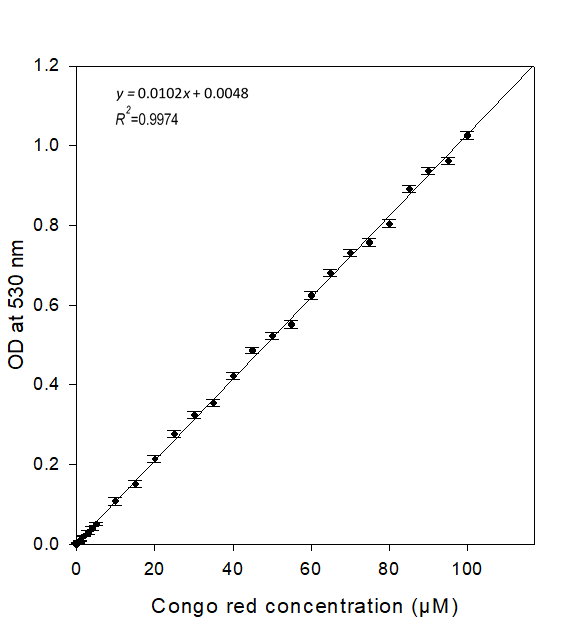
The 0 to 100 μM of CR stock solutions were prepared in 10 mM Tris-HCl buffer (pH 8.2) and kept in dark at room temperature. The optical density (OD) of these CR solutions was measured at 530 nm by using a spectrophotometer. The OD of CR standard solutions was taken three times. The CR standard curve was prepared from average OD of CR solutions from three repeated experiments.
2.3. Swelling induction of cotton cellulose and Congo red adsorption
Cotton cellulose was treated with 0%, 2%, 4%, 6%, 8%, 10% and 12% NaOH solutions at a solid loading of 2% mass concentration in 50 mL polypropylene tube at -20 °C for 60 min. The treated cotton was gently washed with deionized water until neutral pH. The neutralized cotton was gently pressed to remove the water content. For complete drying, the neutralized cotton was kept in vacuum dry (40 °C) woven for 30 min. For each sample, 10 mg of cotton was weighed and kept in different test tubes. For each single treatment, three replicates of test tubes with 10 mg of cotton were prepared. After that, 1 mL of CR stock solution (100 µM) was added to the test tube and kept for 10 min. Then 600 µL of supernatant was taken out and kept in amount of 200 µL in three consecutive tubes. Similarly, three consecutive blank tubes were prepared using 10 mM Tris-HCl buffer (pH 8.2). In addition, three replicas were prepared for UV absorbance of each sample and blank. The UV absorbance was measured at 530 nm using a Spectrophotometer.
2.4. Congo red adsorption enhancement
The OD of CR solutions after adsorption by 0% NaOH treated cotton was considered as control and 2 to 12% NaOH treated cotton was considered as test sample, respectively. The deducted OD from control to test sample was termed as Congo red adsorption enhancement (CAE) on swollen cotton. Thus, CAE = OD of control solution – OD of test sample solution. The CAE was converted to μM using CR standard curve equation, y = 0.0102x + 0.0048.
2.5. FTIR analyses
The dried cotton was grounded using a Willey Mill with a 140 steel mesh screen and prepared for FTIR analysis. The FTIR spectra were obtained by using powder FTIR spectrometer with ranges between 2000 and 4000 cm-1. Discs were prepared by mixing 2 mg dried sample powder with 200 mg KBr.
2.6. Determination of specificity
Here, we demonstrate two important applications of the method: (1) temperature dependent cotton swelling to determine the specificity of the method at the lower state of swelling. The lower state of swelling was induced by treating the cotton at 23 °C and 4 °C using NaOH (4%, 8%) solutions for 60 min. (2) Observation of time dependent cotton swelling profile, to end, the cotton cellulose was treated at -20 °C by using 8% NaOH for 0 to 240 min. The cotton swelling assay was performed by using the same protocol.
Results
3.1. Rationale for assay
We developed a simple and sensitive colorimetric method for determining the degree of cotton cellulose swelling. The cotton was swollen after treating with NaOH solutions. The crystalline area of NaOH treated cellulose was reduced by disrupting the hydrogen bonds and consequently increasing the amorphous area. The untreated cotton cellulose has both some amorphous area and crystalline surface area. Therefore, some Congo red might be absorbed on untreated cotton cellulose. The amount of Congo red adsorption was measured by using UV spectral changes at 530 nm. However, higher amount of Congo red was adsorbed in swollen cellulose. This indicates that the swollen cotton cellulose generates more amorphous area than untreated cotton cellulose. We reasoned that the enhanced amount of Congo red adsorption on swollen cotton cellulose is proportional to the enhanced amorphousness that could be used to determine the degree of swelling in a simple spectrophotometric assay.
3.2. Optimization of experimental conditions
In order to obtain a precise assay, some conditions were optimized and considered. The standard curve of CR was developed to measure the quantity of CR adsorption enhancement (CAE) on treated cotton cellulose. The average UV absorbance of different CR solutions (0 to 100 μM) was measured at 530 nm and plotted in a graph represented in Figure 1. The amount of CR, after adsorption on cellulose, was measured in suspension using an UV-VIS spectrophotometer (Haft et al., 2012; Ougiya et al; 1998). Recently, the ‘Congo Red analysis of cellulose concentration’ (CRACC) method used 530 nm wavelength of CR (Haft et al., 2012). It was reported that pH values greater than 7 did not affect Congo red detection of carboxy methyl cellulose (Haft et al., 2012). Therefore, CR stock solutions were prepared in 10 mM Tris-HCl buffer (pH 8.2) to get constant spectroscopic results. The average absorbance was increased by approximately 0.01 per 1 µM of CR concentration increment in stock solutions. Therefore, a linear curve was attained with regression, R2 = 0.997 (Fig. 1). Varied concentrations of NaOH treated cotton cellulose was stained with 1 mL of 25 to 125 μM of CR solutions. The differences of CAE for each sample reached maximum using 100 μM of CR solution (data not shown). But it was not marked while using more than 100 μM of CR.
The CR binds rapidly on the treated cotton cellulose and the adsorption enhancement (CAE) was raised to maximum within 5~6 min when used with 100 μM of CR solution, Although dyeing, or indeed any other reaction, cannot take place within the crystalline regions of the fibre, it is not confined to the external surface. Thus the accessible internal surfaces are the voids between microfibrils and the space between elementary fibrils (Warwicker & Wright; 1967). Importantly, the CR adsorption into void and spaces between microfibrils was required 5 min for measuring the specific surface area of cellulose microfibrils (Ougiya et al; 1998). Although the CAE was raised to maximum within 5~6 min, this study selected total 10 min reaction time for CR binding on swollen cotton. Since the amount of CR adsorption may vary with the weight of cotton, the suitable weight of cotton was determined to optimize the condition. The 10 mg of cotton cellulose which is the least amount for easy weighing in electric microbalance and staining using 1 mL of CR solution in test tube, was selected for determining the degree of swelling.
3.3. Swelling evidence of cotton cellulose
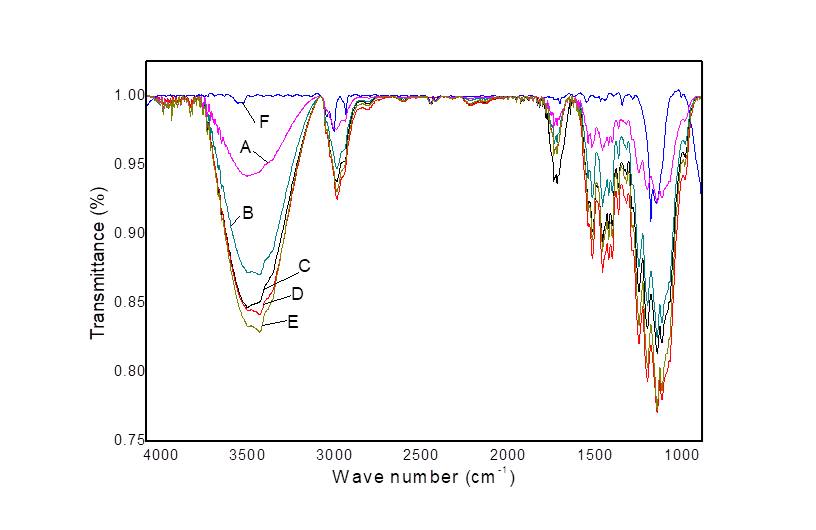
FTIR analyses were conducted on 0% (water), 2%, 4%, 6%, 8%, and 10% NaOH treated cotton to observe their swelling. Hydroxyl groups in a carbohydrate solid can either be associated, hydrogen bonded to other hydroxyl groups within the matrix, or free, not strongly H-bonded (Liang et al., 2014). Cellulose swelling generally occurs due to breaking of their intra and intermolecular H-bonds in crystalline area (Kim et al., 2009; Jager et al; 2011; Saloheimo et al; 2002). NaOH treatment splits the H-bonds in cellulose, which was confirmed by the absorbance variation and wave number shift in the FTIR spectra (Oh et al; 2005). Therefore, the H-bond absorbance of 0%, 2%, 4%, 6%, 8% and 10% NaOH treated cotton cellulose was observed and represented graphically in Figure 2. The intra-molecular H-bonds for 2-OH· · ·O-6 and 3-OH· · ·O-5, and the intermolecular H-bonds for 6-OH· · ·O-3´ appeared at 3455–3410 cm-1, 3375–3340 cm-1, and 3310–3230 cm-1, respectively (Oh et al; 2005). In Figure 2, the FTIR spectra of H-bonded O-H stretching vibrations at around 3415 cm-1 were resolved into three bands. Thus the bands at 3415 cm-1, 3340 cm-1, and 3280 cm-1 were related to the sum of the valence vibrations of an H-bonded OH groups of the intramolecular H-bond 2-OH· · ·O-6, intramolecular H-bond of 3-OH· · ·O-5 and the intermolecular H-bond of 6-OH· · ·O-3´, respectively. However, the intermolecular H-bond was predominantly visible than intramolecular H-bonds in water treated cotton cellulose. While the intermolecular H-bond intensity was gradually reduced and intramolecular H-bond intensities were more vibrant in 4%, 6%, and 8% NaOH treated cotton cellulose. This indicates the intermolecular H-bonds in 4%, 6%, and 8% NaOH treated cotton cellulose was disrupted, which caused loosening the structure of cellulose microfibers. The hydroxyl stretching region of the spectrum was particularly useful for elucidating hydrogen bonding patterns because, in favorable cases, each distinct hydroxyl group gives a single stretching band at a frequency that decreases with increasing strength of hydrogen bonding (Cael et al, 1975). Therefore, increased intensities of the H-bonded OH groups vibrations, appeared for NaOH treated cotton cellulose around 3000–4000 cm-1 (Fig. 2), were related with the decreasing strength of the intra 2-OH· · ·O-6 and 3-OH· · ·O-5, and the intermolecular H-bonds for 6-OH· · ·O-3´ H-bonds, respectively. The absorbance over the region from 2700-3000 cm-1 is attributed to C-H vibrations (Snyder et al. 1978) and the baseline in this region reflects the O-H absorbance (Oh et al; 2005). Therefore, the increased intensity at this region of 4 to 8% NaOH treated cotton indicates the exposure of free -OH groups. However, the band intensity in the region above 3000 cm-1 is increased after NaOH treatment and the intensity followed the rank order of 8% NaOH treated > 4% NaOH treated > 0% NaOH treated cotton cellulose, respectively. This result indicates that the H-bonds were more disrupted or broken in 8% NaOH treated cotton compared to 6%, and 4% NaOH treated cotton. Therefore, 8% NaOH treated cotton cellulose was more swollen mainly by breaking the intermolecular H-bonds and exposing free -OH groups than 4% NaOH treated cotton cellulose. In contrast, the H-bonds intensities of the 10% NaOH treated cotton cellulose were less observed. It is probably occurred due to the interaction of Na+ ion of NaOH with cellulose -OH groups or some chemical modifications in this study.
3.4. Determination of swelling degree
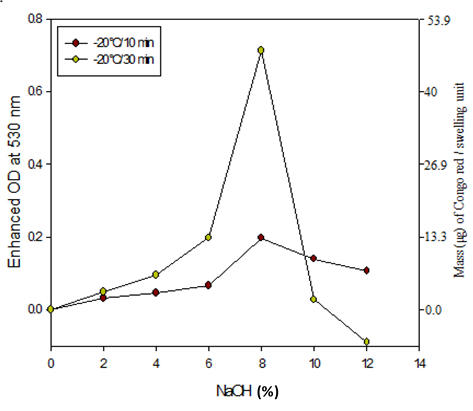
Figure 3 shows that the CAE (Enhanced OD) was sharply increased from 0% to 4% NaOH treatment and exhibited maximum for 8% NaOH treatment. The NaOH treatment might change the ratio of amorphous and crystalline areas (Oh et al; 2005), which resulted in the higher amount of CR adsorption on NaOH treated cotton cellulose. Since the accessible areas for dyeing were mainly the amorphous area (Ciovica et al., 1990), the higher trend of CAE was due to the increased exposure of amorphous areas of treated cotton cellulose. Meanwhile, the FTIR result indicates that the swollen cotton cellulose -OH groups vibrations were increased by breaking of the H-bonds. The interaction of CR with cellulose is exothermic, and CR molecules are adsorbed on cellulose surface through chemical interactions. During CR adsorption, most of the H-bonds occur via the sulfonate, amino, and azo groups of CR and hydroxyl methyl groups of C2 and C6 carbon atom of each glucosyl ring of cellulose (Mazeau et al., 2012). Therefore, the increased CAE might mainly be due to the enhanced H-bonding of CR with the exposed hydroxyl groups of cellulose. On the other hand, it was likely that the highest CAE on 8% NaOH treated cotton cellulose was due to the highest state of swelling. On a pure scientific ground, the solubilization of cellulose occurred in the very narrow Q region of 8 to 9% NaOH (Porro, et al., 2007). Moreover, cotton cellulose was highly swollen at -10 °C to 4 °C in 6% to 10% NaOH concentrations (Ying et al., 2008). Wang et al. (2008) also reported that the maximal solubility of cotton cellulose occurs with 8% to 10% soda solution for low to moderate degree of polymerization (Wang et al., 2008). Meanwhile, the decreased color intensity of CR solution was visually observed after adsorption by swollen cotton cellulose.
To determine the degree of cotton cellulose swelling, consideration of measuring the amount of CR adsorption might be more practical approach than analyzing the number of H-bonds disruption. Therefore, this assay determines the amount of CR adsorption via binding of CR on cellulose microfibers of treated samples and the resultant decrease in UV absorbance. Since, the NaOH (2- 8%) treated cotton cellulose gained more amorphous area due to disruption of the H-bonds, therefore, the exposure of free -OH groups in amorphous cellulose leads to more CR adsorption. Thus the magnitude of OD changes of the CR solution was proportional to the magnitude of H-bonds disruption. Thus the OD of CR solution, after adsorption of water (0% NaOH) treated cotton, was taken as control (OD1) and the OD of CR solution, after adsorption by 2-10% NaOH treated cotton was taken as test sample (OD2 or OD3). Since NaOH treated cotton cellulose adsorbed more CR than water treated cotton, therefore, CR adsorption enhancement (CAE) can be calculated as: (e.g. for 8% NaOH treated cotton cellulose)
CAE = OD1 – OD3…………… (1),
from CR standard curve, y = 0.0102x + 0.0048, R² = 0.9974
- e. x = [y + 0.0048]/0.0102 ………….. (2),
where, x = μM of CR solution, y = OD at 530 nm.
From (1) and (2),
We calculated the CAE to concentration (μM) of CR as follows,
xc = [CAE + 0.0048]/0.0102…………… (3),
where, xc = μM of CR adsorption enhancement.
Using equation (3), the CAE for 8% NaOH treated cotton attained maximum 0.077 that might be converted in to 7.8 µM of CR. This result comes from 10 mg of cotton that was treated with 8% NaOH for 30 min at -20°C. Here, we propose that 1µM of CR adsorption enhancement on 10 mg of NaOH treated cotton cellulose is equal to one unit of swelling (Fig. 3).
3.5. Analytical performance and method validation
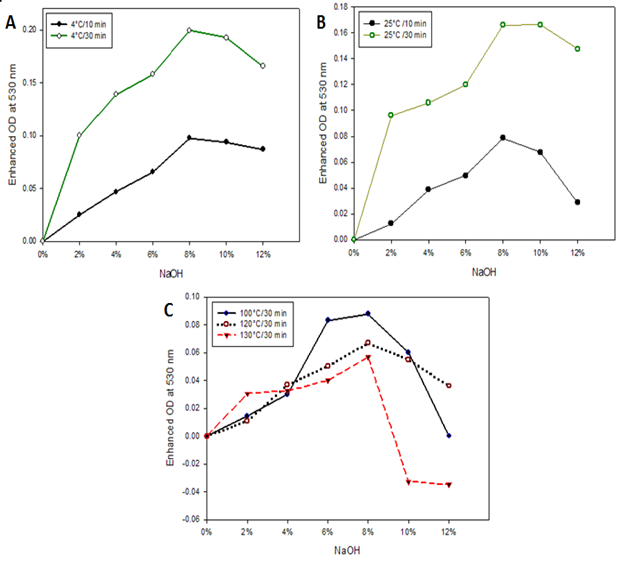
Under the optimized preparation conditions, we evaluated the time and temperature effect on cotton cellulose swelling by using this method. To observe the temperature effect, cotton cellulose was treated with NaOH at 4 °C and 25 °C and estimated the swelling unit. The trend of swelling unit of treated cotton cellulose was slightly different at these temperatures (Fig. 4), where the swelling unit found maximum for the 8% NaOH treatment at 4 °C and 25 °C treatment, respectively. However, the swelling unit found higher at 4 °C than 25 °C treatment. Therefore, the established assay method displayed excellent specificity and could discriminate the swelling evidence effectively and also potentially be used to determine the major or minor degree of swelling. However, the swelling units were found maximum at -20 °C (Fig. 3) even with treatment using similar concentration of NaOH. It seems the more cooling temperature the more swelling of cotton cellulose.
On the other hand, the swelling unit was quite lower when cotton fiber was treated at higher temperature (Fig. 4C). The degree of swelling was always higher in order like 100°C>120°C>130°C in case of 2 to 8% NaOH treatment. The above results are a good agreement with the statement that the swelling (Richter, et al., 1957) and solubility (Wang et al., 2008) of cellulose become more pronounced at the lower temperature. (Kunze & Fink, 2005) showed that for the interaction of cellulose with NaOH, a decrease in temperature acted similarly to an increase in NaOH concentration. Thus the proposed method satisfies the NaOH induced swelling character of cellulose reported by Kunje and Fink (Kunze & Fink, 2005) and Warwicker (1971). Since the proposed method satisfies the temperature dependent swelling behavior of cellulose, therefore, the swelling profile of cotton was also determined at -20 °C using 8% NaOH.
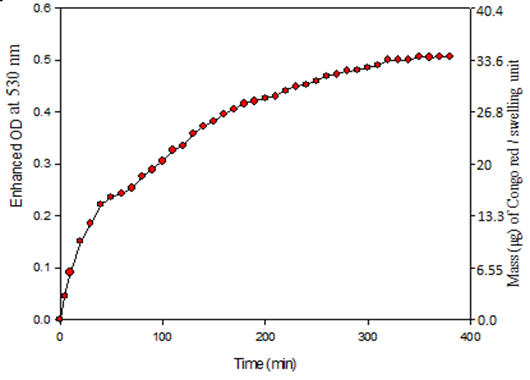
The CAE on swollen cotton cellulose was plotted against time (min). The swelling unit was increased up to 120 min and observed a steady state after that period (Fig. 5). The swelling profile of cotton cellulose shows that the swelling rapidly occurred within 10 min. As a consequence, an initial linear slope of CR adsorption on cellulose appeared. An initial linear slope of swelling was reported for quaking aspen and Douglas-fir II wood cellulose in pyridine and ethylene glycol, respectively (Mantanis et al., 1994). The above study suggests that the proposed method properly reflects the swelling behavior of cellulose.
A less dispersion of cotton fiber is observed in 10% NaOH solution, whereas it is completely stacked at 12% NaOH solution. The study reported that the Na+ ions interact more strongly with cellulose at 268K rather than at room temperature (Porro et al., 2007). Thus the Na-cellulose formation rate at -20°C is higher than at 4°C that reflected by Congo red adsorption in Fig. 3 and Fig. 4. Importantly, the 12% NaOH-treated cotton fiber seems more stacked rather than disruption or unwinding like other samples. A plausible explanation can denote that it might retain a massive Na+ with hydroxyl groups of cellulose. These results are accordance with the statement that the swelling becomes more pronounced at the lower temperature (Richter et al., 1957). Kunje and Fink showed that for the interaction of cellulose with NaOH, a decrease in temperature acted similarly to an increase in NaOH-concentration. Thus Congo red adsorption satisfies the NaOH induced swelling character of cellulose reported by Kunje and Fink. The mass of Congo red adsorption enhancement on cotton cellulose is higher at lower temperature (-20°C and 4°C) than room temperature that satisfies the swelling behavior of cellulose. In addition, the mass of Congo red adsorption enhancement is increased with time of swelling induction indicates the more swelling the more Congo red binding. Several methods have been reported for wood and cellulosic fibers swelling such as changes in dimension by micrometer (Schewalble and Beiser, 1931), centrifugal water retention (Hopner et al., 1955), solute exclusion technique (Aggebrandth and samuellson.,1964), Mercury dilatometer (expansion of mercury) (Kress and Bialkowsky., 1931), Computer linear variable displacement transformer (LVDT), Mercury dilatometer (Mckenzie., 1956), maximum liquid retention values (LRV) (Phillip, 1973), and benzene retention (Richter et al., 1957). This is a first report of colorimetric evaluation of cellulose structure modification including cellulose swelling, chemical modification (generation of Na-cellulose, degradation). It is a sensitive method related with free OH groups on cellulose that can measure slight changes of cellulose structure. In conclusion, cellulose structural modification related with C-2, C-3, C-6 cause’s deformation of hydrogen bonds of cellulose microfibers that cause swelling, as a consequence, more Congo red molecules forms H-bond with cellulose microfibers. However, the structural modification of cellulose such as Na-cellulose formation leads to less formation of H-bond by Congo red. In contrast, other conventional methods do not relate with any chemical reactions regarding H-bond deformation of cellulose that causes swelling. Thus swelling measurement with Congo red approach is a suitable idea. The Congo red solution color is highly sensitive to lower pH (>7) and changes its color. Therefore, pH of treated cotton cellulose must be adjusted to 7 or above by washing with deionized water. As a matter of fact, the Congo red solution pH was maintained appx. at 8.2 in Tris-HCl buffer and stored in room temperature (~25°C). Moreover, the Congo red adsorption enhancement to all treated cotton cellulose was conducted at room temperature. Since the Congo red has been shown to alter its spectral properties in the presence of amyloid protein fibers (Howie et al., 2007), therefore, it should be avoided during the assay.
Conclusion
In this study, a colorimetric strategy for the determination of the degree of cotton cellulose swelling has been demonstrated. The Congo red adsorption based on colorimetric determination of cotton cellulose swelling is highly sensitive to the degree of swelling regarding H-bonds disruption of cellulose. It also reflects the conventional swelling behavior of cellulose. The overall process of swelling evaluation can be finished within 1.2 h; therefore, the developed strategy provides a simple, rapid, high sensitivity and economic platform for the determination of cellulose swelling. This work provides a foundational framework for the determination of cellulose swelling regarding H-bonds disruption by the chemical approach. This method may be a powerful tool to screen some unknown microorganisms and bioengineering of proteins regarding cellulose swelling.
Acknowledgement
The authors are very much grateful to Professor Ki Hun Park, Dept. of Applied Life Chemistry, Gyeongsang National University, South Korea, for his critical review and comments to improve the manuscript quality.
Images and Tables
References
Agarwal, V., Huber, G. W., Conner, Jr. W. C., Auerbach, S. M. Simulating infrared spectra and hydrogen bonding in cellulose I? at elevated temperatures, J. Chem. Phys. 135 (2011), 134506-134519. PMid:21992323
View Article PubMed/NCBIAggebrandt, L., Samuelsson, O. Penetration of water soluble polymers into cellulose fibers, J. Appl. Polym. Sci. 8 (1964) 2801-2812.
View ArticleCael, J. J., Gardner, K. H., Koening, J. L., Blackwell, J. Infrared and Raman spectroscopy of carbohydrates, Normal coordinate analysis of cellulose I. J. Chem. Phys. 62 (1975) 1145-1153.
View ArticleCiovica, S., Vlaic, M., Stanciu, C., Chiuaru, R., Asandei, N. Some aspects concerning viscose fiber dyeing uniformity I. Staple viscose dyeing uniformity, Cellul. Chem. Technol. 24 (1990) 251-261.
Hopner, T., Jayme, G., Ulrich, J. C. Determination of the water retention (swelling value) of pulps, Das Papier, 9 (1955) 476-482.
Haft, R. J. F., Gardner, J. G., Keating, D. H. Quantitative colorimetric measurement of cellulose degradation under microbial culture conditions, Appl. Microbiol. Biotechnol. 94 (2012), 223-229. PMid:22391973
View Article PubMed/NCBIHaque, M. A., Cho, K. M., Barman, D. N., Kim, M. K., Yun, H. D. A potential cellulose microfibril swelling enzyme isolated from Bacillus sp. AY8 enhances cellulose hydrolysis. Process Biochem. 50 (2015) 807-815.
View ArticleHowie, A. J., Brewer, D. B., Howell, D., Jones, A. P. Physical basis of colors seen in Congo red-stained amyloid in polarized light, Lab Invest. 88 (2007) 232?242. PMid:18166974
View Article PubMed/NCBIJager, G., Girfoglio, M., Dollo, F., Rinaldi, R., Bongard, H., Commandeur, U., Fischer, R., Spiess, A. C., Buchs, J. How recombinant swollenin from Kluyveromyces lactis affects cellulosic substrates and accelerates their hydrolysis, Biotechnol. Biofuels. 4 (2011) 1-16. PMid:21943248
View Article PubMed/NCBIKim, E. S., Lee, H. J., Bang, W. G., Choi, I. G., Kim, K. H. Functional characterization of a bacterial expansin from Bacillus subtilis for enhanced enzymatic hydrolysis of cellulose, Biotechnol. Bioeng. 102 (2009) 1342-1353. PMid:19058186
View Article PubMed/NCBIKress, O., Bialkowsky, H. Some chemical and physical observations on Hydration, Paper Trade J. 23 (1931) 219-228.
Liang, L., Corradini, M. G., Ludescher, R. D. Influence of antioxidant structure on local molecular mobility in amorphous sucrose, Carbohydr. Res. 383 (2014) 14-20. PMid:24239605
View Article PubMed/NCBILee, S. W., Teramoto, Y., Endo, T. Enzymatic hydrolysis of woody biomass micro/nanofibrillated by continuous extrusion process I-Effect of additives with cellulose affinity, Bioresour. Technol. 100 (2009) 275-279. PMid:18632266
View Article PubMed/NCBIOuyang, J., Dong, Z., Song, X., Lee, X., Chen, M., Yong, Q. Improved enzymatic hydrolysis of microcrystalline cellulose (Avicel PH101) by polyethylene glycol addition, Bioresour. Technol. 101 (2010) 6685-6691. PMid:20385489
View Article PubMed/NCBIMackenzie, A. W. The structure and properties of paper. Part VI. The effect of swelling pretreatments on interfibre bonding capacity, Aust. J. Appl. Sci. 7 (1956) 35-41.
Mazeau, K., Wyszomirski, M. Modelling of Congo red adsorption on the hydrophobic surface of cellulose using molecular dynamics, Cellulose, 19 (2012) 1495-1506.
View ArticleMantanis, G. I., Young, R. A., Rowel, R. M. Swelling of wood. Part II. Swelling in organic liquids, Holzforschung, 48 (1994) 480-490.
View ArticleOugiya, H., Hioki, N., Watanabe, K., Morinaga, Y., Yoshinaga, F., Samejima, M.
Relationship between the physical properties and surface area of cellulose derived from adsorbates of various molecular sizes, Biosci. Biotechnol. Biochem. 62 (1998) 1880-1884. PMid:27385448
View Article PubMed/NCBIOh, S. Y., Yoo, D., Shin, Y., Kim, H. C., Kim, H. Y., Chung, Y. S., Park, W. H., Youk, J. H. Crystalline structure analysis of cellulose treated with sodium hydroxide and carbon dioxide by means of X-ray diffraction and FTIR spectroscopy, Carbohydr. Res. 340 (2005) 2376-2391. PMid:16153620
View Article PubMed/NCBIPorro, F., Bedue, O., Chanzy, H., Heux, L. Solid state 13C NMR study of Na-cellulose complex, Biomacromolecules. 8 (2007) 2586-2593. PMid:17661517
View Article PubMed/NCBIPark, S. R., Cho, S. J., Kim, M. K., Ryu, S. K., Lim, W. J., An, C. L., Hong, S. Y., Kim, J. H., H. Kim, H. D. Yun. Activity enhancement of Cel5Z from Pectobacterium chrysanthemi PY35 by removing C-terminal region, Biochem. Bioph. Res. Commun. 291 (2002) 425-430. PMid:11846423
View Article PubMed/NCBIPhillip, B., Schleicher, H., Wagenknecht, W. J. The influence of cellulose structure on the swelling of cellulose in organic liquids, Polym. Sci. Symp. 42 (1973) 1531-1543.
Richter, G. A., Herdle, L. E., Wahtera, W. E. Cellulose swelling measured by benzene retention, Ind. Eng. Chem. 49 (1957) 907-912.
View ArticleSaloheimo, M., Paloheimo, M., Hakola, S., Pere, J., Swanson, B., Nyyssonen, E., Bhatia, A., Ward, M., Penttila, M. Swollenin, a Trichoderma ressi protein with sequence similarity to the plant expansions, exhibits disruption activity on cellulosic materials, Eur. J. Biochem. 269 (2002) 4202-4211. PMid:12199698
View Article PubMed/NCBISnyder, R. G., Hsu, S. L., Krimm, S. Vibrational spectra in the C-H stretching region and the structure of the polymethylene chain. Spectrochimica Acta, Part A: Molecular and Biomolecular Spectroscopy, 34 (1978) 395?406. 80167-6
View ArticlePerez, S., Mazeau, K. In Polysaccharides:Structural Diversity and Functional Versatility, 2nd ed., Marcel Dekker: New York, 2005; pp 41?68.
Venkataraman, K. In The Chemistry of Synthetic Dye, Academic press: New York, 1952; pp 705?1442.
Shore, J. In Cellulosic Dyeing, The Society of Dyers and colorists: England, 1995; pp 163.
Wang, Y., Zhao, Y., Deng, Y. Effect of enzymatic treatment on cotton fiber dissolution in NaOH/urea solution at cold temperature, Carbohyd. Polym. 72 (2008) 178-184.
View ArticleWarwicker, J. O., Wright, A. C. Function of sheets of cellulose chains in swelling reactions on cellulose, J. Appl. Polym. Sci. 11 (1967) 659-671.
View ArticleWadsworth, L. C., Cuculo, J. A. In Modified Cellulosics, Rowell, R. M., Young, R.A., Eds; Academic Press: New York, 1978; pp 117.
Yamaki, S. B., Barros, D. S., Garcia, C. M., Socoloski, P., Oliveira, O. N., Atvars, T. D. Z. Spectroscopic studies of the intermolecular interactions of Congo Red and Tinopal CBS with modified cellulose fibers, Langmuir, 21 (2005) 5414-5420. PMid:15924470
View Article PubMed/NCBIKunze, J., Fink, H. P. Structural changes and activation of cellulose by caustic soda solution with urea. Macromol. Symp. 223 (2005) 175-187.
View ArticleWarwicker, J. J. O. In Cellulose and cellulose derivatives, Part 4, Bikales, N. M., Segal, L., Eds; New York: Wiley-Interscience, 1971; pp 325.
Ying, W. In Cellulose fiber dissolution in sodium hydroxide solution at low temperature: Dissolution Kinetics and Solubility Improvement, Ph. D. Thesis Paper, Georgia Institute of Technology; Atlanta, USA, 2008; pp 18.