Rashid Mohamed Kaka
Email: rkaka2001@gmail.com
Phone: +254 725 911 996;
Severity: Warning
Message: session_start(): open(/home/siftdesk.org/tmp/sess_66c4qhjj1ro9ts7ob26rbi5rmq, O_RDWR) failed: Disk quota exceeded (122)
Filename: controllers/Home.php
Line Number: 44
Backtrace:
File: /home/siftdesk.org/public_html/application/controllers/Home.php
Line: 44
Function: session_start
File: /home/siftdesk.org/public_html/index.php
Line: 316
Function: require_once
Severity: Warning
Message: session_start(): Failed to read session data: files (path: /home/siftdesk.org/tmp)
Filename: controllers/Home.php
Line Number: 44
Backtrace:
File: /home/siftdesk.org/public_html/application/controllers/Home.php
Line: 44
Function: session_start
File: /home/siftdesk.org/public_html/index.php
Line: 316
Function: require_once
© 2019 Sift Desk Journals. All Rights Reserved
VOLUME: 2 ISSUE: 2
Page No: 155-164
Rashid Mohamed Kaka
Email: rkaka2001@gmail.com
Phone: +254 725 911 996;
Rashid Mohamed Kakaa*, Joseph Owino Jung’aa, Mohamed Badamanaa, Renison Kahindi Ruwab, and Harrison Charo Karisac
aUniversity of Nairobi, College of Agriculture & Veterinary Services, Nairobi, Kenya.
bKenya Marine and Fisheries Research Institute, Mombasa, Kenya.
cWorldFish, 18 B El Marashely Street, 4th Floor Apartment # 17, Zamalek, Cairo, Egypt.
Palaniappan Ramasamy(researchsbmch@gmail.com)
Xiaolin Liu(liuxiaolin@nwsuaf.edu.cn)
Rashid Mohamed Kaka,Joseph Owino Jung’a, Mohamed Badamana, Renison Kahindi Ruwa, and Harrison Charo Karisa, Morphometric variations among populations of the wild Penaeid shrimps in Malindi–Ungwana Bay along the Northern Coast of Kenya (2019) Journal of Aquaculture, Fisheries & Fish Science 2(2) pp:155-164
Intraspecific morphological variation in the wild penaeid shrimps was studied in four estuarine and two shallow–water study sites in Malindi–Ungwana Bay. Three morphometric characteristics, body length, carapace length and total length describing shape of penaeid shrimps were used. Total length, the explanatory variable, brings out significant information in shrimps, while groups of population that varied significantly in terms of morphometric variations were easily differentiated (P < 0.05) across the sample stations. Generally, Principle Component Analysis dimensions for all shrimps except the Penaeus canaliculatus indicated an inversely correlation between body length and carapace length and a good correlation of carapace length and total length. Several species displayed intraspecific morphological variability where shape variations increased with size and postlarva were closer to each other than adults along the first axis of Principle Component Analysis. The present study concludes that the variability among individual species within each population indicates the presence of high genetic diversity among the populations of different shrimps that give rise to genetically panmictic populations within the Malindi–Ungwana Bay.
Key words: Estuarine, Genetic diversity, Morphology, Phenotypic plasticity, Variability
Morphometric variations are revelations of continuous data derived from a set of measurements in the morphometric studies (Kaouèche, Bahri-Sfar, Hammami, & Hassine, 2017). These measurements are used in fisheries biology to determine similarity or dissimilarity of taxa (Reist, 1985) or relationships among various taxonomic groups (Turan, 1999). The analysis of phenotypic variations forms the basis for identifying stocks as well as evaluating their population structure (Mojekwu & Anumudu, 2015). Despite the use of molecular genetics today, these conventional approaches continue to play important roles in stocks identification (Solomon et al., 2015), while the use of multivariate techniques is thus receiving more attention in delineation of the stocks (Bektas & Belduz, 2009).
All different types of life cycles of the family Penaeidae as described by Dall et al. (1990) cover ranges of heterogeneous environment which require different morphological traits that match with local environments (Jørgensen, Pertoldi, Hansen, Ruzzante, & Loeschcke, 2008). Any organism adapting in such heterogeneous environment requires to produce sufficient chances for genetic variation (Rajakumaran, Vaseeharan, & Yeshvadha, 2013) as specific genetic variation is needed for a particular adaptation (Lundqvist, Andersson, & Lonn, 2008). Knowledge of genetic diversity based on morphological traits is crucial to species conservation, yet understanding of these phenomena, particularly in penaeid shrimp fishery of Malindi–Ungwana Bay, is scant. We hypothesized that low genetic variation in penaeid shrimp population of Malindi–Ungwana Bay has led to its population decline that threatens its evolutionary potential. The present study, therefore, intended to investigate the genetic diversity based on morphometric variations within and between different species of penaeid shrimp throughout their distributional ranges in Malindi–Ungwana Bay.
2.1. Study area
Malindi–Ungwana Bay is located between Malindi and Ras Shaka, north of Kipini in the Northern Coast of Kenya (Figure 1). The study had six sample stations, four of which were located within the estuaries (S1, S2, S3 and S4), while the other two sample stations (S5 and S6) were within the shallow waters (Kaka, Jung’a, Badamana, Ruwa, & Karisa, 2019). The choice of establishing sample stations was mainly considered on the basis of areas frequently used by artisanal fishers or trawlers as well as the estuarine areas around the river mouths of River Tana and River Sabaki. During the shallow water survey, the entire bay was stratified using regular polygons into four zones by depth and distance from shore. The total area of each zone was estimated in ArcGIS area calculator as: less than 10 m depth (137.3 nm2) represented Zone 1; 10–20 m (234.1 nm2) for Zone 2; 20–40 m (136.3 nm2) for Zone 3; and 40–100 m (38.7 nm2) represented Zone 4 (Kimani et al., 2012; Kaka et al., 2019).
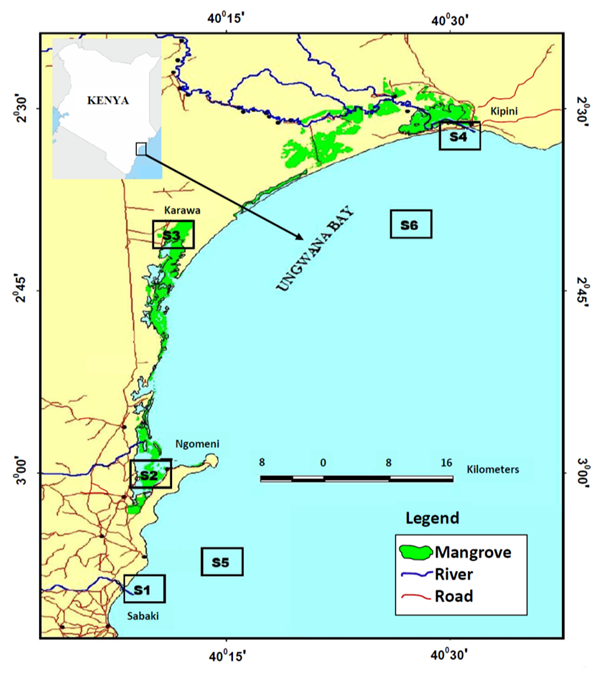
Figure 1: Map showing the location of the sample stations (S1, S2, S3, S4, S5 and S6) in Malindi-Ungwana Bay
2.2 Data Collection
A total of 1364 specimens were studied from six sample stations (Figure 1). Sample collections were carried out in the estuary and shallow water sample stations for two separate surveys of 10 and 13 days respectively in every monsoon season with SEM being cooler than NEM. During sampling in the estuaries stations, 8 hauls were made daily by two people using a seine net of 1 inch stretched mesh size measuring 20 m long by 1.25 m high (Kaka et al., 2019). Surveys in the shallow waters were conducted for one hour intervals at a speed of 2.5 knots using Fishing Vessel VEGA fitted with engine capacity of 496 horsepower and a 70 mm mesh size towing net (44.3 m long and 45 mm mesh size cod end). Records for sample stations’ coordinates and depths were taken during seasonal sampling periods of 10 and 13 days for estuaries and shallow waters respectively.
For every small reasonable catch (at least 30 specimens), the whole catch was considered as a single sample, sorted out by species, identified and weighted per species; and whereas the total catch was too large to manage as a single sample, then sampling proportion was performed at 10% of the catch (Tonks, Griffiths, Heales, Brewer, & Dell, 2008) with a desired margin of error at the 95% confidence level as the subsample (Kaka et al., 2019). These samples were considered as being representative of the trawl catch and sampling procedures allowed quantitative comparisons of the samples in relative terms. The samples were identified morphologically according to Chan (1998). When the identification of the specimens was difficult, they were recognized to the genus level due to lack of distinct characteristics and then subjected to further genetic analysis to identify them to species level.
Morphometric measurements were taken to the nearest 0.1 mm for body length (BL), carapace length (CL) and total length (TL) using a vernier calliper. When the abdomen was fully stretched, TL was measured from the tip of rostrum to the end of telson, while BL was measured from the mid dorsal line opposite the posterior orbital margin to the end of telson. The CL measurement was taken from the posterior margin of eyestalk to the posterior mid dorsal edge of carapace (Figure 2), while, body weight (BW) was measured to the nearest 0.1 gram using an electronic weighing balance.
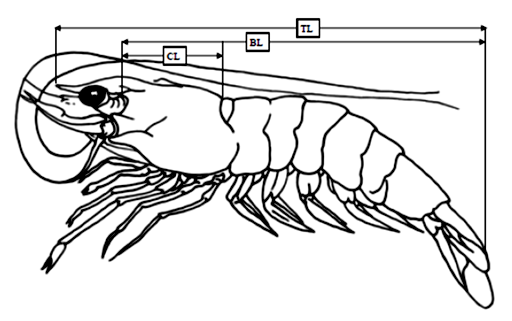
Figure 2: Diagrammatic representation of the morphometric characteristics, total length (TL), body length (BL) and carapace length (CL) used for penaeid shrimp.
2.3 Data handling and analyses
Measurements which were taken from morphometrics were transformed to BL by growth allometry using Reist (1985) to remove size effect as described in Gunawickrama (2007). The normality distribution of the standardized measurement after removal of size effect were confirmed using Shapiro–Wilk test, while t–tests were used to check mean differences between the species for each variable with type I error level controlled by Bonferroni correction (Rice, 1989). A general formula was used for correction of all morphometric data: (Sani, Andy Omar, Trijuno, & Nugroho, 2017) by logarithmically expressing as: where, MS is the standardized character measurement; MO is the observed character measurement; LS is the overall mean BL for all the penaeid shrimps from each sampling site; BL is the BL of the specimen; b is the slope of the regression of logMO on logBL for all penaeid shrimps.
Correlation of standardized data against size was carried out to remove size dependence. Since a number of specimens have damaged rostrum, BL was used as the basis of transformation. The correlation coefficient (R2) between standardized data and BL was determined to verify standardization efficiency. Both univariate and multivariate methods were used to analyse standardized data. The one way analysis of variance (ANOVA) followed by Tukey HSD multiple comparison test for unequal sample sizes was also used to determine differences among samples. In order to discriminate shrimp populations, separate Principle Component Analysis (PCA) for each species was used as well as its correlation matrix. The pattern of morphological variations between samples was assessed using Discriminant Function Analysis (DFA). In order to observe relationships among shrimp populations, 95% ellipses of population centroids were produced in DFA scatter diagram to study the relationships (Ola–Oladimeji et al., 2016). The Agglomerative Cluster Dendrogram (ACD) was constructed to classify clusters of penaeid populations based on the similar characteristics. All statistical analyses were performed using program Minitab 17 and XLSTAT 2017.
Morphometric characters of six populations of penaeid shrimps analysed by normality tests are presented in Table 1. The results from the Shapiro–Wilk test revealed that among the three morphometric variables, BL showed as the only variable that does not follow a normal distribution, and hence, show significant differences in all the penaeid species. In all the morphometric variables that were used, some significant differences were found in Metapenaeus monoceros Fabricius, 1798, Penaeus monodon Fabricius, 1798 and Penaeus semisulcatus De Haan, 1844. The variability of BL as dependent variable was well explained by two explanatory variables, CL and TL, in all species except in the CL of Penaeus canaliculatus Olivier, 1811 which had an insignificant variability of 7% (Table 2). The present study showed TL, based on the Type III sum of squares (P < 0.05), as the most influential among the two other variables. The results of one–way ANOVA showed R² is better explained by TL than CL in all species except P. canaliculatus which had very insignificant variability of 0.2%, P > 0.05 (Table 3). TL brings out significant information in every species as well as groups of population that varied significantly in terms of morphometric variations (P < 0.05).
Table 1: Results of normality tests of morphometric characters of Penaeid shrimps from Malindi-Ungwana Bay
|
Species |
N |
CL |
TL |
BL |
|
M. monoceros |
340 |
0.985* |
0.984* |
0.733** |
|
P. canaliculatus |
12 |
0.985 |
0.927 |
0.640* |
|
F. indicus |
420 |
0.986 |
0.920** |
0.602** |
|
M. japonicus |
141 |
0.984 |
0.987 |
0.784** |
|
P. monodon |
132 |
0.963* |
0.957** |
0.518** |
|
P. semisulcatus |
207 |
0.975* |
0.958** |
0.492** |
N = Number of individuals; CL = Carapace Length; TL = Total Length; BL = Body Length. Note: Means within the same row bearing different superscript differ significantly (P < 0.05)
Table 2: Contribution of two morphometric traits in explaining BL Variation using multiple regression analysis
|
Species |
N |
Variables |
Type III SS |
Predictor |
R2 Coefficient |
Pr > F |
|
M. monocero |
340 |
CL |
0. 644 |
-0.479 |
0.655 |
<0.0001 |
|
|
TL |
6.719 |
1.394 |
|
<0.0001 |
|
|
P. canaliculatus |
12 |
CL |
0.011 |
-0.549 |
0.069 |
0.017 |
|
|
TL |
0.095 |
1.470 |
|
<0.0001 |
|
|
F. indicus |
420 |
CL |
0.155 |
-0.288 |
|
<0.0001 |
|
|
TL |
3.440 |
1.220 |
0.744 |
<0.0001 |
|
|
M. japonicus |
141 |
CL |
0.122 |
-0.484 |
|
<0.0001 |
|
|
TL |
1.251 |
1.408 |
0.657 |
<0.0001 |
|
|
P. monodon |
132 |
CL |
0.159 |
-0.407 |
|
<0.0001 |
|
|
TL |
2.070 |
1.342 |
0.744 |
<0.0001 |
|
|
P. semisulcatus |
207 |
CL |
1.228 |
-0.757 |
|
<0.0001 |
|
|
TL |
6.948 |
1.654 |
0.958 |
<0.0001 |
N = Number of individuals; R² – coefficient of determination; F value (Fisher's F test); Pr > F is probability of significance of the difference at α = 0.05.
Table 3: Analysis of Variance of the seasonal morphometric relationships for Penaeid species from Malindi–Ungwana Bay
|
|
F. indicus |
P. canaliculatus |
P. monodon |
P. semisulcatus |
M. japonicus |
M. monoceros |
|||||||
|
Season |
Stn |
CL |
TL |
CL |
TL |
CL |
TL |
CL |
TL |
CL |
TL |
CL |
TL |
|
NEM |
S1 |
– |
– |
– |
– |
– |
– |
– |
– |
– |
– |
– |
– |
|
|
S2 |
1.820b |
2.071c |
– |
– |
– |
– |
1.874abc |
2.084abc |
1.879b |
2.082c |
– |
– |
|
|
S3 |
1.868b |
2.096c |
– |
– |
1.994ab |
2.202b |
– |
– |
1.955a |
2.160a |
– |
– |
|
|
S4 |
1.982a |
2.200ab |
– |
– |
2.118a |
2.326a |
– |
– |
– |
– |
– |
– |
|
|
S5 |
1.985a |
2.183b |
1.998a |
2.200a |
2.092a |
2.291ab |
1.937bc |
2.139b |
– |
– |
1.844a |
2.047cd |
|
|
S6 |
1.983a |
2.192b |
– |
– |
2.100a |
2.297a |
– |
– |
|
|
1.915a |
2.121a |
|
SEM |
S1 |
– |
– |
– |
– |
– |
– |
– |
– |
– |
– |
– |
– |
|
|
S2 |
– |
– |
– |
– |
– |
– |
2.069a |
2.001c |
– |
– |
1.854a |
2.066bc |
|
|
S3 |
1.844b |
2.089c |
– |
– |
1.859b |
2.083c |
1.838abc |
2.053bc |
– |
– |
1.784a |
1.996de |
|
|
S4 |
– |
– |
– |
– |
1.848b |
2.064c |
– |
– |
– |
– |
1.706a |
1.930e |
|
|
S5 |
11.984a |
2.206ab |
– |
– |
– |
– |
1.994ab |
2.192a |
– |
– |
1.915a |
2.120a |
|
|
S6 |
1.996a |
2.213a |
2.018a |
2.196a |
2.112a |
2.304a |
1.940c |
2.144b |
1.947a |
2.111b |
1.880a |
2.094b |
|
R² |
32.5% |
67.9% |
1.2% |
0.2% |
30.9% |
64.7% |
14.1% |
57.6% |
17.9% |
44.0% |
4.5% |
24.5% |
|
|
F |
28.29 |
124.55 |
0.12 |
0.02 |
9.32 |
38.22 |
6.59 |
54.59 |
9.94 |
44.51 |
2.63 |
18.05 |
|
|
Pr > F |
0.000 |
0.000 |
0.732 |
0.895 |
0.000 |
0.000 |
0.000 |
0.000 |
0.000 |
0.000 |
0.017 |
0.000 |
|
Stn – Sample station; R² – coefficient of determination; F – Fisher's F test; Pr > F – probability of significance of the difference at α = 0.05.
Note: Means that do not share a letter are significantly different
Generally, the PCA dimensions for all species except P. canaliculatus indicated an inversely correlation between BL and CL and a good correlation of CL and TL (Figures 3A–3B). In the case of Fenneropenaeus indicus Edwards, 1837, 98% of initial data variability revealed three distinct populations that were separated but homogeneously distributed. For Marsupenaeus japonicus Bate, 1888, 98.31% of the total variation in the morphometric characters revealed different population groups found in S2 during NEM season with those found in S3 during the same season as well as those found in S6 during both seasons. The results further revealed that distribution pattern of morphometric characters of P. monodon (98.26% of the initial variability of the data) formed two group populations from S3 and S4 sharing common characteristics while those from S6 had similar characteristics in all seasons with few outliers observed in them. Although the PCA dimension of M. monoceros with 99.11% of the total variation of the data revealed homogenous distribution, S3 seemed to have a mixed population during SEM season with two individuals in S4 possessing unique characteristics different from the rest. In the case of P. semisulcatus, 99.6% of the variation in the morphometric characters indicated two distinct group populations from S2 during SEM season while the rest were sharing common characteristics in all seasons. Lastly, 97.08% of the initial variability in the morphometric characters of P. canaliculatus revealed two distinct group populations, one from S6 with larger BL during SEM than those from S5 dominating NEM seasons.
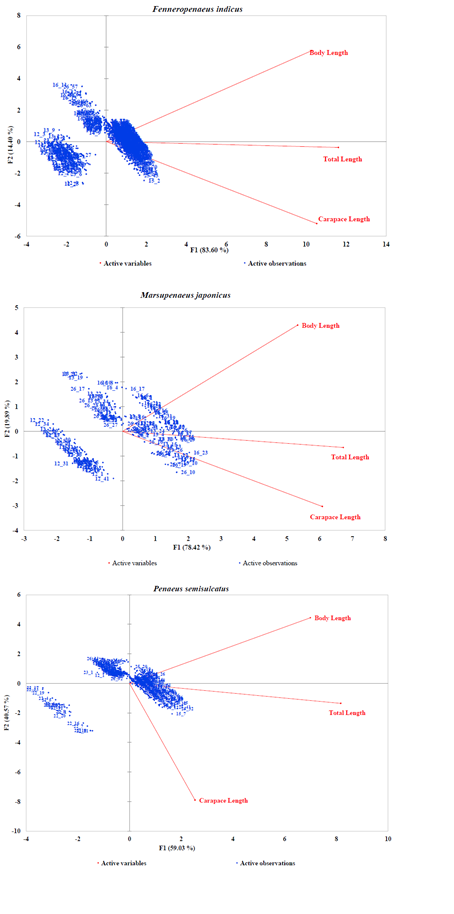
Figure 3A: PCA Scatter Plots of Fenneropenaeus indicus, Marsupenaeus japonicus, and Penaeus semisulcatus
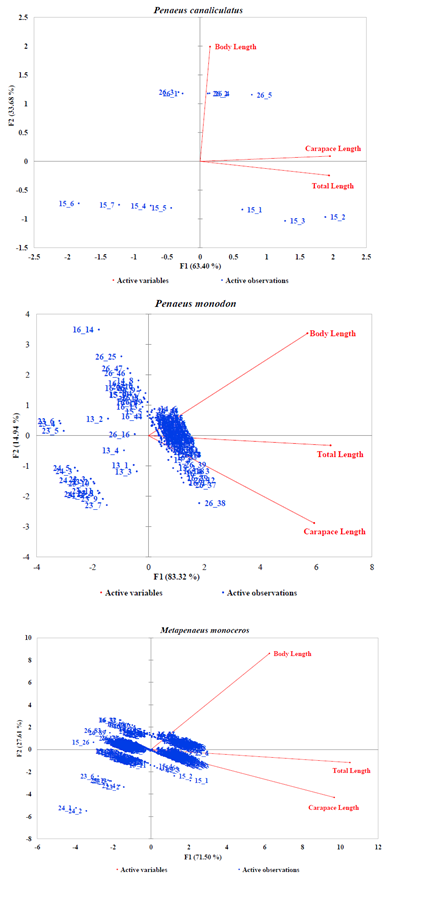
Figure 3B: PCA Scatter Plots of Penaeus canaliculatus, Penaeus monodon and Metapenaeus monoceros
The DFA applied to 1361 specimens based on Mahalanobis distances were analyzed after exploratory analysis to remove outliers with predictive classification of individuals for all group populations of penaeid shrimps (Figure 4). The results of this study showed centroids of populations for adult species partitioned closely to each other while the postlarva of Penaeus spp. and Metapenaeus spp. were classified far apart due to dissimilarities with their adult populations. The two populations of P. canaliculatus from S5 and S6 seemed to be different from each other as they were marked with no overlaps in all the evaluated characters.
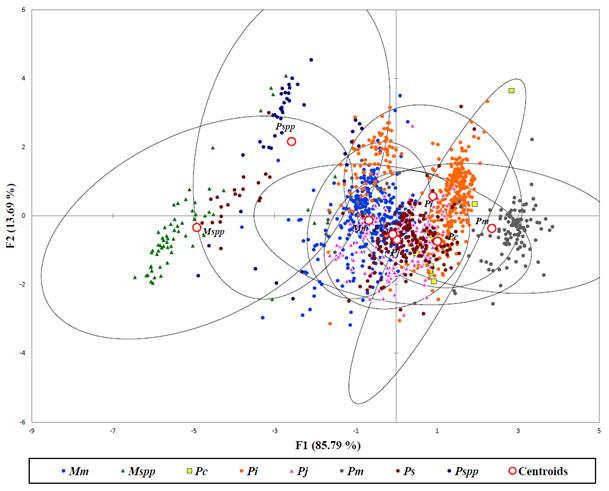
(Mm– Metapenaeus monoceros; Mspp– Metapenaeus spp.; Pc– Penaeus canaliculatus; Pi– Fenneropenaeus indicus; Pj– Marsupenaeus japonicus; Pm– Penaeus monodon; Ps– Penaeus semisulcatus; Pspp– Penaeus spp.)
Figure 4: Discriminant analysis showing Penaeid shrimps in Malindi-Ungwana Bay based on Mahalanobis distances.
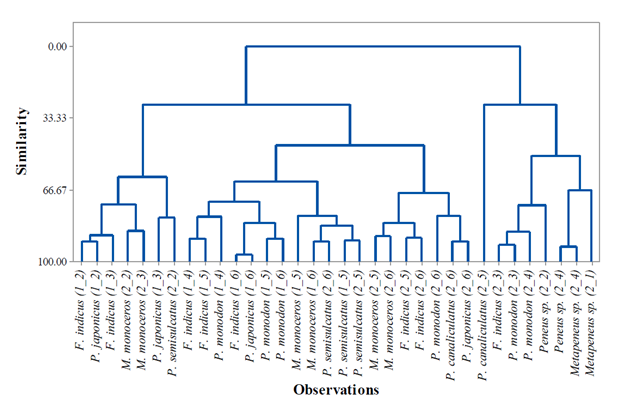
Figure 5: Agglomerative Cluster Dendrogram of the wild Penaeid shrimp populations based on morphometric characters collected from Malindi-Ungwana Bay.
The ACD of the penaeid shrimps is shown in Figure 5. Based on similar characteristics, clusters of homogeneous populations of F. indicus were observed from S4 and S5 during NEM season as well as P. monodon from S5 and S6 while, a good number of clusters with homogeneous populations during SEM season were observed in M. monoceros from S2 and S3 as well as S5 and S6; F. indicus from S5 and S6; Metapenaeus sp. from S1 and S4. The results also showed a homogeneous population of P. semisulcatus observed in S5 in both seasons. Generally, at the level of similarity of 66.7%, clusters of heterogeneous or increase in diversity among penaeid shrimp populations were observed across Malindi–Ungwana Bay in both seasons. Postlarva which were collected during SEM season were clustered together because of sharing dissimilar characteristics with their adult populations. The present study further revealed P. canaliculatus from S5 is well separated from S6 and its group population is classified as the most distant morphologically population in Malindi–Ungwana Bay.
The genetic diversity of wild penaeid shrimps from six geographic locations in the Malindi–Ungwana Bay was investigated using morphometric variations. Reed and Frankham (2001) reported that when studying processes involving natural selection, it is imperative to assess directly quantitative trait variation. This study revealed significant morphometric variations among groups of populations in Malindi–Ungwana Bay which are said to be solely from body shape (Vatandoust, Abdoli, Anvarifar, & Mousavi-sabet, 2014) and not size effects (Gunawickrama, 2007; Anvarifar et al., 2011). In other studies, Bagherian & Rahmani (2007) and Lundqvist et al. (2008) have considered the shape variation among individuals or populations as a reflection of genetic variation caused by local adaptation. Populations of penaeid shrimps in this study are geographically very close to each other where phenetic differences examined between populations as suggested by Lundqvist et al. (2007) show apparent signs of response to local adaptation on various forms of selection pressures.
Heterogeneity as well as homogeneity in morphology was evident in all populations of penaeid shrimps. The DFA managed to separate distinct populations of individual penaeid species while postlarva of Penaeus spp. and Metapenaeus spp. were classified far apart due to dissimilarities with their adult populations. In this study, several species displayed intraspecific morphological variability where shape variations increased with size, while postlarva were closer to each other than adults along the first axis of PCA (Guarneri et al., 2014).
There were only two distinct clusters of penaeid shrimp that were observed at 22.9% level of similarity. The difference between the populations of these clusters may have been due to local adaption as well as phenotypic plasticity (Hossain, Nahiduzzaman, Saha, Khanam, & Alam, 2010). Indeed, the environmental influence is of particular importance during the early development stages of penaeid shrimps (Vatandoust et al., 2014). Wangüemert et al. (2010)suggested that population differentiation can be driven by heterogeneity of spawning habitat or larvae retention both geographically as well as at more localized scales. The morphometric variations observed in our samples could also be due to different type of habitats (Corpuz, Camacho, & Ocampo, 2013) where the penaeid shrimps live or effects of genetic drift caused by intense fishing in the bay. The present study could not reject the hypothesis that low genetic variation in penaeid shrimp population of Malindi–Ungwana Bay has led to its population decline that threatens its evolutionary potential. We are further in agreement with results of M. monoceros from Mkare et al. (2014) that showed this species has a reduced genetic diversity due to fishing in the Malindi–Ungwana Bay.
Generally, the present study confirms that the variability among individual species within each population indicates the presence of high genetic diversity among the populations of different shrimps that give rise to genetically panmictic populations within the Malindi–Ungwana Bay. This study further suggests that the two separate populations of P. canaliculatus should be considered as unique evolutionary taxa for conservation. Our results indicated that M. monoceros populations bear a reduced genetic diversity in contrast to other wild penaeid species, likely due to the reduction of effective population size arising from fishing. Hence, this study recommends more research especially genetic studies using very sensitive genetic markers that are desirable to enrich our understanding of genetic variation in all penaeid species of commercial importance from Malindi–Ungwana Bay.
This research was supported by the National Council for Science and Technology (NACOSTI) of Kenya through the Corresponding author (Rashid M. Kaka) under the PhD program in association with the Graduate School of the University of Nairobi (Grant No. NCST/5/003/2nd CALL PhD/38). We also thank the South West Indian Ocean Fisheries Project (SWIOFP) under component 2 (Crustaceans) for supporting trawling survey in the shallow waters.
Anvarifar, H., Khyabani, A., Farahmand, H., Vatandoust, S., AnvariFar, H., & Jahageerdar, S. (2011). Detection of morphometric differentiation between isolated up- and downstream populations of Siah Mahi (Capoeta capoeta gracilis) (Pisces: Cyprinidae) in the Tajan River (Iran). Hydrobiologia, 673(1), 41–52.
View ArticleBagherian, A., & Rahmani, H. (2007). Morphological differentiation between two populations of the Shemaya, Chalcalburnus chalcoides: a geometrical morphometric approach. Zoology in the Middle East, 40(1), 53–62.
View ArticleBate, C. S. (1888). Report on the Crustacea Macrura Collected by H.M.S.Challenger During the Years 1873-76. Report on the Scientific Results ofthe Voyage of H.M.S. Challenger During the Years 1873-76 Under theCommand of Captain George S. Nares, R.N., F.R.S. and the Late Capt. Edinburgh: Neill and Company. Retrieved from
View ArticleBektas, Y., & Belduz, A. O. (2009). Morphological variation among atlantic horse mackerel, Trachurus trachurus populations from Turkish coastal waters. Journal of Animal and Veterinary Advances, 8(3), 511–517.
Chan, T. Y. (1998). In: Carpenter, K.E. and V.H. Niem (Eds). FAO Species Identification Guide For Fishery Purposes. The Living Marine Resources of the Western Central Pacific. Cephalopods, Crustaceans, Holothurians and Sharks. FAO, 2, 687–1396.
Corpuz, M. N. C., Camacho, M. V. C., & Ocampo, P. P. (2013). Morphometric and morphomeristic variations in five populations of indigenous Celebes goby Glossogobius celebius (Perciformes: Gobiidae) from Southern Luzon, Philippines. Philippine Agricultural Scientist, 96(1), 75–85.
Dall, W., Hill, B. J., Rothlisberg, P. C., & Sharples, D. J. (1990). The biology of the Penaeidae. In J.H.S. Blixter and A.J. Southward (Eds.). Advances in Marine Biology, 27, 1–489. Retrieved from
View ArticleDe Haan, W. (1844). Crustacea. In In: von Siebold, P.F., Fauna Japonica sive Descriptio Animalium, quae in Itinere per Japoniam, Jussu et Auspiciis Superiorum, qui Summum in India Batava Imperium Tenent, Suspecto, Annis 1823-1830 Collegit, Notis, Observationibus et Adumbrationibus Illustr (pp. 1–55). Lugduni-Batavorum. Retrieved from
View ArticleEdwards, H. M. (1837). Histoire naturelle des crustacées comprenant l’anatomie, la physiologie, et la classification de ces animaux (1834–1840), Vol 2. Librairie Encyclopedique de Roret. Paris. 80791-2
View ArticleFabricius, J. C. (1798). Joh. Christ. Fabricii hist. nat. oec. et cameral. p.p.o. societ. Hafn. ... Entomologia systematica : emendata et aucta, secundum classes, ordines, genera, species, adjectis synonimis, locis, observationibus, descriptionibus. Hafniae : impensis Christ. Gottl. Proft,. Retrieved from
View ArticleGuarneri, I., Popa, O. P., Gola, L., Kamburska, L., Lauceri, R., Lopes-Lima, M., … Riccardi, N. (2014). A morphometric and genetic comparison of Sinanodonta woodiana (Lea, 1834) populations: Does shape really matter? Aquatic Invasions, 9(2), 183–194.
View ArticleGunawickrama, K. B. S. (2007). Morphological heterogeneity and population differentiation in the green chromid Etroplus suratensis (Pisces : Cichlidae ) in Sri Lanka. Ruhuna Journal of Science, 2(September), 70–81.
Hossain, M. A. R., Nahiduzzaman, M., Saha, D., Khanam, M. U. H., & Alam, M. S. (2010). Landmark-Based Morphometric and Meristic Variations of the Endangered Carp, Kalibaus. Zoological Studies, 49(4), 556–563.
Jørgensen, H. B. H., Pertoldi, C., Hansen, M. M., Ruzzante, D. E., & Loeschcke, V. (2008). Genetic and environmental correlates of morphological variation in a marine fish: the case of Baltic Sea herring (Clupea harengus). Canadian Journal of Fisheries and Aquatic Sciences, 65(3), 389–400.
View ArticleKaka, R. M., Jung’a, J. O., Badamana, M., Ruwa, R. K., & Karisa, H. C. (2019). Morphometric length-weight relationships of wild penaeid shrimps in Malindi-Ungwana Bay: Implications to aquaculture development in Kenya. Egyptian Journal of Aquatic Research, 45(2), 167–173.
View ArticleKaouèche, M., Bahri-Sfar, L., Hammami, I., & Hassine, O. K. Ben. (2017). Morphometric variations in white seabream Diplodus sargus (Linneus, 1758) populations along the Tunisian coast. Oceanologia, 59(2), 129–138.
View ArticleKimani, E. N., Fulanda, B., Wambiji, N., Munga, C., Okemwa, G., Thoya, P., & Omukoto, J. (2012). Spatial Mapping of Trawl Fishery Resources of Malindi-Ungwana Bay, Kenya. SWIOFP Components 2 (Crustaceans). SWIOFP Survey Technical Report, (June), 28pp.
Lundqvist, A., Andersson, S., & Lonn, M. (2008). Genetic variation in wild plants and animals in Sweden: A review of case studies from the perspective of conservation genetics. Stockholm: Naturvårdsverket.
Mkare, T. K., Von Der Heyden, S., Groeneveld, J. C., & Matthee, C. A. (2014). Genetic population structure and recruitment patterns of three sympatric shallow-water penaeid prawns in Ungwana Bay, Kenya, with implication for fisheries management. Marine and Freshwater Research, 65(3), 255–266.
View ArticleMojekwu, T. O., & Anumudu, C. I. (2015). Advanced Techniques for Morphometric Analysis in Fish. Journal of Aquaculture Research & Development, 06(08), 6–11.
View ArticleOla-Oladimeji, F. A., Awodiran, M. O., Fagbuaro, O., & Akomolafe, A. O. (2016). Morphological characterization of wild and cultured Clarias gariepinus (Burchell 1822) using principal component and cluster analyses. Notulae Scientia Biologicae, 8(4), 428–436.
View ArticleOlivier, A. G. (1811). Palemon : Palaemon. Encyclopedie Methodique, Ou Par Ordre Des Matieres. Histoire Naturelle. Insectes, 8, 652–667. Retrieved from
View ArticleRajakumaran, P., Vaseeharan, B., & Yeshvadha, V. A. (2013). Molecular Characterization of Economically Important Penaeid Populations in South East Coast of India. International Journal of Aquaculture, 3(19), 105–114. . 03.0019
View ArticleReed, D. H., & Frankham, R. (2001). How Closely Correlated Are Molecular and Quantitative Measures of Genetic Variation? a Meta-Analysis How Closely Correlated Are Molecular and Quantitative Measures of Genetic Variation? a Meta-Analysis. Evolution, 55(6), 1095–1103.
Reist, J. D. (1985). An empirical evaluation of several univariate methods that adjust for size variation in morpometric data. Canadian Journal of Zoology, 63, 1429–1439.
Rice, W. R. (1989). Analyzing tables of statistical tests. Evolution, 43(1), 223–225.
Sani, A., Andy Omar, S. Bin, Trijuno, D. D., & Nugroho, E. (2017). Morphometric Characteristic of White Shrimp Fenneropenaeus merguiensis de Man 1888 in South Sulawesi Indonesia. International Journal of Sciences: Basic and Applied Research (IJSBAR), 33(2), 248–256.
Solomon, S. G., Okomoda, V. T., & Ogbenyikwu, A. I. (2015). Intraspecific morphological variation between cultured and wild Clarias gariepinus (Burchell) (Clariidae, Siluriformes). Archives of Polish Fisheries, 23(1), 53–61.
View ArticleTonks, M. L., Griffiths, S. P., Heales, D. S., Brewer, D. T., & Dell, Q. (2008). Species composition and temporal variation of prawn trawl bycatch in the Joseph Bonaparte Gulf, northwestern Australia. Fisheries Research, 89(3), 276–293.
View ArticleTuran, C. (1999). A Note on The Examination of Morphometric Differentiation Among Fish Populations : The Truss System, 23, 259–263.
Vatandoust, S., Abdoli, A., Anvarifar, H., & Mousavi-sabet, H. (2014). Morphometric and meristic characteristics and morphological differentiation among five populations of Brown Trout Salmo trutta fario (Pisces: Salmonidae) along the southern Caspian Sea basin. European Journal of Zoological Research, 3(2), 56–65.
Wangüemert, M. G., Cánovas, F., Ruzafa, A. P., Marcos, C., & Alexandrino, P. (2010). Connectivity patterns inferred from the genetic structure of white seabream (Diplodus sargus L.). Journal of Experimental Marine Biology and Ecology, 383(1), 23–31.
View Article