Journal of Earth Sciences & Environmental Studies

ISSN: 2472-6397

Impact Factor: 1.235

VOLUME: 6 ISSUE: 2

Page No: 162-168

Age Estimation of Uranium Ore Mineralization using Lead Isotopic Ratios as A Nuclear Forensic Tool


Affiliation

Heike Wanke2, Innocent Shuro3, Manny Mathuthu4, Naomi Mokhine4, Tebogo Gilbert Kupi4, 5

1 National Radiation Protection Authority of Namibia

 2 Department of Geography and Environmental Management, University of the West of England

3 Electron Microscope Laboratory, North-West University, Potchefstroom Campus, 11 Hoffman Street, Potchefstroom, 2531

4 Centre for Applied Radiation Science and Technology, North-West University, Mafikeng Campus, Corner of Albert Luthuli and University Drive, Mmabatho, 2745

5 Unit for Environmental Sciences and Management, North-West University, Potchefstroom Campus, 11 Hoffman Street, Potchefstroom, 2531

Citation

Heike Wanke, Innocent Shuro, Manny Mathuthu, Naomi Mokhine, Tebogo Gilbert Kupi, Age Estimation of Uranium Ore Mineralization using Lead Isotopic Ratios as A Nuclear Forensic Tool(2022) Journal of Earth Sciences & Environmental Studies 6(2) :162-168

Abstract

The study investigated the use of Pb isotope signatures as an indicative of origin assessment of uranium bearing ore mineralisation from the uranium province in Namibia. The objective of the study was to determine signatures of Pb from uranium ore mineralisation, identify as to the Pb present is geogenic and/or antrogenic and provided an estimate of the age of the uranium ore mineralisation from measured Pb isotope.

A total of 24 samples of uranium ore were collected from three mines and the lead isotopic ratios and age estimation signatures of the uranium ore mineralisation determined. Inductively Coupled Plasma Mass Spectrometer was employed for sample analysis. 206Pb was abundant in the ore samples and was determined to be geogenic and not anthropogenic. The estimated age of the uranium ore mineralisation was in the range documented for the Namibian Damara Orogen. The studied showed that lead isotopic ratios can provide an estimate of the age of the uranium ore mineralisation and aid as a fool in nuclear forensics.

Key words: Lead isotopic ratios, uranium ore mineralization, nuclear forensics, geochronology

Introduction

Nuclear forensics is defined  as the examination of nuclear or other radioactive material, or of evidence that is contaminated with radionuclides, in the context of legal proceedings under international or national law related to nuclear security [1].

Nuclear forensics requires the ability to determine characteristics or ‘signatures’ of nuclear and other radioactive materials. The term “signatures” describes material characteristics such as isotopic abundances, elemental concentrations, physical and chemical forms and physical dimensions that may be used to link a material, either nuclear or other radioactive (non-nuclear, such as those used for medical imaging), to individuals, locations, or processes, date of production and on the intended use [2, 3].

A nuclear material age is defined as the age of material at the time since the last separation of the progeny isotopes from the radioactive parent (uranium or plutonium), referred to as the production or sometimes separation date [4]. It is used to identify or eliminate possible contributors in the life of the material [5].

Age determination is an extremely useful nuclear forensic signature as it is non comparative or “predictive”, meaning, it does not need to be compared to other materials in the database [6]. The measured age is referred to as the “model” age as it relies on two primary assumptions: 1) complete separation of the progeny isotope from the parent at time zero (if the separation is incomplete, the calculated age or “model” age will be older than the true age) and 2) that the system is “closed”, i.e., no loss or gain of the parent or progeny other than through radioactive decay of the parent [4].

Uranium–lead (U-Pb) dating is a geochronological method that uses final decay products in the 238U and 235U radioactive decay chains to determine the length of time required to accumulate present amounts of stable daughter isotopes 206Pb and 207Pb respectively [7]. The abundance of uranium minerals in most rock types as well as the resistance of many of these minerals to chemical and physical weathering, contributes to the popularity and prolificacy (richness) of the U-Pb system [8].

The U-Pb method is the oldest of all the isotopic dating methods, with a  natural cross-check built into it that shows when nature has tampered with the evidence [9]. The U-Pb method also yields ages which are accurate [10].

The simultaneous decay of two isotopes of the same radioactive parent (U) to two isotopes of the same stable daughter (Pb) of the U-Pb method, provides for the U-Pb clock with an internal consistency check that is absent from most other geochronometers. This can be visualised by plotting the 206Pb/238U-ratio measurements against the 207Pb/235U-measurements on a ‘Wetherill Concordia’ diagram depicted in Figure 1 [11].

https://www.siftdesk.org/articles/images/10811/1.png

Figure 1: ‘Wetherill’ Concordia diagram showing concordant (filled symbols) and discordant (empty symbols) analyses affected by different degrees of Pb (or U) loss [12].

The Concordia diagram is a useful tool for investigating and interpreting disruptions of the U-Pb system caused by ‘episodic lead loss’. This means that a mineral (of age T) has lost a certain percentage of its radiogenic Pb at a time T1 after its formation (e.g., during metamorphism), after which the system closed again and further accumulation of radiogenic Pb proceeds normally until present. On the Concordia diagram of multiple aliquots of a sample, this scenario will manifest itself as a linear array of data points connecting the concordant 206Pb*/238U - 207Pb*/235U composition expected at T with that expected at T1. With time, the data shift further away from the origin. The upper intercept of the linear array (discordia line) can be used to estimate the crystallisation age, whereas the lower intercept yields the age of metamorphism. The greater the distance from the expected composition at T, the greater the degree of Pb loss and the greater the linear extrapolation error on the crystallisation age [12].

Lead has four naturally occurring stable isotopes, 204Pb, 206Pb, 207Pb, and 208Pb, of which the latter three have a radiogenic component produced through the independent decay of 238U, 235U, and 232Th as illustrated in Figure 1. Treating each of the three decay systems independently permits the construction of three separate age equations.

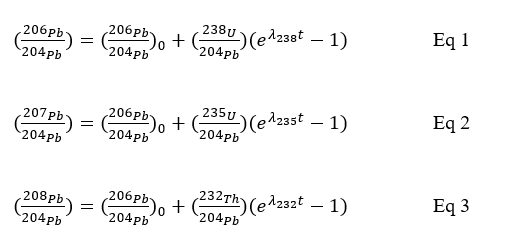
Assuming secular equilibrium at the time of system closure of the U–Th–Pb system, leads to the following classic isochron equations [8].

https://www.siftdesk.org/articles/images/10811/e1-e3.png

where, the subscript 0 follows the ratio of the isotopic composition of Pb when the system is closed (e.g., crystallization of a mineral), t is the time since the system closed, and λ238, λ235, and λ232 are the decay constants of 238U, 235U, and 232Th respectively.

A fourth isochron equation (Eq 4) can be construct by dividing Eq 2 by Eq 1, forming the Pb-Pb dating method. With the Pb-Pb method, there is no need to measure uranium and it is insensitive to recent loss of U and even Pb, because this would not affect the isotopic ratio of the Pb [12].

https://www.siftdesk.org/articles/images/10811/e4.png

Eq 4 can be used to calculate the age using a linear fitting in the 206Pb/204Pb – 207Pb/204Pb space. If initial Pb is negligible, then the measured (207Pb/206Pb)* can be used to calculate the age [8].

The age can be estimated through isochron, which is an approach that accommodates samples or minerals that incorporate both parent and daughter elements on crystallization. As a fundamental, all samples acquires the same initial isotopic composition at the same time [13]. A best-fit line for data from multiple cogenetic samples, determined by linear regression, provides a test of this condition. Isoplot takes isotopic data as input and produces publication-ready Figures as output [14] . Example is shown in Figure 2.

https://www.siftdesk.org/articles/images/10811/2.png

Figure 2: Example Pb-Pb isochron curve [14].

The ISOPLOT Geochemical CODE Vs 3.75 (Berkeley Labs, USA), a geochronological Toolkit for Microsoft Excel can be used to estimate the age of the uranium ore [14]. The software is used to construct U-Pb Concordia plots and calculate ages using conventional Concordia intercepts for radiogenic isotopic ratios. The system has various isochron programmes available for use, such as:

  • 207Pb-206Pb isochron: 206Pb/204Pb - 207Pb/204Pb (“Normal”) or 204Pb/206Pb - 207Pb/206Pb (“Inverse”) isochron’
  • 208Pb-206Pb isochron: 206Pb/204Pb - 208Pb/204Pb (“Normal”) or 208Pb/206Pb - 204Pb/206Pb (“Inverse”) regression
  • 238U-206Pb isochron: 238U/204Pb - 206Pb/204Pb (Normal) or 204Pb/206Pb - 238U/206Pb (Inverse) isochron.
  • 235U-207Pb isochron: 235U/204Pb - 207Pb/204Pb (Normal) or 204Pb/207P b - 235U/207Pb (Inverse) isochron.
  • 232Th-208Pb isochron: 232Th/204Pb - 208Pb/204Pb (Normal) or 204Pb/208Pb - 232Th/208Pb (Inverse) isochron.


The objectives of this study were to demonstrate the suitability of lead isotope based uranium ore mineralisation as nuclear forensic tool; determination as to whether the Pb isotopic signatures are due to antropogenic and/or geogenic; provide an estimate of the uranium ore mineralisation and to compare the estimated age to published data.

Materials & Methods

24 crushed uranium ore samples were collected from the uranium mines and packaged in 0.50 kg polyethylene bags. About 0.5 g of each sample was digested in an acid mixture consisting of 9 mL of 37% of hydrochloric acid and 3 mL of 55% of nitric acid in standard 75ml high pressure digestion vessels. The mixture was digested according to the manufacturers instruction at temperature 160oC and for 30 min [15]. A control reagent blank (without sample) of the same mixture of nitric and hydrochloric acids have been digested at the same time. After digestion, each aliquot was transferred to a 50 ml sample bottle and diluted with deionized water. The solution was allowed to stand for 24 hours before analysis After which 3 mL of the prepared 50 mL solution was transferred to 10 mL ICP-MS analysis sample holder containers.

Samples analyses were performed with Perkin Elmer ICP-MS NexION 2000C. The instrument was optimized using the automated SmartTune™ procedure prior to measurements. A 10 mg/L Perkin Elmer multi element calibration standard was used as a reference material.

The ISOPLOT a geochronological Toolkit for Microsoft Excel was applied to estimate the age of the uranium ore mineralisation. The 207Pb-206Pb isochron ‘206Pb/204Pb - 207Pb/204Pb (“Normal”) using the measured lead isotopic ratio results from the ICP-MS using Eq 4 adopted by Schoene (2014) was used.

Results

3.1 Lead Isotopic ratio

The lead isotopic ratios were determined for the uranium ore and the mean measured isotopic compositions of lead isotopes in the samples are presented in Table 1. Table 2 shows the mean isotope ratio as a function of 206Pb and measured NIST SRM 981 standards are also given for quality control.

Table 1. Average measured Pb isotopic ratio

Mine ID

Isotope Ratio

204Pb

206Pb

207Pb

208Pb

Sum Pb

M1

0.0153

0.3891

0.1739

0.4217

1.0000

M2

0.0023

0.8198

0.0678

0.1101

1.0000

M3

0.0035

0.7660

0.0866

0.1439

1.0000


Table 2: Mean Pb isotopic ratio for the uranium bearing materials from Namibian uranium mines

Samples

204Pb/206Pb ± SE

(min-max)

207Pb/206Pb ± SE

(min-max)

208Pb/206Pb ± SE

(min-max)

M1 Ore

0.0396 ± 0.0012

(0.0299 - 0.0434)

0.4477 ± 0.0076

(0.3821 - 0.4620)

1.0858 ± 0.0196

(0.9160 - 1.1284)

M2 Ore

0.0028 ± 0.0001

(0.0024 - 0.0034)

0.0827±0.0007

(0.0786 - 0.0848)

0.1344 ± 0.0023

(0.1197 - 0.1398)

M3 Ore

0.0047 ± 0.0008

(0.0021 - 0.0084)

0.1153 ± 0.0115

(0.0819 - 0.1738)

0.1944 ± 0.0336

(0.0982 - 0.3708)

Measured NIST SRM 981 (This study)

0.0589 ± 0.0001

0.9144 ± 0.0036

2.1706 ±0.0013

Certified NIST SRM 981

0.0590 ± 0.00004

0.9146 ± 0.0003

2.1681 ± 0.0008

The measured NIST SRM 981 values shown in Table 3.2 in good agreement with the certified NIST SRM981values as the percentage difference was less than 0.02%.

The mean 204Pb/206Pb, 207Pb/206Pb and 208Pb/206Pb ratios were highest in the M1 ore. The abundance of 206Pb was higher than that of the non-radiogenic Pb (204Pb), yielding a ratio of less than 1.00 in most samples with the exception of 208Pb/206Pb ratio for M1 ore. The abundance of 206Pb is expected from uranium rich mineralization to have substantial amounts of radiogenic lead as there is a relatively more 206 Pb produced than 207Pb due to the ratio of the two parents, namely 235U and 238U. As a consequence, uranium rich mineralisation have low 204Pb/206Pb, 207Pb/206Pb and 208Pb/206Pb ratios compared to Th rich mineralisation that displays higher 208Pb/207Pb ratios as 208Pb is produced from decay of 232Th [16, 17].

https://www.siftdesk.org/articles/images/10811/3.png

Figure 3: The Mines ore samples 206Pb/204Pb ratio

Figure 3 depict the plot of the 206Pb/204Pb ratio for the ore samples. The ratio ranged between 23 -33, 308 - 411 and 18 - 477 for the M1, M2 and M3 ore samples. The variation of Pb isotopic ratio is a result of inhomogeneity composition of Pb isotopic composition within the ore body. Varga et al. (2009) reported variability of the 206Pb/204Pb, 207Pb/204Pb and 208Pb/204Pb ratios between samples from different origin of several orders of magnitude.

The ratios 206Pb/204Pb and 206Pb/207Pb can provide an indication as to whether the mineralisation is a Pb rich deposit or otherwise. The 206Pb/204Pb ratio less than 20 indicates a rich Pb deposit, whilst a ratio greater than 20 implies that the Pb in the sample may be attributed from the uranium-bearing phases, such as zircon, monazite, and apatite [18]. This ratio was greater than 20 for ore samples of the study as is shown in Figure 3. An indication that the samples are not Pb rich deposit.

The mean 206Pb/207Pb isotope ratios for the M1, M2 and M3 ore samples of the study were 2.24, 12.10 and 8.84 respectively. A value above 1.12 distinguishes anthropogenic Pb from geogenic Pb [19]. The Pb presence in the ore samples the samples from the study was determined as of geogenic.

3.2 Ore Mineralisation Age Estimation

Age of the uranium ore mineralisation was estimated using the 207Pb/204Pb - 206Pb/204Pb Concordia in Microsoft ISOPLOT and is depicted in Figures 4-6.

The age aspect for the uranium ore from the M1, M2 and M3 were estimated at 653 ±69 Ma, 799 ±42 Ma and 351 ±46 Ma, respectively.

Age estimation from the different uranium ore mineralisation vary, however M2 and M3 estimated age was noted to be in good agreement with the values reported by previous scholars. The Swakop Group Granite age ranged at  600 - 750 Ma [20], to 509 Ma [21], while the Damara Belt was found to be of 510 - 780 Ma [22]. The variation in the age estimate is due to several  ways available to calculate the age from the lead-thorium-uranium system as the mineralisation was disturbed after formation, resulting in losing Pb or some other occurrences that could have altered the elemental composition [23]. The shift of the host strata to deep zones of the crust with high temperatures are sufficient to remove radiogenic lead from uranium mineralization and this could have contributed to the variation in the age estimation [24].

The estimated age of the M3 is 187Ma younger than that of M1. This could be due to possible contamination of the samples.

https://www.siftdesk.org/articles/images/10811/4.png

Figure 4: The Pb-Pb Isochron plot of M1

https://www.siftdesk.org/articles/images/10811/5.png

Figure 5: The Pb-Pb isochron plot of M2

https://www.siftdesk.org/articles/images/10811/6.png

Figure 6: The Pb-Pb Isochron plot of M3


Conclusion

The lead isotopic ratio of uranium ore sample was determined using the ICP-MS. The Pb isotopic ratio was used to estimate the age of the uranium ore using the Microsoft ISOPLOT geochronological tool. The 206Pb was abundant in the ore and was determined to be geogenic and not antropogenic. The study demonstrated that lead isotopic ratio can be used as a means for age estimation and thus aid in the nuclear forensic process as a fingerprinting method.

Acknowledgement

Funding

Authors acknowledge the financial assistance provided by the International Atomic Energy Agency [research grant no. CRP2300].

Conflict of Interest

The authors declare that they have no conflicts of interest.

References

  1. IAEA, Nuclear Forensics in Support of Investigations, IAEA Nuclear Security Series No. 2-G (Rev.1). 2015: Vienna, Austria.

  2. Mayer, K., M. Wallenius, and Z. Varga, Interviewing a Silent (Radioactive) Witness through Nuclear Forensic Analysis. Anal Chem, 2015. 87(23): p. 11605-10. PMid:26376028

    View Article      PubMed/NCBI     
  3. Boulyga, S.F., et al., Development, validation and verification of an ICP-MS procedure for a multi-element analysis of uranium ore concentrates. J. Anal. At. Spectrom.,, 2017. 22.

    View Article           
  4. Keegan, E., et al., Nuclear Forensics: Scientific Analysis Supporting Law Enforcement and Nuclear Security Investigations. Anal Chem, 2016. 88(3): p. 1496-505. PMid:26703823

    View Article      PubMed/NCBI     
  5. Stanley, F.E., A.M. Stalcup, and H.B. Spitz, A brief introduction to analytical methods in nuclear forensics. Journal of Radioanalytical and Nuclear Chemistry, 2012. 295(2): p. 1385-1393.

    View Article           
  6. Kristo, M.J., et al., Nuclear Forensic Science: Analysis of Nuclear Material Out of Regulatory Control. Annual Review of Earth and Planetary Sciences, 2016. 44(1): p. 555-579.

    View Article           
  7. Neymark, L., Uranium-Lead Dating, Opal, in Encyclopedia of Scientific Dating Methods. 2014. p. 1-9.

    View Article           
  8. Schoene, B., U-Th-Pb Geochronology, in Treatise on Geochemistry. 2014. p. 341-378.

    View Article           
  9. Alden, A. Uranium-Lead dating. 2019 [cited 2020 30 April]; Available from: .

    View Article           
  10. Sanders, R. Uranium/lead dating provides most accurate date yet for Earth's largest extinction. 2004 [cited 2017 25 November];

    View Article           
  11. Vermeesch, P., IsoplotR: A free and open toolbox for geochronology. Geoscience Frontiers, 2018. 9(5): p. 1479-1493.

    View Article           
  12. Vermeesch, P., Part I: Radiometric Geochronology, in Isotope Geology. 2017, Cambridge University Press: Cambridge.

  13. Stein, H.J., Dating and Tracing the History of Ore Formation, in Treatise on Geochemistry. 2014. p. 87-118. PMid:24054721

    View Article      PubMed/NCBI     
  14. Ludwig, K.R., User manual for Isoplot 3.70 a Geochronological tool Tool for Microsoft Excel. 2012: 2455 Ridge Road, Berkeley CA 94709.

  15. PerkinElmer. Titan MPS customer user guide. 2017;

    View Article           
  16. Bollhöfer, A. and P. Martin, Radioactive and radiogenic isotopes in Ngarradj (Swift Creek) sediments: A baseline study. 2003: Australia.

  17. Quirt, D. and A. Benedicto, Lead Isotopes in Exploration for Basement-Hosted Structurally Controlled Unconformity-Related Uranium Deposits: Kiggavik Project (Nunavut, Canada). Minerals, 2020. 10(6).

    View Article           
  18. Bellucci, J.J., et al., Lead Isotopic Composition of Trinitite Melt Glass: Evidence for the Presence of Canadian Industrial Lead in the First Atomic Weapon Test. Analytical Chemistry, 2013. 85(15): p. 7588-7593. PMid:23829180

    View Article      PubMed/NCBI     
  19. Vecchia, A.M.D., et al., Investigations into Pb isotope signatures in groundwater and sediments in a uranium‑mineralized area. Brazilian Journal of Geology, 2017. 47(1): p. 147-158.

    View Article           
  20. Miller, R.M., The Early Neoproterozoic Rocks. In: The geology of Namibia. Ministry of Mines and Energy, Geological Survey of Namibia, 2008. 2.

  21. Bowden, P., D. Herd, and J.A. Kinnaird, The significance of Uranium and Thorium concentrations in pegmatitic leucogranites (alaskites), Rössing Mine, Swakopmund, Namibia. Communs geol. Surv. Namibia, 10 (1995), 1995. 10: p. 43-49.

  22. Gray, D.R., et al., A Damara orogen perspective on the assembly of southwestern Gondwana. Geological Society, London, Special Publications, 2008. 294(1): p. 257-278.

    View Article           
  23. Fahey, A.J., et al., The use of lead isotopic abundances in trace uranium samples for nuclear forensics analysis. Journal of Radioanalytical and Nuclear Chemistry, 2010. 284(3): p. 575-581.

    View Article           
  24. Tugarinov, A.I., E.V. Bibikova, and S.I. Zykov, Metamorphism of uranium deposits and individual uranium minerals. Soviet Atomic Energy, 1964. 16(4): p. 404-415.

    View Article           

Journal Recent Articles