Oghenekaro Omodior
Tel: +1-812-856-7031;Fax: 812-855-3998
Email: oomodior@indiana.edu
© 2019 Sift Desk Journals. All Rights Reserved
VOLUME: 5 ISSUE: 3
Page No: 83-89
Oghenekaro Omodior
Tel: +1-812-856-7031;Fax: 812-855-3998
Email: oomodior@indiana.edu
Oghenekaro Omodior1, *, PhD., MPH
Nicholas Kaukis2, PhD
1Department of Health & Wellness Design, Indiana University School of Public Health, Bloomington, Indiana, USA
2Fay W. Boozman College of Public Health, University of Arkansas for Medical Sciences, Little Rock, Arkansas, USA
O. Omodior, N. Kaukis, Variations in tick-borne disease incidence rate by rural-urban county classification (2020) Journal of Earth Sciences & Environmental Studies 5(3) pp:83-89
Background: Surveillance data of tick-borne disease (TBD) incidence in the United States are compiled at the county level, yet few studies have classified TBD risk using established county classification systems.
Objective: Determine if significant differences in TBD incidence rates exist between Indiana counties based on population size classification (i.e. urban, rural, and rural-mixed).
Methods: County TBD data for the period 2009 to 2016, were obtained from the Epidemiology Resource Center at the Indiana State Department of Health. Using the 2010 decennial population census, we normalized TBD counts to derive incidence rates per 1,000 population. We classified Indiana counties as either rural, rural-mixed, or urban based on population size. We used Kruskal-Wallis nonparametric test to determine if median TBD incidence rates differed between urban, rural, and rural-mixed urban counties. We used choropleth maps in ESRI ArcGIS to display TBD incidence rate by county classification.
Results: Kolmogorov-Smirnov pairwise comparisons test results, revealed no evidence of a difference in TBD incidence rates between rural, rural-mixed, and urban counties (p≥ 0.1208 ± 0.0065). Furthermore, Kruskal-Wallis test showed no evidence of a difference in the median TBD incidence rates by county classification (p = 0.9754). Higher TBD incidence rate counties occur in the western region, while lower rate counties occur in the eastern region. Although no differences exist in incidence rates by county classification, the two highest incidence rates were recorded in rural counties.
Conclusion: A classification of Indiana counties based on population size is inadequate in identifying counties with a greater or lesser risk of TBD incidence. For a better understanding of county population-level TBD risk, future studies should aim at obtaining and exploring TBD incidence data at more granular, sub-county population levels such as zip codes, census- blocks and tracts.
Within the past 2 decades tick-borne disease (TBD) incidence rates in the United States (U.S.) have seen an upward trend. [2] Beyond the rise in reported cases, the health, economic, social, and community impacts of tick-borne diseases are significantly high. [3-5] The bite of an infected tick is the single biggest risk factor for TBD diagnosis, and this is significantly associated human exposure to ticks either at residential, recreational or occupational environments. [6-8] Previous studies have shown that the risk factors for tick exposure and TBD include gender as male, older adults, pet ownership, residential or occupational exposure to tick habitat. [9-11] Given that these risk factors are not static, it is important to understand how they vary across spatial locations. This is critical for developing location-specific risk-reduction policies and interventions.
For the most part, surveillance data of TBD incidence in the U.S. are compiled at the county level, with limited information provided at individual case levels. [12] Under this scenario, we need to determine whether unique risk factors are present in some counties, thereby predisposing such counties to higher TBD incidence rates. Across the U.S. counties have been variously classified as urban or rural depending on population size, administrative boundaries, land-use patterns, economic influence, and subjective opinions of ‘county identify’. [1, 13-15] For TBD risk assessment, it is important to select a classification system that groups counties based on the presence or absence of the most obvious risk factors for tick exposure. [9, 16, 17] Previous studies of TBD incidence have mostly focused on individual risk factors, which do not match up existing county-based data aggregates. [11, 18, 19] Conversely, studies which have looked at county-level TBD risk were primarily focused on the geographic expansion, or severity of disease. [20, 21] These studies are limited in the sense that they do not match existing county-level data with local risk. From a population health perspective, county or community level factors are important in the assessment of TBD risk. Particularly, in Indiana where spatial clustering of TBD has previously been reported, it is important to understand how TBD incidence rate vary based on county classifications. [10] Using a modified Ayres, Waldorf [1] Indiana county classification, the objective of this study is to determine if significant differences in tick-borne diseases incidence rates exist across counties in Indiana, U.S. Such information can inform policy, evidence-based interventions, and future research. Our primary hypothesis is that no significant differences in tick-borne diseases incidence rates exist between rural, rural-mixed, and urban counties of Indiana.
The count of Lyme disease, Ehrlichiosis, Rocky Mountain spotted fever, Tularemia, Typhus/Rickettsial disease cases for the period 2009 to 2016, were obtained from the Epidemiology Resource Center at the Indiana Department of Health, for all 92 counties in Indiana. Counties without TBD data were coded as ‘Nil’ for the purpose of analysis. First, we collapsed all TBD count data by county for the entire period to derive a “total TBD” count. Next, using the 2010 decennial population census of Indiana counties, we normalized TBD counts and derived TBD incidence rates per 1,000 population. [22] We classified Indiana counties as either rural, rural-mixed, or urban, using a modified Indiana county classification system of Ayres, Waldorf [1] (thus: < 40,000 population = “rural county”; 40,000 – 100,000 population = “rural-mixed county”, and > 100,000 population = “urban county”). This resulted in 56 (61%) rural counties, 19 (21%) rural-Mixed counties, and 17 (18%) urban counties. The difference in TBD incidence rate between these three county classifications were assessed.
We used summary statistics (mean, standard deviation, median, and skewness) to describe TBD incidence rate. Initial examination revealed that TBD incidence rate was highly right-skewed (mean = 0.313, median = 0.116, mode = 0). For this reason, we applied a log and square root transformation to see if normality of the data could be achieved, so that parametric methods of statistical inference are applied. The presence of zeroes in the data required an adjustment to the log transformation.
The transformations did moderate the skew, however no transformations were found to alleviate the issue of non-normality (Shapiro-Wilk test, p ≤ 0.0004). For this reason, we used Kruskal-Wallis nonparametric test to determine if median TBD incidence rates differed between urban, rural, and rural-mixed urban counties. Given the presence of ties in the data, we used a permutation version of the Kolmogorov-Smirnov test with 10,000 permutations to test the main assumption of the Kruskal-Wallis test (i.e. shape of the distribution for each group is the same). We centered TBD incidence rates for each county classification on its median so that all groups shared a median of zero. We created choropleth maps using natural breaks classification in ESRI ArcGIS to display the total TBD incidence rate, first across all Indiana counties (unclassified), followed by rates by county classification. Finally, we used a side-by-side box plot to determine the relative dispersion of TBD incidence rates across the 3 county classifications.
Indiana TBD incidence rate summary statistics by county classification for the period under investigation are as follows; urban county (mean = 0.52, S.D. = 1.37, median = 0.09), rural county (mean = 0.28, S.D. = 0.37, median = 0.12), and rural-mixed county (mean = 0.23, S.D. = 0.27, median = 0.12). Kolmogorov-Smirnov pairwise comparisons test results, revealed no evidence of a difference in TBD incidence rates between rural, rural-mixed, and urban counties (p ≥ 0.1208 ± 0.0065). Furthermore, Kruskal-Wallis test showed no evidence of a difference in the median TBD incidence rates by county classification (p = 0.9754).
In figure 1, normalized TBD incidence rates are displayed by means of graduated colors, with deeper colors denoting higher incidence rates. As seen in the figure, there is an apparent difference in TBD incidence rates between Western and Eastern counties in Indiana. More specifically, higher rate counties occur in the western region, while lower rate counties occur in the eastern region. Additionally, the eastern region has several more counties with a zero TBD incidence rate. The second worthwhile characteristic of note is that within the southwestern region, there is a cluster of higher rate counties that distinguishes itself from a similar cluster of higher rate counties in the northwestern region.
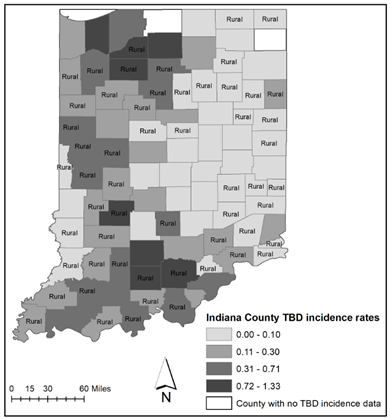
Fig 1. Indiana County tick-borne disease incidence rate per 1000 population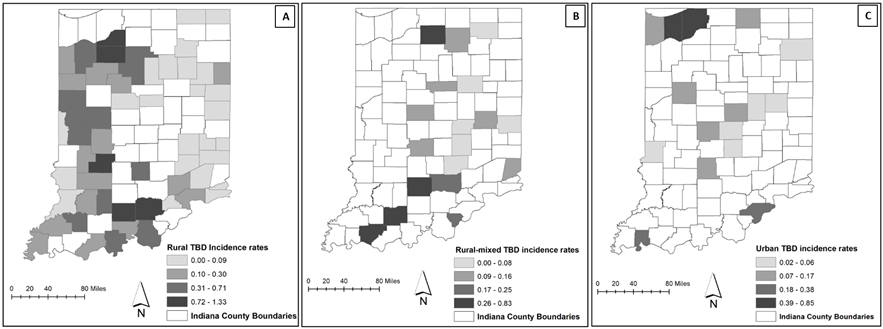
Fig 2. A = Rural counties (n = 56), B = rural-mixed counties (n = 18), and C = urban counties (n = 16). Two Indiana counties (1 rural-mixed and urban respectively) had no TBD incidence data.
Figure 3 represents a side-by-side boxplot of TBD incidence rate for the rural-mixed, rural, and urban counties. As seen in the figure, the boxplots in general have the same relative dispersion and center, though rural counties seem to have a somewhat larger relative dispersion. The Fligner-Killeen test for homogeneity of variances revealed weak evidence of heterogeneity (p = 0.0658). [23]
In figure 2, the TBD incidence rate is also displayed by means of graduated color for each of the 3 county classification, with deeper colors denoting higher TBD incidence rate. Higher rates are visible in the northern and southern regions for each county classification category. Although no differences exist in incidence rates by county classification, we observed that the two highest incidence rates appear to be found in rural counties.
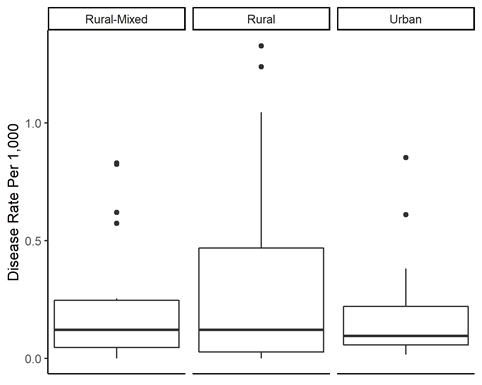
Fig 3. Side-by-side boxplot of TBD incidence rates by Indiana county classification.
Analyzing data of county-level tick-borne disease incidence provide an opportunity for population-level risk assessment, which is important for efficient resource allocation in public health promotion. [24] Our goal in this study was to determine if significant differences in tick-borne disease incidence rates in Indiana, existed based on rural-mixed, rural, and urban county classifications. Our summary statistics revealed important regional differences in TBD diagnosis prevalence rates. More specifically more counties in western Indiana had higher TBD incidence rates compared to eastern Indiana, eastern region had more counties with zero TBD incidence rate, and a cluster of higher TBD diagnosis prevalence rates occurred within the southwestern and northwestern regions. When tick-borne disease incidence rates were mapped by county classification, we noted higher rates in rural counties. However, given that there are almost three times as many counties classified as rural, compared to rural-mixed or urban, it is quite possible and perhaps should be expected that by chance, the higher TBD incidence rate counties are rural. However, when Indiana counties are classified based on population size (i.e. rural-mixed, rural, and urban), we found that tick-borne disease incidence rates are not significantly different. In a previous study we reported the presence of spatial clusters of self-reported TBD diagnosis in both the Southeast and Southwest of Indiana. [10] Viewed in the light of previous studies, the main contribution of the current is that while certain Indiana counties have a higher risk of TBD incidence, creating county categories based on population (rural-mixed, rural, and urban) is unable to detect Indiana counties with a higher risk of TBD incidence.
Several reasons may account for these findings. First, is the county classification system. Several scholars have noted the limitations associated with classifying rural counties, given that all counties contain a mix of rural and urban areas. [25, 26]. Secondly, because of the few cases for different tick-borne disease reported, it was necessary to aggregate all tick-borne disease data. So, while all tick-borne disease incidence rate was not significantly different using the current county classification system, we may have missed the ability to capture differences in specific disease incidence (e.g. Lyme disease, Anaplasmosis, etc.) if such existed. Thirdly, across the U.S. and Indiana, rural populations in general live in closer proximity to tick habitat and significantly have limited access to health care compared to their urban counterparts, a phenomenon that may impact TBD incidence reporting. [27, 28] Coupled with the voluntary nature of disease reporting, it is possible that tick-borne disease incidence rates for rural counties are under reported. [29] Under such conditions, the current findings may not accurately reflect counties with greater risk of tick-borne disease incidence. Finally, sub-county level risk factors which are not adequately captured in the county classification system used in this study may account for differences in tick-borne diseases incidence rates. Such sub-county level differences include incidence rates that might exist at the census- block or tract, or in more rural and/or urban sections of the county. And because county-level TBD data does not indicate sub-level data sources and/or differences in TBD incidence rate we are unable to determine if clusters of high tick-borne disease incidence arise from sub-county level differences.
Despite these limitations, it is important to emphasize that there are several benefits to assessing TBD incidence risk at the county level. First, this is the most common and accessible level of data collection. Secondly, many policy decisions are implemented at the county level, thus identifying Indiana counties with higher TBD incidence risk helps in identifying where people are most at risk.
Implications for Policy & Practice
As human populations continue to increase both in number and mobility, more people will reside, work, and recreate in tick-infested habitats. As changing environments favor tick range expansion, density and likelihood of human contact, we expect to see increasing incidence of tick-borne diseases. Therefore, it is critical to understand population level risk indicators. Our study results have demonstrated that currently, a classification of Indiana counties based on population is inadequate in identifying counties with a greater or lesser risk of tick-borne disease incidence. This should warrant further investigation of other population level risk indicators. We recommend that for a better understanding of county population-level TBD risk, future studies can aim at obtaining TBD incidence data at more granular, sub-county population levels such as zip codes, census- blocks and tracts. Other sub-county level population data that could better delineate areas of focus include obtaining data of tick-borne disease incidence among people who work or reside in tick infested habitats. Efforts should be made by the relevant state health departments to make tick-borne disease incidence data available at sub-county levels upon request. Making data available at levels such as census block, census tract or zip code will allow researchers to query tick-borne disease incidence at various spatial scales.
We gratefully acknowledge the assistance of the following members of the Indiana State Department of Health, Epidemiology Resource Center for their help with data acquisition: Dr. Jen Brown, Taryn Stevens, Hilari Sautbine, and Eric Hawkins.
Ayres, J., et al., Defining rural Indiana-The first step. Purdue Center for Rural Development EC-766-W, 2012.
U.S. Centers for Disease Control and Prevention. Tickborne Disease Surveillance Data Summary. 2019 [cited 2019 December, 08];
View ArticleAdrion, E.R., et al., Health care costs, utilization and patterns of care following Lyme disease. PloS one, 2015. 10(2): p. e0116767. PMid:25650808
View Article PubMed/NCBIMaes, E., P. Lecomte, and N. Ray, A cost-of-illness study of Lyme disease in the United States. Clinical therapeutics, 1998. 20(5): p. 993-1008. 80081-7
View ArticleSigal, L.H., The Lyme disease controversy: social and financial costs of misdiagnosis and mismanagement. Archives of Internal Medicine, 1996. 156(14): p. 1493-1500. PMid:8687256
View Article PubMed/NCBIStafford, K.C., et al., Temporal correlations between tick abundance and prevalence of ticks infected with Borrelia burgdorferi and increasing incidence of Lyme disease. Journal of clinical microbiology, 1998. 36(5): p. 1240-1244. PMid:9574684
View Article PubMed/NCBIDonohoe, H., O. Omodior, and J. Roe, Tick-borne disease occupational risks and behaviors of Florida Fish, Wildlife, and Parks Service employees-a health belief model perspective. Journal of outdoor recreation and tourism, 2018. 22: p. 9-17.
View ArticleSanchez, J.L., et al., A cluster of tick-borne infections: association with military training and asymptomatic infections due to Rickettsia rickettsii. Transactions of the Royal Society of Tropical Medicine and Hygiene, 1992. 86(3): p. 321-325. 90330-F
View ArticleOmodior, O., S. Kianersi, and M. Luetke, Prevalence of Risk and Protective Factors for Tick Exposure and Tick-Borne Disease Among Residents of Indiana. Journal of public health management and practice: JPHMP, 2019. PMid:31663930
View Article PubMed/NCBIOmodior, O., S. Kianersi, and M. Luetke, Spatial Clusters and Non-spatial Predictors of Tick-Borne Disease Diagnosis in Indiana. J Community Health, 2019. PMid:31270657
View Article PubMed/NCBISteere, A.C., et al., An epidemic of oligoarticular arthritis in children and adults in three Connecticut communities. Arthritis & Rheumatism: Official Journal of the American College of Rheumatology, 1977. 20(1): p. 7-17. PMid:836338
View Article PubMed/NCBIU.S. Centers for Disease Control and Prevention. Understanding Weekly and Annual National Notifiable Diseases Surveillance System WONDER Tables. 2016 [cited 2020 February 17];
View ArticleU.S. Census Bureau. 2010 Census Urban and Rural Classification and Urban Area Criteria. 2019 [cited 2020 April 07];
View ArticleU.S. Department of Agriculture [USDA]. Rural Classifications. 2019 [cited 2020 April 07];
View ArticleU.S. Centers for Disease Control and Prevention. NCHS Urban-Rural Classification Scheme for Counties. 2017 [cited 2020 April 07];
View ArticleSchulze, T.L., et al., Lyme disease: a proposed ecological index to assess areas of risk in the northeastern United States. American journal of public health, 1991. 81(6): p. 714-718. PMid:2029039
View Article PubMed/NCBIKilpatrick, H.J., A.M. Labonte, and K.C. Stafford III, The relationship between deer density, tick abundance, and human cases of Lyme disease in a residential community. Journal of Medical Entomology, 2014. 51(4): p. 777-784. PMid:25118409
View Article PubMed/NCBIFalco, R.C. and D. Fish, Prevalence of Ixodes dammini near the homes of Lyme disease patients in Westchester County, New York. American Journal of Epidemiology, 1988. 127(4): p. 826-830. PMid:3354547
View Article PubMed/NCBIHerrington, J.E., Risk perceptions regarding ticks and Lyme disease: a national survey. American journal of preventive medicine, 2004. 26(2): p. 135-140. PMid:14751325
View Article PubMed/NCBIKugeler, K.J., et al., Geographic distribution and expansion of human Lyme Disease, United States. Emerging infectious diseases, 2015. 21(8): p. 1455-1457. PMid:26196670
View Article PubMed/NCBIAdjemian, J.Z., et al., Spatial clustering by disease severity among reported Rocky Mountain spotted fever cases in the United States, 2001-2005. The American journal of tropical medicine and hygiene, 2009. 80(1): p. 72-77. PMid:19141843
View Article PubMed/NCBIU.S. Census Bureau. Indiana Counties by Population. 2019 [cited 2019 August, 21];
View ArticleFligner, M.A. and T.J. Killeen, Distribution-free two-sample tests for scale. Journal of the American Statistical Association, 1976. 71(353): p. 210-213.
View ArticleU.S. Centers for Disease Control and Prevention. Notifiable Infectious Diseases and Conditions Data Tables. 2018 [cited 2020 February 07];
View ArticleCromartie, J. and S. Bucholtz, Defining the" rural" in rural America. 2008.
Isserman, A.M., In the national interest: Defining rural and urban correctly in research and public policy. International regional science review, 2005. 28(4): p. 465-499.
View ArticleDouthit, N., et al., Exposing some important barriers to health care access in the rural USA. Public health, 2015. 129(6): p. 611-620. PMid:26025176
View Article PubMed/NCBIUnal, E., S.E. Chen, and B.S. Waldorf, Spatial accessibility of health care in Indiana. 2007.
Mead, P.S., Epidemiology of Lyme disease. Infectious Disease Clinics, 2015. 29(2): p. 187-210. PMid:25999219
View Article PubMed/NCBI