Mamadou Guy-Richard Koné
Email: guyrichardkone@gmail.com
© 2019 Sift Desk Journals. All Rights Reserved
VOLUME: 2 ISSUE: 2
Page No: 142-150
Mamadou Guy-Richard Koné
Email: guyrichardkone@gmail.com
1Jean Stéphane N’dri, 1*Mamadou Guy-Richard Koné, 1,2Charles Guillaume Kodjo, 3Ahmont Landry Claude Kablan, 1Lamoussa Ouattara, 1Ouanlo Ouattara, 1Nahossé ZIAO
1Laboratoire de Thermodynamique et de Physico-Chimie du Milieu, UFR SFA, Université Nangui Abrogoua 02 BP 801 Abidjan 02, Côte-d’Ivoire,
2Laboratoire de Chimie BioOrganique et de Substances Naturelles, Université Nangui Abrogoua, UFR-SFA, 02 B.P. 801 Abidjan 02 Côte-d’Ivoire,
3UFR des Sciences Biologiques, Université Péléforo Gon Coulibaly de Korhogo, BP 1328 Korhogo, Côte d’Ivoire
Aravinda Pai(aravind.pai@manipal.edu)
Dragos Horvath(dhorvath@unistra.fr)
Vesna Rastija(vrastija@pfos.hr)
Yong Liang(yliang@must.edu.mo)
J. S. N
This QSAR study was conducted by using a series of Azetidinones which belong to Dapsone derivatives. It allowed to obtain two different models according to the molecular descriptors and the antibacterial activities (Bacillus subtilis and Pseudomonas aeruginosa). The molecular descriptors were obtained by applying the methods of quantum chemistry at the B3LYP/6-31G (d) level. The different statistical indicators of the first model which are as a function of the Bacillus subtilis activity are the coefficient of determination R2 = 0.945, the standard error of the regression S = 0.139, the Statistical significance of regression, Fisher F-test F = 94.315 and the cross-validation correlation coefficient Q2cv=0.942. Those of the second model linked to the activity of Pseudomonas aeruginosa are the regression coefficient R2 = 0.933, the standard deviation S=0.135, the Statistical significance of regression, Fisher F-test F = 46.582 and the cross-validation coefficient Q2cv= 0.928. So these models have good statistical performances. The quantum descriptors of electrophilic index (ω), electronic energy (ε0) and dipole moment (μ) are responsible of the antibacterial activity of the Azetidinones derived from Dapsone. Moreover, the index of electrophilic is the first descriptor in terms of priority for the prediction of the antibacterial activity of the studied compounds. The Eriksson et al. acceptance criteria used for the test set are verified. External validation sets also verified all the Tropsha et al. criteria.
Diamino-Diphenyl sulfone or DDS (Dapsone) is a biologically active sulfone (bacteriostatic) used in the treatment of leprosy. However, nowadays Dapsone presents many undesirable effects such as cutaneous, neurological and psychiatric infections. It shows resistances during treatment too [1]. In such a context the continuation of the development of new more efficient Dapsone derivatives is a real necessity. The 2-azetidinone (β-lactam) ring system is the common structural feature of a certain number of β-lactam with broad antibiotic spectrum. It includes penicillins, cephalosporins, carbapenems, nocardicins, monobactams, clavulanic acid, sulbactams and tazobactams, which have been widely used as chemotherapeutic agents to treat bacterial infections and microbial diseases [2-9]. In recent years, the synthesis of 2-azetidinones and the study of their antibacterial properties have permitted to obtain compounds with various pharmacological activities such as antidiabetic activity [10], anti-inflammatory [11] and Anti-HIV activity [12]. In order to get new compounds with more interesting biological activities the condensation of the Dapsone with 2-azetidinone was therefore envisaged by some chemists [13-15]. The quantitative structure-activity Relationship (QSAR) study is the process by which a molecular structure is correlated with a well-determined effect such as biological activity or chemical reactivity. The development of these kind of relationships is in full expansion and become indispensable (useful) in pharmaceutical chemistry and drug design [16]. This study is used to limit the numerous experiments those are sometimes long and expensive. In fact it reduces the drug production cost too for pharmaceutical firms [17,18]. This QSAR approach originates from studies conducted on the one hand by Hansch [19] and on the other hand by Free and Wilson [20]. Indeed, Hansch has established models that relate biological activity to the hydrophobic, electronic, and steric properties of molecules. Generally, the QSAR model is based on a fifth (1/5) of the initial database.
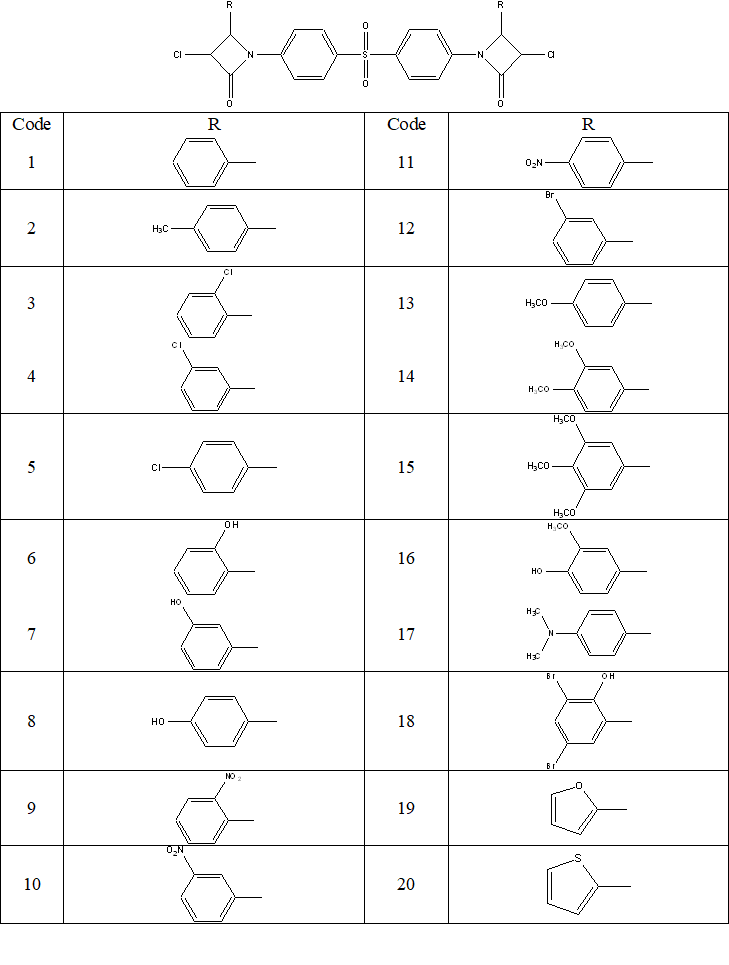
The main objective of this work is to apply Quantitative Structure-Activity Relationships (QSAR) modeling to develop reliable models to predict two antibacterial activities that are Bacillus subtilis and Pseudomonas aeruginosa, of a series of twenty (20) Azetidinones derivatives of Dapsone (Figure 1). These compounds have been synthesized and tested by Mehta and Pathak [13] for their biological activities.
These molecules were synthesized by condensation of Schiff bases which derive from Dapsone with chloroacetylchloride in the presence of triethylamine as a catalyst in order to obtain azetidinones (1-20).
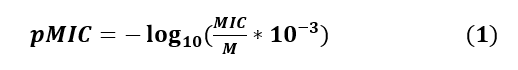
The twenty (20) molecules used in this study have Minimal Inhibitory Concentration (MIC) ranging from 1.0 to 54.0 μg/mL. The Minimum Inhibitory Concentration (MIC) is the lowest concentration needed to have an antibacterial response. Biological data are generally expressed as the opposite of the log 10 base of activity (-log10(C)) in order to obtain higher mathematical values when the structures are biologically very efficient [21,22]. The antibacterial activity is expressed by the antibacterial potential pMIC. The antibacterial potential is calculated from equation (1)
See Equation (1) in Figures and Tables below
Where M is the molecular weight of the component expressed in g/mol and MIC, the minimum inhibitory concentration in μg/mL.
2.2. Computational Methods
Correlations between the biological activity values of the studied molecules and their molecular structures were obtained by quantum chemistry calculations using the software called Gaussian 09[23]. In QSAR studies, DFT methods are generally well-known for generating a variety of molecular properties [24-31]. These properties increase the predictability of QSAR models by reducing the time and the cost involved in the design of new drugs [32, 33]. The B3LYP/6-31G (d) theory level was used to determine the molecular descriptors. The modeling was done using the Multilinear regression method implemented in Excel [34] and XLSTAT [35] spreadsheets.
2.3. Quantum Descriptors
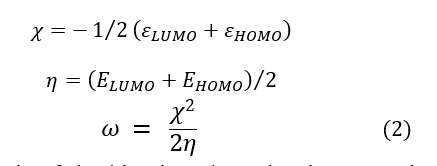
For the development of QSAR models, some theoretical descriptors related to the conceptual DFT have been determined in particular, the electrophilic index (ω), the electronic energy ε0 and the dipole moment . These descriptors are all determined from the optimized structure of the molecules. The electrophilic index (ω) measures the energetic stability of a system when this one acquires an additional charge from its environment [36]. The electronic energy ( ) represents the electronic contribution of all atoms in each molecule. The dipole Moment (μ) indicates the stability of a molecule in water. Thus, a strong dipole moment will translate a low solubility in organic solvents and a high solubility in water [37, 38]. The electrophilic index (ω) is calculated from the equations (2):
See Equation (2) in Figures and Tables below
Concerning all the studied descriptors, the analysis of the bivariate data, that is to say the calculation of the partial correlation coefficient between each of the pairs of the whole descriptors is (inferior) less than 0.70 (aij <0.70) , Which means that these different descriptors are independent from each other’s [39,40].
2.4. Estimation of the Predictive Ability of a QSAR Model
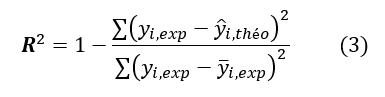
The quality of a model is determined by taking into account various statistical data including the squared regression correlation coefficient R2, the standard error of the regression S, the correlation coefficients of cross validation Q2cvand Fisher F-test. The statistical indicators R2, S and F are linked to the adjustment of the calculated and experimental values. They describe the predictive capacity in the model’s limits and allow to estimate the precision (accuracy) of the calculated values on the training set [41-43]. As for the cross-validated squared correlation coefficient Q2cv, it provides information on the predictive power of the model. This predictive power is qualified to be "internal" because it has been calculated from the basic structures which are used to build this model. The determination’s coefficient R2 gives an evaluation of the dispersion of theoretical values around the experimental ones. The quality of the modeling is good when the different points are closer to the fitting line [44]. The adjustment of the points to this line can be evaluated by the coefficient of determination.
See Equation (3) in Figures and Tables below
Where
yi,exp: Experimental value of antibacterial activity
ŷi,theo: Theoretical value of the antibacterial activity
ȳi,exp: The mean value of the experimental values of the antibacterial activity
The closer the value of R² to 1, the more the theoretical and experimental values are correlated.
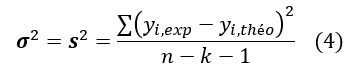
Moreover, the variance σ2 is determined by the relation 4:
See Equation (4) in Figures and Tables below
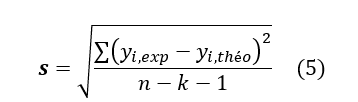
Where k is the number of independent variables (descriptors), n is the number of molecules in the test or learning set and n-k-1 is the degree of freedom. The standard deviation S is another used statistical indicator. It evaluates the reliability and precision (accuracy) of a model:
See Equation (5) in Figures and Tables below
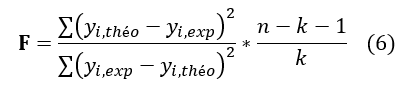
The Fischer test F is also used to measure the level of statistical significance of the model, ie the quality of the choice of the descriptors constituting the model.
See Equation (6) in Figures and Tables below
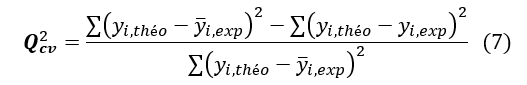
The coefficient of determination of the cross-validated squared correlation coefficient , permits to evaluate the accuracy of the prediction on the test set and it is calculated by using the following formula:
See Equation (7) in Figures and Tables below
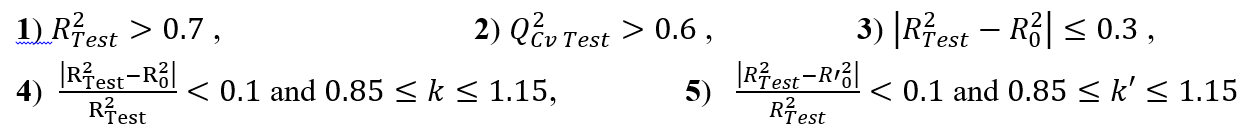
The performance of a mathematical model is characterized by a value of Q2cv which higher than 0.5(Q2cv>0.5) for satisfactory models and higher than 0.9(Q2cv>0.9) for excellent ones according to Eriksson et al. [45,46]. Taking into account their results, a given test set is a performant model when the following acceptance criterion R2<Q2cv is respected. Moreover, the predictive power of a model can be obtained from the five criteria of Tropsha et al. [47-49]. If at least three of the five criteria are met, the model will be considered acceptable. The five criteria are as follow:
See Equation (8) in Figures and Tables below
Where :
R2: Correlation coefficient for the molecules in the validation set.
R02: Correlation coefficient between predicted and experimental values for the validation set.
R012: Correlation coefficient between experimental and predicted values for the validation set.
k: Is the constant of the correlation line at the origin for the validation set (predicted values based on experimental values).
k’: Is the constant of the correlation line at the origin for the validation set (experimental values according to the predicted values)
The Table 1 includes the fourteen (14) molecules in the training set and the six (6) molecules in the validation set. Thereafter, the values of the partial correlation coefficients aij of the descriptors are also presented in Table 2.
The partial correlation coefficients aij between the pairs of descriptor (µ, ω), (µ,ε0 ) and (ω,ε0 ) are less than 0.70 (aij < 0.70). These values demonstrate the independence of the descriptors used to develop the models.
It must be noted that the negative or positive sign of the descriptor’s coefficient of the model reflects the proportionality’s effect between the evolution of the biological activity and the parameter of the regression equation. Thus, the negative sign indicates that when the value of the descriptor is high, the biological activity decreases whereas the positive sign translates the opposite effect. The table 3 presents the best QSAR models obtained for the various antibacterial activities of Bacillus subtilis and Pseudomonas aeruginosa as well as statistical indicators. It must be emphasized (underlined) that these models were established using the same descriptors of the training test and test set of Table 1.
Model 1 (Bacillus subtilis)p MICiexp(μg/mL): = 2.593 - 3.10-5* ε0 + 0.485*ω
Model 2 (Pseudomonas aeruginosap MICiexp(μg/mL): = 1.065 - 6.7.10-4* ε0 + 0.353*ω - 0.046*μp MICiexp
The negative signs of the dipole moment and electronic energy coefficients indicate that antibacterial activities will be improved for low value of the dipole moment and the electronic energy. In contrast, the positive signs of the coefficient of the electrophilic index means that high values of this descriptor are needed to improve the antibacterial activity. The significance of the models is translated by a high values of the correlation coefficient R2 which are 0.945 and 0.933 for the model 1 and for model 2 respectively. Otherwise the cross-validation correlation coefficient Q2cv for model 1 is 0.942 and 0.928 for model 2. These different models are all acceptable because all the different values of R2 -Q2cv are less than 0.3. The external validation of models 1 and 2 was carried out respectively with the Azetidinones (1; 2; 3; 4; 5; 20) and (5; 6; 11; 17; 18; 19).
The Tropsha criteria checks for external validation sets are presented in table 4.
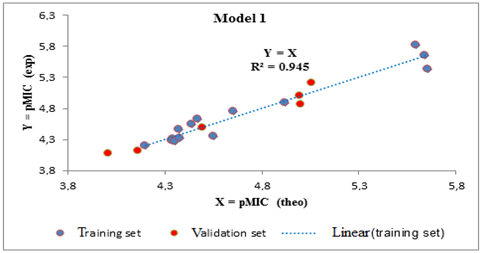
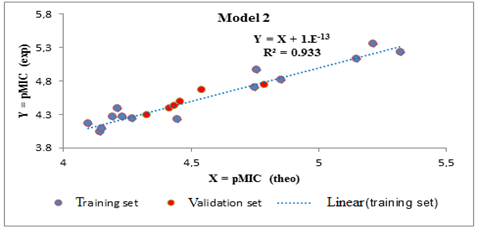
All Tropsha criteria are verified by the external validation sets of models 1 and 2. These models are therefore acceptable for the prediction of antibacterial activities (Bacillus subtilis and Pseudomonas aeruginosa) of the series of Azetidinones derived from Dapsone. The different regression lines between the experimental and theoretical antibacterial activities of the training set (blue dots) and the test set (red dots) for Bacillus subtilis (model 1) and Pseudomonas aeruginosa (model 2) are illustrated respectively in Figures 2 and 3.
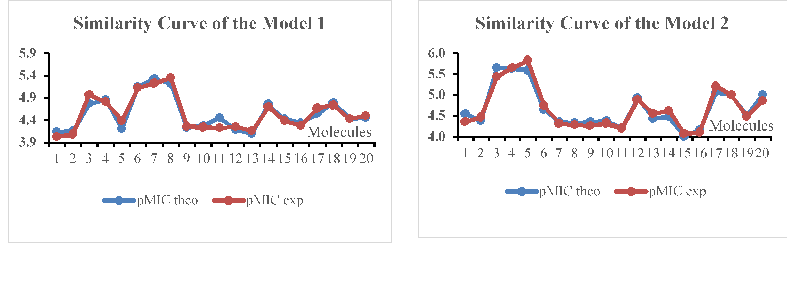
The low values of 0.139 and 0.135 as of the standard error respectively in Models 1 and 2 demonstrate a good similarity between the predicted and experimental values (Figure 4). These curves show similar evolutions of these values in both models of Azetidinones’ series derived from Dapsone, despite some recorded differences.
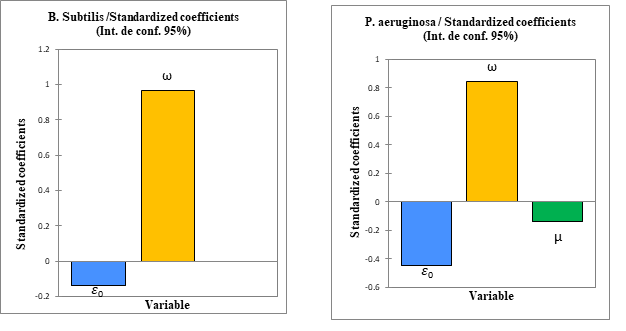
3.3. Analysis of the Contribution of Descriptors inside Models
According to the fact that each of the two models are as a function of two or three descriptors. It appears necessary to determine the contribution of each descriptors. The study of the relative contribution of the descriptors in the prediction of the antibacterial activity of the compounds was carried out for the bacteria Bacillus subtilis and Pseudomonas aeruginosa by using the software XLSTAT version 2014 [35]. The different contributions are presented in figure 4.
The electrophilic index presents a large contribution compared to the other descriptors in the two models. Thus, the electrophilic index proves to be the priority descriptor in the prediction of the antibacterial activities (Bacillus subtilis and Pseudomonas aeruginosa) of the studied Azetidinones derivatives.
The electrophilic index (ω), the dipole Moment (µ), and the electronic energy ( ) allowed us to predict the behaviour of the studied azetidinones in the presence of Bacillus subtilis and Pseudomonas aeruginosa bacteria. This study revealed the existence of strong correlations between the calculated and experimental values of the antibacterial potential. The QSAR obtained models allow us to predict the activity of the best analogues called "lead". These proposed models reveal that the electrophilic index is the first most useful descriptor for improving antibacterial activity. In addition, the positive signs of the electrophilic index coefficient indicate that antibacterial activities will be improved for a high value of the electrophilic index. This work constitutes a compass for the design of new more active molecules against bacteria Bacillus subtilis and Pseudomonas aeruginosa. The significance of these models was verified by the mean of a test set which is composed of six molecules. The work presented here will therefore play an important role in understanding the relationship between the physicochemical parameters of the structure and the biological activity. The study of these QSAR models, could help us to select the appropriate substituent in order to design new compounds with improved biological activity.
|
code |
ε0 (u.a.) |
ω (eV) |
(D) |
Bacillus Subtilis |
Pseudomonas Aeruginosa |
||
|
MIC (μg/mL) |
pMIC |
MIC (μg/mL) |
pMIC |
||||
|
1 |
-2885.352 |
3.582 |
2.370 |
49 |
4.071 |
54 |
4.029 |
|
2 |
-2963.989 |
3.515 |
2.822 |
47 |
4.110 |
50 |
4.083 |
|
3 |
-3804.538 |
3.737 |
3.466 |
4 |
5.208 |
7 |
4.965 |
|
4 |
-3804.541 |
3.811 |
1.991 |
9 |
4.998 |
13 |
4.810 |
|
5 |
-3035.783 |
3.233 |
3.677 |
6.5 |
4.484 |
10 |
4.387 |
|
6 |
-3804.541 |
3.829 |
2.158 |
20 |
4.354 |
25 |
4.280 |
|
7 |
-3035.785 |
3.504 |
2.435 |
27 |
4.463 |
32 |
4.387 |
|
8 |
-3294.328 |
6.129 |
5.923 |
21 |
5.426 |
25 |
5.125 |
|
9 |
-3294.349 |
6.102 |
1.974 |
2.5 |
5.648 |
5 |
5.222 |
|
10 |
-3294.348 |
6.003 |
3.533 |
1.5 |
5.824 |
4 |
5.347 |
|
11 |
-8027.558 |
3.814 |
2.105 |
1 |
4.752 |
3 |
4.662 |
|
12 |
-3114.398 |
3.438 |
2.601 |
13 |
4.313 |
16 |
4.260 |
|
13 |
-3343.429 |
3.409 |
4.862 |
31 |
4.287 |
35 |
4.242 |
|
14 |
-3572.459 |
3.434 |
4.564 |
36 |
4.267 |
40 |
4.226 |
|
15 |
-3264.834 |
3.499 |
6.120 |
41 |
4.321 |
45 |
4.258 |
|
16 |
-3153.290 |
3.143 |
3.891 |
32 |
4.199 |
37 |
4.159 |
|
17 |
-13320.193 |
4.075 |
2.982 |
42 |
4.887 |
46 |
4.736 |
|
18 |
-2880.897 |
3.649 |
8.062 |
12 |
4.542 |
17 |
4.424 |
|
19 |
-3526.854 |
3.676 |
7.782 |
16 |
4.624 |
21 |
4.492 |
|
20 |
-3804.540 |
3.803 |
4.177 |
14 |
4.856 |
19 |
4.697 |
|
|
µ |
ω |
|
|
µ |
1.000 |
|
|
|
ω |
0.045 |
1.000 |
|
| ε0 |
0.213 |
0.017 |
1.000 |
|
Statistical indicators of Multilinear regression |
Model 1 (Bacillus subtilis) |
Model 2 (Pseudomonas aeruginosa) |
|
Number of Compounds N |
14 |
14 |
|
Squared regression correlation coefficient R2 |
0.945 |
0.933 |
|
Standard error of the regression S |
0.139 |
0.135 |
|
Statistical significance of regression, Fisher F-test F |
94.315 |
46.582 |
|
Cross-validation correlation coefficient Q2cv |
0.942 |
0.928 |
|
R2 -Q2cv |
0.003 |
0.005 |
|
Range of Activity p MICiexp(μg/mL) |
1 - 45 |
3 - 54 |
|
Level of Statistical Significance α |
> 95 % |
|
|
Statistique Parameters |
Tropsha Criteria [47-49] |
Model 1 |
Model 2 |
| R2 | >0.7 |
0.954 |
0.856 |
| Q2cv | >0.6 |
0.952 |
0.832 |
| |R2 - R02| |
≤ 0.3 |
0.00 |
0.00 |
| |R2 - R02| / R2 | < 0.1 |
0.00 |
0.00 |
| k | 0.85 ≤ k ≤ 1.15 |
1 |
1 |
| |R2 - R012| / R2 | < 0.1 |
0.00 |
0.00 |
| k1 | 0.85 ≤ k1 ≤ 1.15 |
0.954 |
0.856 |
B.A. Ga?z?re, La l?pre ou Maladie de Hansen, 1, 2016.
R.B. Morin, M.Gorman, Chemistry and Biology of ?-lactam Antibiotics, Academic Press: London, Vol. 2, pp. 114, 1982.
G.I. George, The Organic Chemistry of ?-Lactams, Eds. VCH, New, York, 1993.
C.M.L. Delpiccolo, M.A. Fraga, E.G. Mata, An efficient, stereoselective solid-phase synthesis of ?-lactams using mukaiyama's salt for the staudinger reaction. J. Comb. Chem., Vol. 5, pp. 208-210, 2003. PMid:12739933
View Article PubMed/NCBIT.D. Gootz, Discovery and development of new antimicrobial agents, Clin. Microbiol. Rev., 3(1):13-31, 1990. PMid:2404566
View Article PubMed/NCBIS.N. Maiti, R.P.K. Babu, R. Shan, Overcoming bacterial resistance: Role of ?-lactamase inhibitors. Top. Heterocycl. Chem., Vol. 2, pp. 207-246, 2006.
View ArticleG.S. Singh., Beta-lactams in the new millennium. Part-1: monobactams and carbapenems. Mini. Rev. Med. Chem., Vol. 4(1), pp. 69-92, 2004. PMid:14754445
View Article PubMed/NCBIC.D. Risi, G.P. Pollini, A.C. Veronese, V. Bertolasi, A new simple route for the synthesis of (?)-2-azetidinones starting from ?-enaminoketoesters. Tetrahedron; Vol. 57(51), pp. 10155-10161, 2001. 01036-5
View ArticleW. Durckheimer, J. Blumbach, R. Lattrell, K.H. Scheunemann, Recent developments in the field of ?-lactam antibiotics. Angew. Chem. Int. Ed. Engl.; Vol. 24(3), pp. 180-202, 1985.
View ArticleR.K. Goel, M.P. Mahajan, S.K. Kulkarni, Evaluation of antihyperglycemic activity of some novel monocyclic beta lactams. J. Pharm. Pharm. Sci., Vol. 7(1): pp. 80-83, 2004. PMid:15144739
PubMed/NCBIA. Kumar, C.S. Rajput, Synthesis and anti-inflammatory activity of newer quinazolin-4-one derivatives, Eur. J. Med. Chem., Vol. 44(1), pp. 83-90, 2009. PMid:18501478
View Article PubMed/NCBIT. Sperka, J. Pitlik, P. Bagossi, J. Tozser, Beta-lactam compounds as apparently uncompetitive inhibitors of HIV-1 protease, Bioorg. Med. Chem. Lett. Vol. 15(12): pp. 3086-3090, 2005. PMid:15893929
View Article PubMed/NCBIP. D. Mehta, A. K. Pathak, synthesis, characterization and in vitro antimicrobial activity of Novel 4,4?-bis[3-chloro-4-aryl-azetidin-2-one-1-yl]diphenyl sulphones, Bulletin of Pharmaceutical Research, Vol. 1(3), pp. 38-48, 2011.
S. J. Wadher, M. P. Puranik, N. A. Karande and P. G. Yeole, Synthesis and Biological Evaluation of Schiff base of Dapsone and their derivative as Antimicrobial agents, International Journal of Pharm Tech Research, Vol. 1(1), pp. 22-33, 2009.
P. D. Mehta, N. P. S. Sengar, E. V. S. Subrahmanyam1 and D. Satyanarayana, Synthesis and Biological Activity Studies of Some Thiazolidinones and Azetidinones, Indian Journal of Pharmaceutical Sciences, Vol. 68 (1), pp. 103-106, 2006.
View ArticleG. Fayet, Th?se de doctorat, D?veloppement de mod?les QSPR pour la prediction des propri?t?s d'explosibilit? des compos?s nitroaromatiques, Universit? Pierre et Marie Curie (France), p: 57, pr?sent?e le 30 mars. 2010.
T. I. Oprea, Chemoinformatics in Drug Discovery, Ed. WILEY-VCH Verlag. Allemagne, 2005.
View ArticleE. A. Rekka; P. N. Kourounakis, Chemistry and Molecular Aspects of Drug Design and Action, Ed. Taylor & Francis Group, LLC. Etats Unies, 2008.
C. Hansch, T. Fujita ? ? ? ? ?, analysis: method for correlation of biological activity and chemical structure, J. Am. Chem. Soc. Vol. 86, pp. 1616-1626, 1964.
View ArticleS. M. Free, J. W. Wilson, A Mathematical Contribution to Structure-Activity Studies, J. Med. Chem., Vol. 7, pp. 395-399, 1964. PMid:14221113
View Article PubMed/NCBIS. Chaltterjee, A. Hadi, B. Price, Regression Analysis by Examples; Ed. Wiley VCH: New York, USA, 2000.
H.T.N. Phuong, Synth?se et ?tude des relations structure/activit? quantitatives (QSAR/2D) d'analogues Benzo [c] ph?nanthridiniques, Doctorat Thesis, Angers University, (France), 2007.
M. Frisch, G. Trucks, H. Schlegel et G. Scuseria, Gaussian 09, Revision C.01, Gaussian, Inc., Wallingford CT., 2009.
P. K. Chattaraj, A. Cedillo, and R. G. Parr, The definition of hardness ? used in the present work is consistent with these very recent papers and differs from the earlier one, J. Phys. Chem., Vol. 103(17), pp. 7645-7646, 1995.
View ArticleP. W. Ayers, and R. G. Parr, Variational principles for describing chemical reactions: the Fukui function and chemical hardness revisited, J. Am. Chem. Soc., Vol. 122 (9), pp 2010-2018, 2000.
View ArticleF. De Proft, J. M. L. Martin, and P. Geerlings, On the Performance of Density Functional Methods for Describing Atomic Populations, Dipole Moments and Infrared Intensities, Chem. Phys Let, Vol. 250, pp. 393, 1996. 00057-7
View ArticleP. Geerlings, F. De Proft, and J. M. L. Martin, In Theoretical and Computational Chemistry; Seminario, J., Ed.; Elsevier; Amsterdam. Vol. 4, pp. 773, 1996.
F. De Proft, J. M. L. Martin, and P. Geerlings, Calculation of Molecular Electrostatic Potentials and Fukui Functions using Density Functional Methods, Chem. Phys Let, Vol. 256: pp. 400, 1996. 00469-1
View ArticleF. De Proft, and P. Geerlings, Calculation of Ionization Energies, Electron Affinities, Electronegativities and Hardnesses using Density Functional Methods, J Chem Phys, Vol. 106, pp. 3270, 1997.
View ArticleP. Geerlings, F. De Proft, and W. Langenaeker, Density Functional Theory: A Source of Chemical Concepts and a Cost-Effective Methodology for their Calculation, Invited contribution to Advances in Quantum Chemistry, J. Seminario Editor, Academic Press, New York, Vol. 33: pp. 303, 1999.
R. G. Parr, R. A. Donnelly, M. Levy, and W. E. Palke, Electronegativity: The Density Functional Viewpoint, J. Chem. Phys., Vol. 68, pp. 3801?3807, 1978.
View ArticleC. Hansch, P. G. Sammes, and J. B. Taylor, Computers and the medicinal chemist; in: Comprehensive Medicinal Chemistry, Eds. Pergamon Press, Oxford, vol. 4, pp. 33-58, 1990. PMCid:PMC1384243
R. Franke, Theoretical Drug Design Methods, Elsevier, Amsterdam, pp. 412, 1984. PMid:6733586
PubMed/NCBIMicrosoft ? Excel ? 2013 (15.0.4420.1017) MSO (15.0.4420.1017) 64 Bits (2013) Partie de Microsoft Office Professionnel Plus.
XLSTAT Version 2014.5.03 Copyright Addinsoft 1995-2014 (2014) XLSTAT and Addinsoft are Registered Trademarks of Addinsoft.
View ArticleR.G. Parr; W. Yang, Density Functional Theory of Atoms and Molecules; Oxford Uni-versity Press: New York, 1989.
R. Rivelino et S. Canuto, Conformational Stability of Furfural in Aqueous Solution: The Role of Hydrogen Bonding, Brazilian Journal of Physics,vol 34(11), pp. 84-89, 2004.
View ArticleM. W. Wong, M. J. Frisch et K. B. Wiberg, Solvent effects: The mediation of electrostat-ic effects by solvents, J. Am. Chem. Soc., vol. 113(113), pp. 4776-4782, 1991.
View ArticleA. Vessereau, M?thodes statistiques en biologie et en agronomie. Lavoisier (Tec & Doc).Paris, pp. 538, 1988.
J.S. N'dri, M.G-R. Kon?, C.G. Kodjo, S.T. Affi, A. Kablan, O. Ouattara, D. Soro, N. Ziao, Quantitative Activity Structure Relationship (QSAR) of a Series of Azetidinones Derived from Dapsone by the Method of Density Functional Theory (DFT). IRA Interna-tional Journal of Applied Sciences, Vol 8(2), pp. 55-62, 2017.
View ArticleG. W. Snedecor, W. G. Cochran, Statistical Methods; Oxford and IBH: New Delhi, India; p. 381, 1967.
M. V. Diudea, QSPR/QSAR Studies for Molecular Descriptors; Nova Science: Huntingdon, New York, USA, 2000.
Y. H. Kpidi, O. B. Yapo, M. G-R. Kon?, G. A. Gadji, A. E. J. E. Y. Gnagne, J. S. N'dri, and N. Ziao, "Monitoring and Modeling of Chlorophyll-a Dynamics in a Eutrophic Lake: M'koa Lake (Jacqueville, Ivory Coast)." American Journal of Environmental Protection, Vol. 6(1), pp. 1-9, 2018.
View ArticleE. X. Esposito, A. J. Hopfinger, J. D. Madura, Methods for Applying the Quantitative Structure-Activity Relationship Paradigm, Methods in Molecular Biology, Vol. 275, pp. 131-213, 2004. PMid:15141113
View Article PubMed/NCBIL. Eriksson, J. Jaworska, A. Worth, M.T. D. Cronin, R. M. Mc Dowell, P. Gramatica, Methods for Reliability and Uncertainty Assessment and for Applicability Evaluations of Classification- and Regression-Based QSARs, Environmental Health Perspectives, Vol. 111(10), pp. 1361-1375, 2003. PMid:12896860
View Article PubMed/NCBIK. N. N'guessan, M. G.-R. Kon?, K. Bamba, W. P. Ouattara., N. Ziao, Quantitative Struc-ture Anti-Cancer Activity Relationship (QSAR) of a Series of Ruthenium Complex Azopyridine by the Density Functional Theory (DFT) Method, Computational Molecular Bi-oscience, vol. 7, pp. 19-31, 2017.
View ArticleGolbraikh A., A. Tropsha, Beware of qsar, J. Mol. Graph. Model, Vol. 20, pp. 269, 2002. 00123-1
View Article(a) Tropsha A. P. Gramatica, and V.K. Gombar, The importance of being earnest, validation is the absolute essential for successful application and interpretation of QSPR models, QSAR Comb. Sci. Vol. 22, (69) 2003.
O. Ouattara, T. S. Affi, M. G.-R. Kon?, K. Bamba, N. Ziao, ?Can Empirical Descriptors Reliably Predict Molecular Lipophilicity ? A QSPR Study Investigation ? Int. Journal of Engineering Research and Application, vol. 7:(15), pp. 50-56., 2017.
View Article