Cyrille MENYE
Ph.no: +237 697660159,
Email : menyecyrille@yahoo.fr
© 2019 Sift Desk Journals. All Rights Reserved
VOLUME: 5 ISSUE: 1
Page No: 550-560
Cyrille MENYE
Ph.no: +237 697660159,
Email : menyecyrille@yahoo.fr
Cyrille MENYE 1*, Francis Rollin NDOM 2, Claude Marie NGABIRENG ², Siméon KOUAM FOGUE 3
1* Department of Physics / Faculty of sciences/, University of Douala, Douala, Cameroon
2 Department of Mathematics and Physical Science / National Advanced School of Engineering/, University of Yaounde I, Yaounde, Cameroon
3 Department of Chemistry /Higher Teachers’ Training College/ University of Yaounde I, Yaounde, Cameroon
MENYE Cyrille, Francis Rollin NDOM , Claude Marie NGABIRENG , Siméon KOUAM FOGUE, Quantum and Structural Molecular Fragment models used to predict anti-inflammatory activity (2021) Journal of Computational Chemistry & Molecular Modeling 5(1) :550-560
In this paper, we predict the anti-inflammatory activity of a series of 26 structures of N-arylanthranilic acid. So, Quantitatve Structure-Activity Relationship (QSAR) method remains the focus of many studies aimed at modeling and prediction of physicochemical properties or biological activities of molecule. Two models was used: quantum model and Structural Molecular Fragment (SMF) model. In the first model, semi-empirical (AM1) approach was used to calculate the quantum chemical descriptors using GAUSSIAN 09 package and the others chemical descriptors were calculated with chemaxon package. In the second model, Structural Molecular Fragment were generated by I.S.I.D.A (In Silico Design and Data Analysis). Our two models were built by using a Multiple Linear Regression Analysis (MLR).The concluded QSAR models reflected that the drugs activity was mainly attributed to quantum chemical descriptors with the statistical analysis of multiple R-squared equal to 0.9898 v.s 0.9077 for the Structural Molecular Fragment developed in I.S.I.D.A.
Keywords: N-arylanthranilic acids, anti-inflammatory activity, quantum descriptors, Structural Molecular Fragment.
Non-Steroidal Anti-Inflammatory Drugs (NSAIDS) are still the most prescribed drugs worldwide for the treatment of inflammatory diseases like rheumatoid arthritis, osteoarthritis, orthopedic injuries, post-operative pain, acute myalgias etc. [1, 2]. N-arylanthranilic acids belong to the category of NSAIDS. They are amino isosteres of salicylates and are also known as fenemates. Important molecules of this class include mefenamic acid, flufenamic acid and meclofenamic acid. Fenemates act by blocking the metabolism of arachidonic acid by the enzyme cyclooxygenase (COX), one of the key enzymes in the arachidonic acid cascade [3-5]. This enzyme bis-oxygenates arachidonic acid to prostaglandine G2, which is subsequently degraded to vasoactive and inflammatory mediators such as prostanglandins (PGS), prostacyclin (PGI2), and thromboxane-A2[6]. Some fenemates also inhibit arachidonic acid lipoxygenase resulting in decreased synthesis of leukotrines, known mediators involved in inflammatory process [7]. Studies suggest that flufenamic and tolfenamic acids suppress proliferation of human peripheral blood lymphocytes by a mechanism, which involves inhibition of Ca2+ influx and is not related to inhibition of prostanoid synthesis [8].
Quantitative structure-activity and structure property relationship (QSAR/QSPR) studies are unquestionably of great importance in modern chemistry and biochemistry [9]. The concept of QSAR/QSPR is to transform searches for compounds with desired properties using chemical intuition and experience into a mathematically quantified and computerized form [10]. Once a correlation between structure and activity/property is found, any number of compounds, including those not yet synthesized, can be readily screened on the computer to select structures with the properties desired [11, 12]. It is then possible to select the most promising compounds to synthesize and test in the laboratory. Thus, the QSAR/QSPR approach conserves resource and accelerates the process of development of new molecules for use as drugs, materials, additives, or for any other purpose [13-16].
In the present study, relationship of chemical quantum and structural molecular fragment with anti-inflammatory activity of N-arylanthranilic acids derivatives has been investigated and suitable models developed for the prediction of anti-inflammatory activity.
In this study, we used the following materials: gaussian09 [17], chemaxon [18], ISIDA/QSPR [19-37], R [38] and data set of the 26 anthranilic acids molecule belonging to a group of NSAIDs were taken from the literature with their experimental activities (table.1) [39].
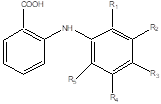
Figure 1. chemical structure of anthranilic acid
Table1. A dataset of 26 N-arylanthranilic acids with anti-inlammatory activity [22]
|
Mol |
R1 |
R2 |
R3 |
R4 |
R5 |
MEDa |
Aexp |
|
1 |
Cl |
H |
CF3 |
H |
Cl |
0.8 |
3.699 |
|
2 |
CH3 |
SO2N(CH3)2 |
H |
H |
CH3 |
0.5 |
3.903 |
|
3 |
CH3 |
NH2 |
H |
H |
Cl |
6.2 |
2.809 |
|
4 |
CH3 |
CH3 |
H |
H |
Cl |
12.5 |
2.505 |
|
5 |
Cl |
Cl |
H |
H |
CH3 |
0.8 |
3.699 |
|
6 |
Cl |
H |
C2H5 |
H |
Cl |
0.8 |
3.699 |
|
7 |
Cl |
H |
Cl |
Cl |
H |
400 |
1.000 |
|
8 |
Cl |
Cl |
Cl |
H |
H |
200 |
1.301 |
|
9 |
Cl |
H |
Cl |
H |
Cl |
100 |
1.602 |
|
10 |
NH2 |
CH3 |
H |
H |
CH3 |
25 |
2.204 |
|
11 |
CH3 |
CH3 |
H |
H |
CH3 |
6.2 |
2.809 |
|
12 |
Cl |
CH3 |
H |
H |
CH3 |
3.1 |
3.110 |
|
13 |
CH3 |
Cl |
H |
CH3 |
H |
1.6 |
3.397 |
|
14 |
CH3 |
C2H5 |
H |
H |
CH3 |
1.6 |
3.397 |
|
15 |
CH3 |
NH2 |
H |
H |
Cl |
1.3 |
3.488 |
|
16 |
CH3 |
SO2CH3 |
H |
H |
CH3 |
0.6 |
3.823 |
|
17 |
Cl |
N(CH3)2 |
H |
H |
Cl |
0.6 |
3.823 |
|
18 |
CH3 |
SOCH3 |
H |
H |
CH3 |
0.5 |
3.903 |
|
19 |
Cl |
Cl |
Cl |
H |
CH3 |
12.5 |
2.505 |
|
20 |
CH3 |
CH3 |
H |
CH3 |
CH3 |
100 |
1.602 |
|
21 |
Cl |
Cl |
Cl |
H |
Cl |
12.5 |
2.505 |
|
22 |
Cl |
CH3 |
Cl |
H |
Cl |
12.5 |
2.505 |
|
23 |
Cl |
Cl |
Cl |
Cl |
H |
100 |
1.602 |
|
24 |
Cl |
Cl |
H |
Cl |
Cl |
1.6 |
3.397 |
|
25 |
Cl |
Cl |
Cl |
Cl |
Cl |
25 |
2.204 |
|
26 |
CH3 |
CH3 |
Cl |
CH3 |
Cl |
100 |
1.602 |
The biological activity A was calculated from the minimal effective dose (MED mg/kgbody) by formula: A= log(4000/MED)
To perform our two models, we are using Multiple Linear Regression Analysis (MLR). The first model used quantum descriptors; 23 quantum chemical descriptors were computed with Gaussian 09. The semi-empirical AM1 method was employed for the calculation of this descriptors (Table 2). Chemaxon software with Marvin suite is a chemically intelligent desktop toolkit built to help us draw, edit, publish, render, import and export chemical structures and as well as allowing us to convert between various chemical and graphical file formats. Software R provides a wide variety of statistical (linear and nonlinear modeling, classical statistical test…) and graphical techniques.
Heuristic method was applied to the whole dataset of the N-arylanthranilic acids, a pre-selection of descriptors occurs. Descriptors unavailable for some compounds are discarded altogether with the invariant descriptors and descriptors that correlate poorly. Additional descriptors are discarded when high inter-correlations between them are found. The remaining descriptors are then ranked according to their correlation coefficients.
Table 2. calculated quantum chemical descriptors of anthranilic acids (1-26)
|
N° |
D1Q |
D2Q |
D3Q |
D4Q |
D5Q |
D6Q |
D7Q |
D8Q |
D9Q |
D10Q |
D11Q |
|
1 |
0.493 |
-0.406 |
-0.333 |
-0.0551 |
135.969 |
59.388 |
128.307 |
-72.059 |
4.213 |
295.11 |
127.847 |
|
2 |
2.699 |
-0.962 |
-0.328 |
-0.0523 |
230.036 |
63.712 |
119.385 |
-142.96 |
9.243 |
294.226 |
193.816 |
|
3 |
0.342 |
-0.425 |
-0.319 |
-0.0447 |
164.348 |
50.858 |
110.53 |
-96.746 |
4.449 |
282.365 |
121.626 |
|
4 |
0.339 |
-0.427 |
-0.317 |
-0.0442 |
170.92 |
50.31 |
108.883 |
-101.92 |
3.723 |
280.574 |
125.987 |
|
5 |
0.34 |
-0.418 |
-0.324 |
-0.0493 |
147.951 |
51.347 |
112.229 |
-84.355 |
5.692 |
278.86 |
139.435 |
|
6 |
0.349 |
-0.414 |
-0.321 |
-0.0461 |
166.363 |
54.902 |
117.558 |
-96.687 |
4.446 |
303.441 |
133.932 |
|
7 |
0.348 |
-0.413 |
-0.329 |
-0.0541 |
125.019 |
52.595 |
118.413 |
-66.195 |
4.168 |
317.732 |
123.078 |
|
8 |
0.347 |
-0.414 |
-0.329 |
-0.0539 |
125.036 |
52.512 |
119.138 |
-66.049 |
5.466 |
316.384 |
125.412 |
|
9 |
0.356 |
-0.41 |
-0.329 |
-0.0516 |
124.947 |
52.541 |
117.487 |
-66.344 |
3.909 |
307.437 |
121.546 |
|
10 |
0.324 |
-0.44 |
-0.314 |
-0.0473 |
187.972 |
51.667 |
110.257 |
-114.12 |
4.545 |
279.002 |
133.142 |
|
11 |
0.321 |
-0.437 |
-0.309 |
-0.0426 |
194.558 |
51.102 |
108.792 |
-119.27 |
4.06 |
281.88 |
131.881 |
|
12 |
0.333 |
-0.423 |
-0.316 |
-0.0443 |
170.813 |
50.452 |
108.398 |
-101.95 |
4.934 |
276.803 |
133.681 |
|
13 |
0.33 |
-0.431 |
-0.318 |
-0.0473 |
170.813 |
50.639 |
110.432 |
-101.51 |
4.722 |
290.707 |
130.305 |
|
14 |
0.321 |
-0.437 |
-0.309 |
-0.0424 |
213.235 |
54.404 |
111.756 |
-132.31 |
4.096 |
293.214 |
136.805 |
|
15 |
0.341 |
-0.425 |
-0.318 |
-0.0442 |
199.994 |
54.129 |
110.232 |
-122.94 |
4.376 |
301.779 |
141.254 |
|
16 |
0.322 |
-0.431 |
-0.33 |
-0.0703 |
200.408 |
65.452 |
126.23 |
-119.75 |
9.888 |
315.169 |
170.596 |
|
17 |
0.352 |
-0.412 |
-0.323 |
-0.0466 |
177.581 |
57.27 |
120.913 |
-104.18 |
5 |
296.863 |
150.625 |
|
18 |
0.329 |
-0.429 |
-0.319 |
-0.0492 |
197.361 |
59.424 |
119.83 |
-118.91 |
5.339 |
320.036 |
169.783 |
|
19 |
0.345 |
-0.415 |
-0.327 |
-0.0532 |
142.744 |
54.694 |
117.589 |
-79.367 |
5.688 |
320.386 |
135.133 |
|
20 |
0.32 |
-0.437 |
-0.308 |
-0.0418 |
212.605 |
52.923 |
108.295 |
-132.6 |
4.3 |
295.67 |
131.93 |
|
21 |
0.361 |
-0.406 |
-0.333 |
-0.0547 |
119.751 |
55.822 |
122.084 |
-61.531 |
4.511 |
319.511 |
139.307 |
|
22 |
0.356 |
-0.41 |
-0.327 |
-0.0505 |
142.958 |
54.877 |
117.877 |
-79.205 |
3.678 |
315.923 |
132.628 |
|
23 |
0.353 |
-0.41 |
-0.334 |
-0.0564 |
119.827 |
55.909 |
123.598 |
-61.256 |
4.917 |
327.476 |
141.484 |
|
24 |
0.362 |
-0.405 |
-0.333 |
-0.0542 |
119.734 |
55.87 |
122.284 |
-61.475 |
3.886 |
294.038 |
157.987 |
|
25 |
0.365 |
-0.403 |
-0.336 |
-0.0575 |
114.566 |
59.123 |
127.225 |
-56.607 |
4.222 |
330.366 |
158.156 |
|
26 |
0.344 |
-0.425 |
-0.318 |
-0.0475 |
184.058 |
57.825 |
119.32 |
-109.27 |
3.379 |
327.114 |
137.322 |
Table 2: (continued) calculated quantum chemical descriptors of anthranilic acids (1-26)
|
Q12Q |
D13Q |
D14Q |
D15Q |
D16Q |
D17Q |
D18Q |
D19Q |
D20Q |
D21Q |
D22Q |
D23Q |
|
|
1 |
124.929 |
-1.311 |
-1.652 |
-3.646 |
0.139 |
7.191 |
0.194 |
-0.194 |
0.136 |
182.629 |
28473.499 |
17.749 |
|
2 |
166.065 |
2.787 |
0.618 |
-8.791 |
0.138 |
7.263 |
0.190 |
-0.190 |
0.131 |
218.036 |
13638.764 |
85.433 |
|
3 |
128.524 |
-2.464 |
1.692 |
-3.295 |
0.137 |
7.287 |
0.182 |
-0.182 |
0.121 |
177.505 |
24775.831 |
19.794 |
|
4 |
129.211 |
-1.933 |
0.44 |
-3.151 |
0.136 |
7.331 |
0.181 |
-0.181 |
0.120 |
178.591 |
23409.146 |
13.861 |
|
5 |
120.605 |
0.481 |
3.857 |
-4.158 |
0.137 |
7.293 |
0.186 |
-0.186 |
0.127 |
179.633 |
22419.272 |
32.399 |
|
6 |
130.877 |
-2.456 |
1.549 |
-3.366 |
0.137 |
7.283 |
0.183 |
-0.183 |
0.122 |
189.417 |
29260.484 |
19.767 |
|
7 |
115.183 |
-0.704 |
-1.171 |
-3.937 |
0.138 |
7.273 |
0.192 |
-0.192 |
0.133 |
185.331 |
39489.304 |
17.372 |
|
8 |
112.254 |
-1.46 |
-1.457 |
-5.062 |
0.137 |
7.282 |
0.191 |
-0.191 |
0.133 |
184.683 |
39156.247 |
29.877 |
|
9 |
115.767 |
0.082 |
-1.651 |
-3.542 |
0.138 |
7.220 |
0.190 |
-0.190 |
0.130 |
181.583 |
35663.125 |
15.280 |
|
10 |
120.36 |
-0.48 |
0.251 |
4.518 |
0.134 |
7.485 |
0.181 |
-0.181 |
0.122 |
177.501 |
23302.902 |
20.657 |
|
11 |
124.914 |
1.525 |
0.291 |
-3.751 |
0.133 |
7.499 |
0.176 |
-0.176 |
0.116 |
179.558 |
23593.282 |
16.484 |
|
12 |
126.315 |
-1.464 |
2.502 |
-3.992 |
0.136 |
7.362 |
0.180 |
-0.180 |
0.119 |
178.933 |
21592.401 |
24.344 |
|
13 |
126.763 |
-0.247 |
2.403 |
-4.057 |
0.135 |
7.385 |
0.183 |
-0.183 |
0.123 |
182.592 |
26309.491 |
22.297 |
|
14 |
135.063 |
-1.466 |
0.621 |
-3.773 |
0.133 |
7.504 |
0.176 |
-0.176 |
0.116 |
188.361 |
24739.274 |
16.777 |
|
15 |
144.089 |
-2.25 |
1.795 |
-3.295 |
0.137 |
7.302 |
0.181 |
-0.181 |
0.120 |
195.707 |
25321.224 |
19.149 |
|
16 |
157.461 |
4.881 |
1.649 |
-8.439 |
0.130 |
7.699 |
0.200 |
-0.200 |
0.154 |
214.409 |
22972.847 |
97.773 |
|
17 |
138.271 |
-1.976 |
3.081 |
-3.405 |
0.138 |
7.245 |
0.185 |
-0.185 |
0.124 |
195.253 |
23344.798 |
25.000 |
|
18 |
136.104 |
0.2 |
4.833 |
-2.259 |
0.135 |
7.421 |
0.184 |
-0.184 |
0.126 |
208.641 |
28770.610 |
28.505 |
|
19 |
120.823 |
1.522 |
3.577 |
-4.152 |
0.137 |
7.317 |
0.190 |
-0.190 |
0.132 |
192.114 |
37174.421 |
32.353 |
|
20 |
141.262 |
2.054 |
-1.694 |
-3.376 |
0.133 |
7.524 |
0.175 |
-0.175 |
0.115 |
189.621 |
25369.852 |
18.490 |
|
21 |
115.935 |
1.116 |
2.53 |
-3.563 |
0.139 |
7.191 |
0.194 |
-0.194 |
0.135 |
191.584 |
37231.460 |
20.349 |
|
22 |
122.702 |
-0.3 |
1.347 |
-3.409 |
0.138 |
7.241 |
0.189 |
-0.189 |
0.129 |
190.418 |
35514.969 |
13.528 |
|
23 |
115.943 |
-1.673 |
-2.543 |
-3.861 |
0.139 |
7.210 |
0.195 |
-0.195 |
0.137 |
194.968 |
39995.788 |
24.177 |
|
24 |
116.463 |
0.062 |
1.88 |
-3.401 |
0.139 |
7.184 |
0.193 |
-0.193 |
0.134 |
189.496 |
25883.499 |
15.101 |
|
25 |
116.199 |
-1.403 |
-1.871 |
-3.514 |
0.139 |
7.169 |
0.197 |
-0.197 |
0.139 |
201.574 |
38642.089 |
17.825 |
|
26 |
135.721 |
-0.465 |
0.563 |
-3.298 |
0.135 |
7.383 |
0.183 |
-0.183 |
0.123 |
200.052 |
36327.423 |
11.418 |
D1Q: charge max, D2Q: charge min, D3Q: HOMO-energy, D4Q: LUMO-energy, D5Q: thermal energy, D6Q: constant volume molar heat capacity, D7Q: entropy, D8Q: partition function, D9Q: molecular dipole moment, D10Q: polarizability- αxx, D11Q: polarizability- αyy, D12Q: polarizability- αzz, D13Q: component of dipole along inertia axe x, D14Q: component of dipole along inertia axe y, D15Q: component of dipole along inertia axe z, D16Q: absolute hardness, D17Q: inverse of hardness, D18Q: chemical potential, D19Q: electro negativity D20Q: electrophilicity index, D21Q: mean polarizability of molecule D22Q: anisotropy of polarisability, D23Q: square of molecular dipole moment.
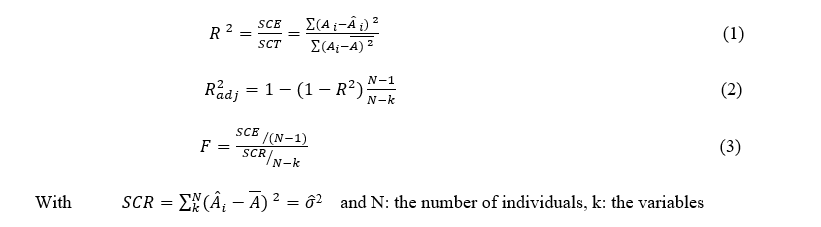
To decide whether a model generated is good or not is commonly defined by the square coefficient of fitting model (R2), adjusted R-squared(R2adj) and Fisher Statistic (F).
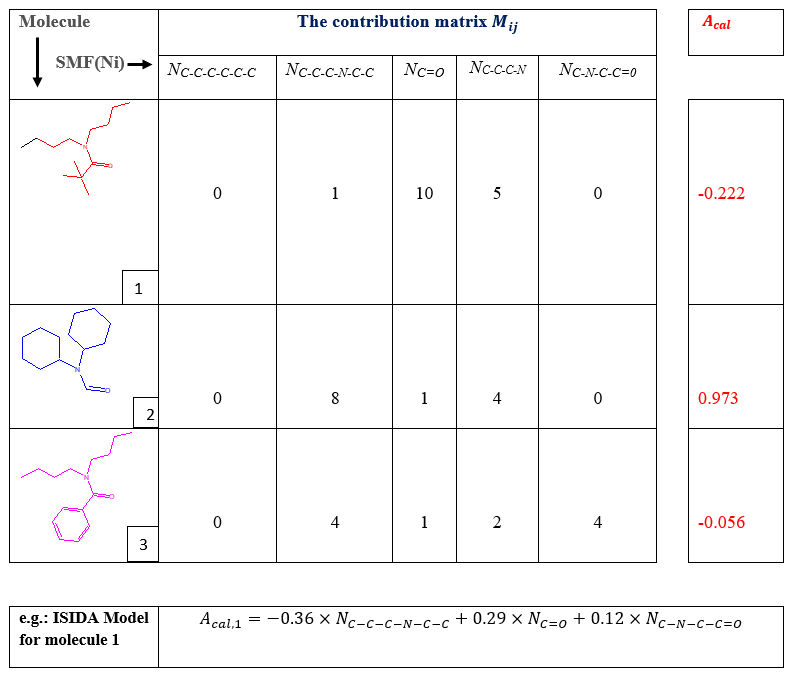
The second model used is Structural Molecular Fragment (SMF), this method is developed in ISIDA/QSPR, the latest is based on the splitting of a molecular graph on fragments (subgraphs), and on the calculation of their contributions to a given property Y. Two classes of fragments are used: “sequences” (I) and “augmented atoms” (II). Three sub-types of AB, A and B are defined for each class. For the fragments I, they represent sequences of atoms and bonds (AB), of atoms only (A), or of bonds only (B). Shortest or all paths from one atom to the other are used. For each type of sequences, the minimal (nmin) and maximal (nmax) number of constituted atoms must be defined. Thus, for the partitioning I (AB, nmin - nmax), I (A, nmin - nmax) and I (B, nmin- nmax), the program generates “intermediate” sequences involving n atoms (nmin ≤ n ≤ nmax). In the current version of ISIDA/QSPR, nmin ≥ 2 and nmax ≤ 15. The number of sequence’s types of different length corresponding to nmin = 2 and nmax= 15 is equal to 105 for each of three subtypes AB, A and B, totally 315 types of sequences. QSPR modeling was performed using Multiple Linear Regression Analysis (MLR) of the ISIDA/QSPR program with combined forward and backward stepwise variable selection techniques. MLR is applied to build linear relationships between independent variables (SMF descriptors: Ni i =1, 2…) and a dependent variable (here target property Y = A)

where every descriptor value is associated with observed property value (A), is descriptor contribution, and is the independent term which is omitted in a part of models see table (3). The Singular Value Decomposition method is used to fit contributions and to minimize the sum of squared residuals which are squared differences between the property values calculated by the model and observed values in the training set. The program can generate more than 25,000 MLR models; each of them corresponds to particular type of the SMF descriptors and MLR equation (a0= 0 or a0≠0) and applied variable selection technique.
Table 3. Example of ISIDA Model
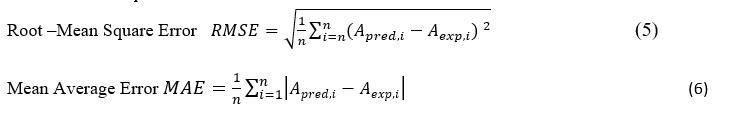
To validate consensus model, the external 5-fold cross validation (5-CV) was applied. [40-42] ISIDA, implicitly keeps every 5th compound in the test set, the initial set was randomly split into 5 subsets, each of which was iteratively ignored at the training stage, to serve as internal validation set while the four others formed, together, the learning set. For each of these 5 splitting schemes, models were built followed by prediction calculations on the corresponding validation set. Finally, all values calculated for five test sets are merged into one file to analyse overall linear correlations between experimental and predicted property. One can use Determination Coefficient (R2) (1), Root Mean Squared Error (RMSE) or Mean Average Error (MAE), to estimate the quality of the linear correlation between predicted (Apred) and experimental (Aexp) data for n compounds. Formulas for the statistical parameters are formulated below.
ISIDA calculates a Consensus Model (CM) combining the information issued from several models. At the first step, hundreds of models are built using different initial pools of descriptors corresponding to different fragmentation types.
The contributions of are calculated by minimizing a functional

where n is the number of the compounds in the training set, wi the weight accounting for the accuracy of the experimental data, Aexp and Acalc are, respectively, experimental and calculated.
Linear equations (4) are obtained by the contribution matrix Mij

3.1. Quantum model
With quantum-chemical descriptors, 18 descriptors were evicted in the reached model which are listed in table 1 while their numerical values are in equation Acal(9).
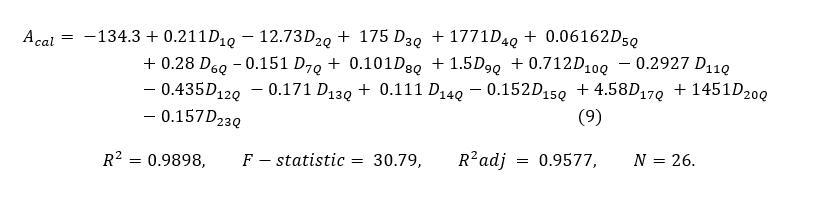
Table 4. A dataset of 26 N-arylanthranilic acids with calculated anti-inflammatory activity
|
Mol |
R1 |
R2 |
R3 |
R4 |
R5 |
MEDa |
Aexp |
Acal |
Aexp- Aexp |
|
1 |
Cl |
H |
CF3 |
H |
Cl |
0.8 |
3.699 |
3.725 |
-0.026 |
|
2 |
CH3 |
SO2N(CH3)2 |
H |
H |
CH3 |
0.5 |
3.903 |
3.902 |
0.001 |
|
3 |
CH3 |
NH2 |
H |
H |
Cl |
6.2 |
2.809 |
2.863 |
-0.054 |
|
4 |
CH3 |
CH3 |
H |
H |
Cl |
12.5 |
2.505 |
2.546 |
-0.041 |
|
5 |
Cl |
Cl |
H |
H |
CH3 |
0.8 |
3.699 |
3.525 |
0.174 |
|
6 |
Cl |
H |
C2H5 |
H |
Cl |
0.8 |
3.699 |
3.529 |
0.170 |
|
7 |
Cl |
H |
Cl |
Cl |
H |
400 |
1.000 |
0.919 |
0.081 |
|
8 |
Cl |
Cl |
Cl |
H |
H |
200 |
1.301 |
1.404 |
-0.103 |
|
9 |
Cl |
H |
Cl |
H |
Cl |
100 |
1.602 |
1.747 |
-0.145 |
|
10 |
NH2 |
CH3 |
H |
H |
CH3 |
25 |
2.204 |
2.180 |
0.024 |
|
11 |
CH3 |
CH3 |
H |
H |
CH3 |
6.2 |
2.809 |
2.755 |
0.054 |
|
12 |
Cl |
CH3 |
H |
H |
CH3 |
3.1 |
3.110 |
3.291 |
-0.181 |
|
13 |
CH3 |
Cl |
H |
CH3 |
H |
1.6 |
3.397 |
3.369 |
0.028 |
|
14 |
CH3 |
C2H5 |
H |
H |
CH3 |
1.6 |
3.397 |
3.351 |
0.046 |
|
15 |
CH3 |
NH2 |
H |
H |
Cl |
1.3 |
3.488 |
3.455 |
0.033 |
|
16 |
CH3 |
SO2CH3 |
H |
H |
CH3 |
0.6 |
3.823 |
3.829 |
-0.006 |
|
17 |
Cl |
N(CH3)2 |
H |
H |
Cl |
0.6 |
3.823 |
3.822 |
0.001 |
|
18 |
CH3 |
SOCH3 |
H |
H |
CH3 |
0.5 |
3.903 |
4.078 |
-0.175 |
|
19 |
Cl |
Cl |
Cl |
H |
CH3 |
12.5 |
2.505 |
2.389 |
0.116 |
|
20 |
CH3 |
CH3 |
H |
CH3 |
CH3 |
100 |
1.602 |
1.611 |
-0.009 |
|
21 |
Cl |
Cl |
Cl |
H |
Cl |
12.5 |
2.505 |
2.613 |
-0.108 |
|
22 |
Cl |
CH3 |
Cl |
H |
Cl |
12.5 |
2.505 |
2.505 |
0.000 |
|
23 |
Cl |
Cl |
Cl |
Cl |
H |
100 |
1.602 |
1.607 |
-0.005 |
|
24 |
Cl |
Cl |
H |
Cl |
Cl |
1.6 |
3.397 |
3.397 |
0.000 |
|
25 |
Cl |
Cl |
Cl |
Cl |
Cl |
25 |
2.204 |
2.091 |
0.113 |
|
26 |
CH3 |
CH3 |
Cl |
CH3 |
Cl |
100 |
1.602 |
1.588 |
0.014 |
The dataset N-arylanthranilic acids (1-26), the model shows the best correlation with R2=0.989 (Figure 2)
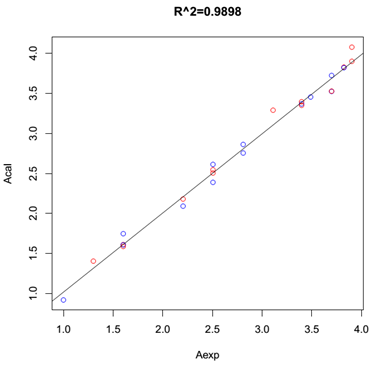
Figure 2. The plot Acal v.s Aexp
3.2. Structural Molecular Fragment (SMF) model
ISIDA generates 582 predefined fragments (SMF), but among these 582 fragments, 24 contributed to build our model. The contribution matrix (8)
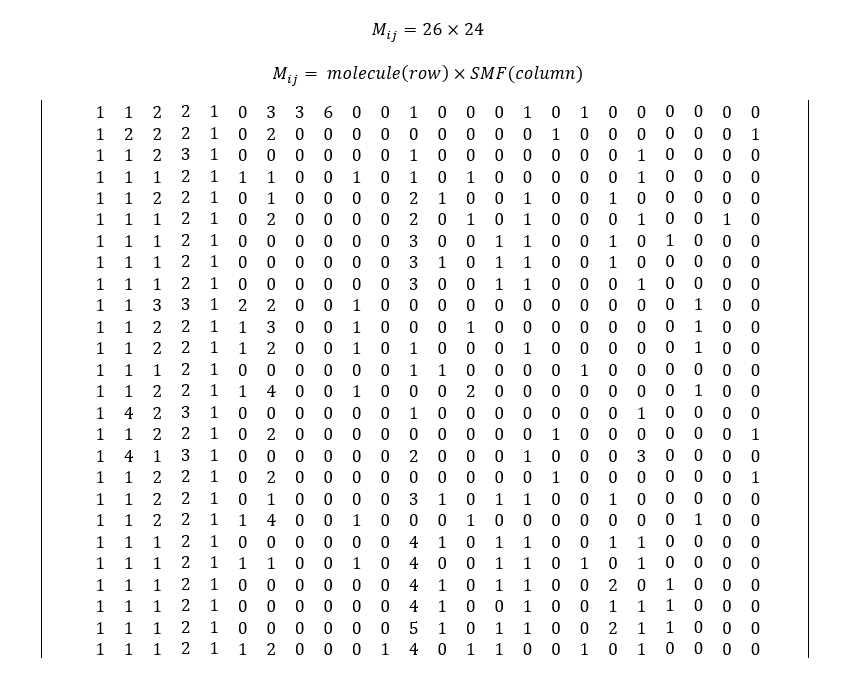
Table 5. Structural Molecular Fragment (SMF) with contributions ai
|
24 SMF |
|
||
|
1 |
C-C=O |
SMF1 |
-0.398275 |
|
2 |
C-N-C |
SMF2 |
0.204297 |
|
3 |
C-C-C-N |
SMF3 |
1.236656 |
|
4 |
C=C-C-N |
SMF4 |
-0.493310 |
|
5 |
C-C-C-O |
SMF5 |
1.447280 |
|
6 |
C-C-C=C-N |
SMF6 |
-0.731878 |
|
7 |
C-C-C=C-C |
SMF7 |
-0.338618 |
|
8 |
C-C=C-C-F |
SMF8 |
-0.887086 |
|
9 |
C-C=C-C-C-F |
SMF9 |
0.597106 |
|
10 |
C-C-C=C-N-C-C-C-O |
SMF10 |
1.220001 |
|
11 |
C-C=C-C-N-C=C-C-C-F |
SMF11 |
0.675218 |
|
12 |
Cl-C=C-C |
SMF12 |
-0.325778 |
|
13 |
Cl-C-C=C-N-C-C-C-O |
SMF13 |
1.365737 |
|
14 |
C-C-C-C |
SMF14 |
0.857632 |
|
15 |
Cl-C-C=C-C-N-C-C=C-C |
SMF15 |
-0.402841 |
|
16 |
Cl-C=C-N-C-C-C-O |
SMF16 |
0.916635 |
|
17 |
S-C-C-C |
SMF17 |
1.015195 |
|
18 |
Cl-C-C-C |
SMF18 |
0.453626 |
|
19 |
Cl-C-C-Cl |
SMF19 |
-0.470649 |
|
20 |
Cl-C-C-N-C |
SMF20 |
0.718064 |
|
21 |
Cl-C=C-C=C-Cl |
SMF21 |
0.620912 |
|
22 |
C-C-C=C-C-C |
SMF22 |
-0.378501 |
|
23 |
C-C-C-C=C-C-N |
SMF23 |
0.845447 |
|
24 |
S-C-C=C-C-C |
SMF24 |
0.794212 |
From the contribution matrix and table (5), we will express the predicted activity as a linear function of Structural Molecular Fragment. Here we have 26 equations, so one for each molecule. Let express the linear equation of molecule number 1.
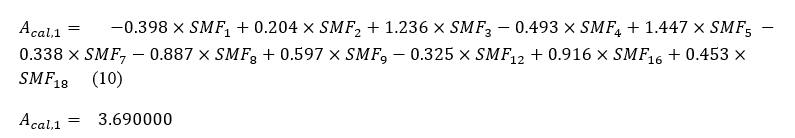
The predicted activity of all these molecules is confined in table (6) below:
Table 6. A dataset of 26 N-arylanthranilic acids with calculated anti-inflammatory activity
|
Mol |
R1 |
R2 |
R3 |
R4 |
R5 |
MED |
AEXP |
ACAL |
AEXP- ACAL |
|
1 |
Cl |
H |
CF3 |
H |
Cl |
0.8 |
3.699 |
3.699000 |
-0.000000 |
|
2 |
CH3 |
SO2N(CH3)2 |
H |
H |
CH3 |
0.5 |
3.903 |
4.076463 |
-0.176463 |
|
3 |
CH3 |
NH2 |
H |
H |
Cl |
6.2 |
2.809 |
2.638972 |
0.161028 |
|
4 |
CH3 |
CH3 |
H |
H |
Cl |
12.5 |
2.505 |
2.902764 |
-0.402764 |
|
5 |
Cl |
Cl |
H |
H |
CH3 |
0.8 |
3.699 |
3.561545 |
0.128455 |
|
6 |
Cl |
H |
C2H5 |
H |
Cl |
0.8 |
3.699 |
3.512326 |
0.177674 |
|
7 |
Cl |
H |
Cl |
Cl |
H |
400 |
1.000 |
1.190064 |
-0.190064 |
|
8 |
Cl |
Cl |
Cl |
H |
H |
200 |
1.301 |
1.934889 |
-0.634889 |
|
9 |
Cl |
H |
Cl |
H |
Cl |
100 |
1.602 |
1.757864 |
-0.157864 |
|
10 |
NH2 |
CH3 |
H |
H |
CH3 |
25 |
2.204 |
2.183851 |
0.016149 |
|
11 |
CH3 |
CH3 |
H |
H |
CH3 |
6.2 |
2.808 |
2.691396 |
0.108604 |
|
12 |
Cl |
CH3 |
H |
H |
CH3 |
3.1 |
3.110 |
3.216865 |
-0.106865 |
|
13 |
CH3 |
Cl |
H |
CH3 |
H |
1.6 |
3.390000 |
2.996924 |
0.393076 |
|
14 |
CH3 |
C2H5 |
H |
H |
CH3 |
1.6 |
3.397 |
3.210410 |
0.179590 |
|
15 |
CH3 |
NH2 |
H |
H |
Cl |
1.3 |
3.488 |
3.251863 |
0.228137 |
|
16 |
CH3 |
SO2CH3 |
H |
H |
CH3 |
0.6 |
3.823 |
3.872166 |
-0.052166 |
|
17 |
Cl |
N(CH3)2 |
H |
H |
Cl |
0.6 |
3.823 |
4.042193 |
-0.222193 |
|
18 |
CH3 |
SOCH3 |
H |
H |
CH3 |
0.5 |
3.903 |
3.872166 |
0.027834 |
|
19 |
Cl |
Cl |
Cl |
H |
CH3 |
12.5 |
2.505 |
2.832926 |
-0.332926 |
|
20 |
CH3 |
CH3 |
H |
CH3 |
CH3 |
100 |
1.602 |
2.352778 |
-0.752778 |
|
21 |
Cl |
Cl |
Cl |
H |
Cl |
12.5 |
2.505 |
2.327175 |
0.172825 |
|
22 |
Cl |
CH3 |
Cl |
H |
Cl |
12.5 |
2.505 |
2.035218 |
0.464782 |
|
23 |
Cl |
Cl |
Cl |
Cl |
H |
100 |
1.602 |
1.759374 |
-0.159374 |
|
24 |
Cl |
Cl |
H |
Cl |
Cl |
1.6 |
3.397 |
3.350928 |
0.039072 |
|
25 |
Cl |
Cl |
Cl |
Cl |
Cl |
25 |
2.204 |
2.151661 |
0.048339 |
|
26 |
CH3 |
CH3 |
Cl |
CH3 |
Cl |
100 |
1.602 |
1.637597 |
-0.037597 |
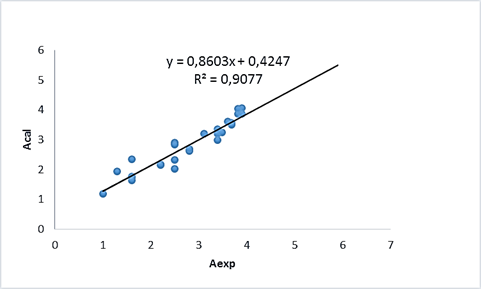
Figure 3. The plot Acal v.s Aexp
The quantum model give a squared correlation coefficient (R²=0.9898), a Root Mean Square Error (RMSE=0.090), an adjusted R-squared (R²adj= 0.9577) and Mean Average Error (MAE= 0.065), also The ISIDA model give a squared correlation coefficient (R²= 0.9077), a Root Mean Square Error (RMSE= 0.277), an adjusted R-squared (R²adj= 0.8351) and Mean Average Error (MAE=0.206). See table (7)
Table 7. The results of QSAR analysis by MLR for Quantum model and ISIDA model for the compounds in series 1-26
|
|
MLR Equation |
n |
R² |
R²adj |
MAE |
RMSE |
|
Quantum model |
Equation (9) |
26 |
0.9898 |
0.9577 |
0.065 |
0.090 |
|
ISIDA model |
Equation (10) |
26 |
0.9077 |
0.8351 |
0.206 |
0.277 |
The QSAR studies were conducted with a series of 26 structures of N-arylanthranilic acid and some useful predictive molecular models were obtained. The physicochemical descriptors were found to have an important role in the determining of the activity. To test the robustness of these models, we evaluate the coefficient of correlation, R², which defines the degree of dependence between theoretical and experimental variables. Two models were studied, quantum model and Structural Molecular Fragment (SMF) model. The two models present a good coefficient correlation, 0.989 and 0.907 respectively. Among the two QSAR models (quantum and ISIDA), results of quantum analysis showed significant predictive power. But the advantages of Structural Molecular Fragment model are the power of fragment descriptors originates from their universality, very high computational efficacy, simplicity of interpretation, as well as their high diversity and versatility.
Part of this work was supported by international foundation of science ﴾ No. F/4893-1﴿ and the third world academy science ﴾ No.10.004RG/CHE/AF /AC-I ﴿. SFK also thank the Humboldt Foundation for equipment.
J.H. Botting. Nonsteroidal antiinflammatory agents. Drugs today (1999), 35, 225-235.
View ArticleS. Prasanna , E. Manivannan, S.C. Chaturvedi, QSAR analyses of conformationally restricted 1,5-diaryl pyrazoles as selective COX-2 inhibitors: application of connection table representation of ligands, Bioorg & Med Chem Let, (2005), 15, 8, 2097-2102.
View ArticleJ.R.Vane and R.M. Botting, new insights into the mode of action of anti-inflammatory drugs. Inflamm. Res. 44(1995) 1-10.
View ArticleJ. G. Hardman and L. E. Limbird (Eds.),Goodman & Gilman's The Pharmacological Basis of Therapeutics, Int. Ed McGraw-Hill, USA, (1996), . 635.
Edmond C. Ku, Warren Lee, Himanshu V. Kothari, Dietrich W. Scholer, Effect of diclofenac sodium on the arachidonic acid cascade. The American Journal of Medicine. Volume 80, Issue 4, 28 April (1986), Pages 18-2 90074-4
View ArticleC. Almansa, J. Alfon, A. F. Arriba, F. L. Cavalcanti, I. Escamilla, L. A. Gomez, A. Miralles, R. Solvia, J. Bartroli, E. Caraceller, M. Merlos, and J. G. Rafanell,J. Synthesis and Structure-Activity Relationship of a New Series of COX-2 Selective Inhibitors: 1,5-Diarylimidazoles. Med. Chem.46 (2003) 3463-3475.
View ArticleJ. R. Mclean and M. I. Gluckman,Arzneim. On the mechanism of the pharmacologic activity of meclofenamate sodium. Forsch.33 (1983) 627-631
H. Kankaanranta, M. Luomala, A. Kosonen, and E. Moilanen,Br. Inhibition by fenamates of calcium influx and proliferation of human lymphocytes J. Pharmacol.119(1996) 487-494.
View ArticleB.K. Tiwari, A. Thakur, M. Thakur, N. D. Pandey, S. S. Narvi, and S. Thakur. Modeling of cytotoxicity on some non- nucleoside reverse transcriptase inhibitors of HIV-1: role of physicochemical parameters. ARKIVOC (2006) (ii) 213-225.
View ArticleVesna Dimova, Katica Colanceska Ragenovic and Vladimir Kakurinov. QSAR of Some N-Aryl/Heteroarylaminomethyl/ethyl-1,2,4-Triazoles Part II: Antimicrobial Activity Against Bacillus Subtilis . Int. J. Mol. Sci. (2006), 7, 119-129.
View ArticleSofie Van Damme. Quantum chemistry in QSAR Quantum chemical descriptors Use, benefits and drawbacks. Thesis submitted in fulfillment of the requirements for the degree of Doctor (Ph.D.) in Sciences: Chemistry, 2009
Ojha Lokendra Kumar , Chaturvedi Ajay M, Bhardwaj Arpan. QSAR study of some TIBO derivatives: A non conventional topological parameter approach. Int. J. Res. Chem. Env. (2011), 16-23
A. Beheshti, P. Norouzi, M. R. Ganjali. A Simple and Robust Model for Predicting the Reduction Potential of Quinones Family; Electrophilicity Index Effect. Int. J. Electrochem. Sci.,7(2012), 4811 -4821.
Gustavo P. ROMANELLI, Juan Carlos AUTINO, Eduardo A. CASTRO. Application of Quantitative Structure-Retention Relationships (QSRR) to a Set of Organic Bromo and Nitrile Derivatives. Turk J Chem 26 (2002), 335-343.
M. Karelson; V.S. Lobanov; A.R. Katritzky, Quantum-Chemical. Descriptors in QSAR/QSPR Studies. Chem Rev, (1996), 96, 1027-1043.
View ArticleAna M. Pajor; Nina N. Sun. nonsteroidal anti-inflammatory drugs and other anthranylic acids inhibit the Na+/ dicarboxylate symporter from taphylococus aureus. Biochemestry (2013), 52, 17, 2924-2932.
View ArticleGaussian 09, Revision A.02, M. J. Frisch, G. W. Trucks, H. B. Schlegel, G. E. Scuseria, M. A. Robb, J. R. Cheeseman, G. Scalmani, V. Barone, B. Mennucci, G. A. Petersson, H. Nakatsuji, M. Caricato, X. Li, H. P. Hratchian, A. F. Izmaylov, J. Bloino, G. Zheng, J. L. Sonnenberg, M. Hada, M. Ehara, K. Toyota, R. Fukuda, J. Hasegawa, M. Ishida, T. Nakajima, Y. Honda, O. Kitao, H. Nakai, T. Vreven, J. A. Montgomery, Jr., J. E. Peralta, F. Ogliaro, M. Bearpark, J. J. Heyd, E. Brothers, K. N. Kudin, V. N. Staroverov, R. Kobayashi, J. Normand, K. Raghavachari, A. Rendell, J. C. Burant, S. S. Iyengar, J. Tomasi, M. Cossi, N. Rega, J. M. Millam, M. Klene, J. E. Knox, J. B. Cross, V. Bakken, C. Adamo, J. Jaramillo, R. Gomperts, R. E. Stratmann, O. Yazyev, A. J. Austin, R. Cammi, C. Pomelli, J. W. Ochterski, R. L. Martin, K. Morokuma, V. G. Zakrzewski, G. A. Voth, P. Salvador, J. J. Dannenberg, S. Dapprich, A. D. Daniels, O. Farkas, J. B. Foresman, J. V. Ortiz, J. Cioslowski, and D. J. Fox, Gaussian, Inc., Wallingfor d CT, 2009.
www chemaxon.com
Solov'ev V., Sukhno I., Buzko V., Polushin A., Marcou G., Tsivadze A., Varnek A. Stability Constants of Complexes of Zn2+, Cd2+, and Hg2+ with Organic Ligands : QSPR Consensus Modeling and Design of New Metal Binders. J. Incl. Phenom. Macrocycl. Chem., 2011,
View ArticleSolov'ev V., Oprisiu I., Marcou G., Varnek A. Quantitative Structure_Property Relationship (QSPR) Modeling of Normal Boiling Point Temperature and Composition of Binary Azeotropes. Ind. Eng. Chem. Res., 2011, 50, No. 24, pp 14162-14167.
View ArticleVarnek A., Solov'ev V. Quantitative Structure-Property Relationships in solvent extraction and complexation of metals. Rev. in Book : Ion Exchange and Solvent Extraction, A Series of Advances. Vol. 19, P. 319-358. A. K. Sengupta and B. A. Moyer, Eds., CRC Press, Taylor and Francis Group : Boca Raton, 2009, 679 pp.
View ArticleSolov'ev, V. P. ; Varnek, A. A. ; Wipff, G. Modelling of Ion Complexation and Extraction Using Substructural Molecular Fragments. J. Chem. Inf. Comput. Sci., 2000, 40, P. 847-858.
View ArticleVarnek, A. A. ; Wipff, G. ; Solov'ev, V. P. Towards an Information System on Solvent Extraction. J. Solvent Extr. Ion. Exch., 2001, 19, No. 5, P.791-837.
View ArticleVarnek, A. A. ; Wipff, G. ; Solov'ev, V. P., Solotnov A.F. Assessment of The Macrocyclic Effect for The Complexation of Crown-Ethers with Alkali Cations Using the Substructural Molecular Fragments Method. J. Chem. Inf. Comput. Sci., 2002, 42, No. 4, P. 812-829.
View ArticleSolov'ev, V. P. ; Varnek, A. Anti-HIV Activity of HEPT, TIBO and Cyclic Urea Derivatives : Structure-Property Studies, Focused Combinatorial Library Generation and Hits Selection Using Substructural Molecular Fragments Method. J. Chem. Inf. Comp. Sci., 2003, 43, No. 5, P. 1703-1719.
View ArticleKatritzky, A.R. ; Fara, D.C. ; Yang, H. ; Karelson, M. ; Suzuki, T. ; Solov'ev, V.P. ; Varnek A. Quantitative Structure-Property Relationship Modeling of ?-Cyclodextrin Complexation Free Energies. J. Chem. Inf. Comput. Sci. 2004, 44, No. 2, 529-541.
View ArticleVarnek, A. ; Fourches, D. ; Solov'ev, V. P. ; Baulin, V. E. ; Turanov, A. N. ; Karandashev, V. K. ; Fara, D. ; Katritzky, A. R. « In Silico » Design of New Uranyl Extractants Based on Phosphoryl-Containing Podands : QSPR Studies, Generation and Screening of Virtual Combinatorial Library and Experimental Tests. J. Chem. Inf. Comput. Sci., 2004, 44, No. 4, 1365-1382.
View ArticleVarnek, A. ; Solov'ev, V. P. « In Silico » Design of Potential Anti-HIV Actives Using Fragment Descriptors. Combinatorial Chem. High Throughput Screening, 2005, 8, No. 5, 403-416.
View ArticleKatritzky, A. R. ; Kuanar, M. ; Fara, D. C. ; Karelson, M. ; Acree, W. E. Jr. ; Solov'ev, V. P. ; Varnek, A. QSAR modeling of blood:air and tissue:air partition coefficients using theoretical descriptors. Bioorg. Med. Chem.,2005, 13, 6450-6463.
View ArticleKatritzky, A. R. ; Dobchev, D. A. ; Fara, D. C. ; Hur, E. ; Tamm, K. ; Kurunczi, L. ; Karelson, M. ; Varnek, A. ; Solov'ev, V. P. Skin Permeation Rate as a Function of Chemical Structure. J. Med. Chem., 2006, 49, No. 11, 3305-3314.
View ArticleKatritzky, A. R. ; Kuanar, M. ; Slavov, S. ; Dobchev, D. A. ; Fara, D. C. ; Karelson, M. ; William, E. ; Acree, W. E. Jr. ; Solov'ev, V. P. ; Varnek, A. Correlation of Blood - Brain Penetration Using Structural Descriptors. Bioorg. Med. Chem., 2006, 14, No. 14, 4888-4917.
View ArticleVarnek, A. ; Fourches, D. ; Sieffert, N. ; Solov'ev, V. P. ; Hill, C. ; Lecomte, M. QSPR Modeling of the AmIII / EuIII Separation Factor : How Far Can We Predict ? Solv. Extr. Ion Exch., 2007, 25, No. 1, P. 1-26.
View ArticleHorvath D., Bonachera F., Solov'ev V., Gaudin C., Varnek A. Stochastic versus Stepwise Strategies for Quantitative Structure - Activity Relationship Generations. - How Much Effort May the Mining for Successful QSAR Models Take? J. Chem. Inf. Model., 2007, 47, No. 3, P. 927-939.
View ArticleVarnek A. ; Fourches D. ; Solov'ev V. ; Klimchuk O. ; Ouadi A. ; Billard I. Successful « In Silico » Design of New Efficient Uranyl Binders. Solv. Extr. Ion Exch., 2007, 25, No. 4, P. 433-462.
View ArticleVarnek A., Fourches D., Horvath D., Klimchuk O., Gaudin С., Vayer P., Solov'ev V., Hoonakker F., Tetko I. V., Marcou G. ISIDA - Platform for Virtual Screening Based on Fragment and Pharmacophoric Descriptors. Cur. Computer-Aided Drug Design, 2008, 4, No. 3, P. 191-198.
View ArticleVarnek A., Fourches D., Kireeva N., Klimchuk O., Marcou G., Tsivadze A., Solov'ev V. Computer-Aided Design of New Metal Binders. Radiochim. Acta, 2008, 96, P. 505-511.
View ArticleA Varnek , D Fourches, F Hoonakker, V P Solov'ev. Substructural fragment: an universal language to encode reactions, molecular and supramolecular structures. J. Comput. Aided Mol. Des., (2005). 19(9-10): P.693-703.
View ArticleView Article
U.Oleg, Diudea, M.V. activity prediction by cluj-simil program. Rev. Roum. Chim. (2003),48(4):321-330
Solov'ev, V.; Varnek, A.; Tsivadze, A., QSPR Ensemble Modelling of the 1:1 and 1:2 Complexation of Co2+, Ni2+, and Cu2+ with Organic Ligands. Relationships between Stability Constants. J. Comput. Aided Mol. Des. (2014), 28, (5), 549-564.
View ArticleVarnek, A.; Kireeva, N.; Tetko, I. V.; Baskin, I. I.; Solov'ev, V. P., Exhaustive QSPR Studies of a Large Diverse Set of Ionic Liquids: How Accurately Can We Predict Melting Points? J. Chem. Inf. Model. (2007), 47, (3), 1111-1122.
View ArticleTetko, I. V.; Solov'ev, V. P.; Antonov, A. V.; Yao, X. J.; Fan, B. T.; Hoonakker, F.; Fourches, D.; Lachiche, N.; Varnek, A., Benchmarking of Linear and Non-Linear Approaches for Quantitative Structure-Property Relationship Studies of Metal Complexation with Organic Ligands. J. Chem. Inf. Model. (2006), 46, (2), 808-819.
View Article