Raymond Kre N’Guessan
Email ID: kre.nguessan@gmail.com
Tel: +225-0747030228
© 2019 Sift Desk Journals. All Rights Reserved
VOLUME: 5 ISSUE: 2
Page No: 585-605
Raymond Kre N’Guessan
Email ID: kre.nguessan@gmail.com
Tel: +225-0747030228
Guy Müller Banquet OKRA [a], Raymond Kre N’Guessan [a] *, Dali Brice [a], Hermann N'Guessan [a], Affiba Florance Kouassi [a]
[a] Laboratoire de Physique Fondamentale et Appliquée (LPFA), University of Abobo Adjamé (now Nangui Abrogoua), Abidjan 02, Côte d’Ivoire;
Author Emails: gmullerokra@gmail.com (G.M.B.O); kre.nguessan@gmail.com (R.K.N.G.), dalibrice@yahoo.fr (D.B.), nerhminos@yahoo.fr (H. N.), akouassi859@yahoo.com (A.F.K.)
Guy Müller Banquet OKRA, Raymond Kre N’Guessan, Dali Brice, Hermann N'Guessan, Affiba Florance Kouassi, Conformational analysis and molecular design of anthranilic acid derivatives as partial agonists of the Farnesoid X Receptor (FXR) with favorable predicted pharmacokinetic profiles(2021)Journal of Computational Chemistry & Molecular Modeling 5(2) p:585-605
We report here virtual design of new anthranilic acid derivatives (AAD) identified as potent partial Farnesoid X receptor (FXR) agonists with favorable predicted pharmacokinetic profiles. By in situ modification of the crystal structure (PDB ID: 3OLF) of FXR complex with a benzimidazole-based partial agonistic ligand, 3D models of 17 FXR:AADx complexes with known observed activity (EC50exp) were prepared to establish a quantitative structure–activity (QSAR) model and linear correlation between relative Gibbs free energy (GFE) of receptor-ligand complex formation (ΔΔGcom) and EC50exp: pEC50exp = -0,1146 ΔΔGcom + 8,175 (#); R2 = 0.98. A 3D QSAR pharmacophore model (PH4) derived from the QSAR directed our effort to design novel AAD analogs. During the design, an initial virtual library of 94501 AAD was focused down to 33134 drug-like compounds and finally, PH4 screened to identify 100 promising compounds. Theoretical EC50 (EC50pre) values of all analogs compounds were predicted by means of equation (#) and their pharmacokinetics (ADME) profiles were computed. More than 12 putative AADs display EC50pre 300 times superior to that of the reported most active training set ligand AAD1.
Keywords: FXR; anthranilic acid derivatives; molecular modeling; QSAR models; pharmacophore; combinatorial library; in silico screening.
Farnesoid X Receptor (FXR), is a member of nuclear receptor family [1]. Soon after the identification of bile acids to be likely the prevailing endogenous ligands of FXR [2] an intense research activity has been devoted to unravel functions of FXR. As a result, it emerges that FXR plays a crucial role in many physiological and pathological processes including bile acid (BA), triglyceride, and glucose homeostasis [3]. For this central biological role, FXR has gained considerable attention as drug target for severe liver disorders and metabolic diseases [4]. FXR ligands might be beneficial for the treatment of primary biliary cirrhosis (PBC), diabetes, dyslipidemia, cancer and other disorders [5,6].
Two decades ago, GW4064 was identified as the first non-steroidal FXR agonist, endowed with a potency of approximately 90 nM on FXR and an efficacy of 140% compared with chenodeoxycholic acid (CDCA) [7]. Meanwhile researchers from both academia and pharmaceutical industry have developed diverse classes of FXR agonists divided into BA derivatives, natural products, and synthetic compounds. 6-ethyl chenodeoxycholic acid (6-ECDCA) and GW4064 were the most important and widely used steroidal and nonsteroidal FXR agonists [8]. Unfortunately it was found that GW4064 is active on sevral off-target [9,10] and have a poor bioavailability or show toxic effects which limit their clinical utility. 6-ECDCA known as INT-747 or OCA has in 2016 been approved by the FDA for PBC treatment and is currently investigated in late stage clinical development for NASH [6, 7,11]. But OCA’s clinical success comes with some major liabilities such as pruritus, high-density lipoprotein cholesterol (HDLc) lowering, low-density lipoprotein cholesterol (LDLc) increase, and a potential for drug-induced liver toxicity[12]. Some of these effects can also be attributed to on-target effects exerted by FXR.
Therefore, research efforts are increasingly focused on developing selective FXR modulators, also known as “selective bile acid receptor modulators” (SBARMs), which should activate or repress specific FXR functions, to reduce side effects up on chronic treatment[13]. Both GW4064 and OCA constitute full agonist. Moreover , it seems that nuclear receptors involved in metabolic processes such as FXR and PPARγ has taught that full activation of a ligand activated transcription factor may lead to various side effects in long-term treatment and that full activation is not necessarily required for beneficial effects[5,14,15]. However, partial agonists can display tissue-specific activation or repression of nuclear receptors, as has been shown for the estrogen receptor partial agonist raloxifen[16].
In the present work our objective was to design novel potent partial agonist. We employed a series of 17 (training set) plus 3 validations set partial FXR agonists based on Anthranilic Acid Derivatives (AAD) reported by Merk et al [15]. Starting with in situ modification of the crystal structure of the complex (PDB ID: 3OLF) with the benzimidazole-based partial agonist (Figure 1). We have built AAD1 (Figure 3) and have elaborated a QSAR model which correlated Gibbs free energies (GFE) of FXR-ADDx complex formation with the potencies EC50exp and determined the active conformation of AADs bound at the active site of FXR (MM-PB complexation approach). Based on this active conformation we have formulated 3D QSAR pharmacophore of FXR activation (PH4). Large virtual library of compounds sharing the AAD scaffold has been generated and in silico screened with the PH4. The screening yielded virtual hits that exhibited predicted activation potencies EC50pre more than 860 times lower than the most active training set compound ADD1. Several of the identified putative activator displayed favorable ADME profiles.
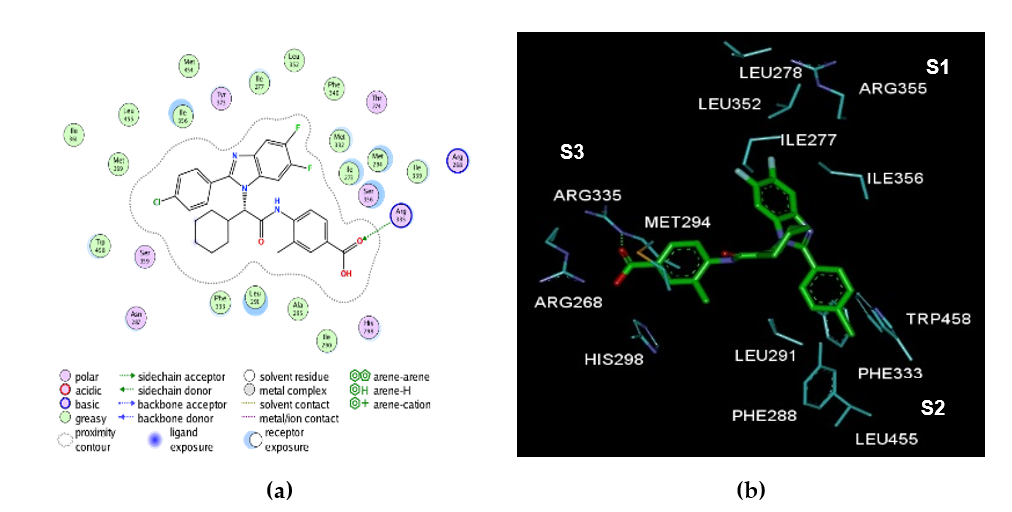
Figure 1. (a) 2D schematic interaction diagram of complexed ligand at the active site of FXR. (b) 3D schematic interaction diagram of complexed ligand at the active site of FXR involving residues that occupy S1, S2, and S3 pockets of the active site.
2.1. Training and Validation Sets
Chemical structures and biological activities (EC50exp) of training and validation sets of anthranilic acid derivatives ligands of FXR used in this study were taken from literature [15].The potencies of these compounds cover a sufficiently broad range of half-maximal effective concentrations (8 ≤ EC50exp ≤ 6900 nM) to allow construction of a QSAR model. The training set (TS) containing 17 AAD ligands and the validation set (VS) including 3 AADs were taken from the ref [15].
2.2. Model Building
Molecular modelling was carried out for the P:L (FXR:AAD) complexes, the free protein FXR. and the free AAD ligands starting from the Crystal structure of human FXR in complex with 4-({(2S)-2-[2-(4-chlorophenyl)-5.6-difluoro-1H-benzimidazol-1-yl]-2 cyclohexylacetyl}amino)-3-methylbenzoic acid (PDB code 3OLF. resolution 1.90 Å) using Insight II molecular modelling program Insight-II [29].
The structures of FXR and the P-L complexes were considered to be at pH of 7 with neutral N and C-terminal residues and all protonizable and ionizable residues charged. No crystallographic water molecules were included in the model. The ligands were built into the reference structure 3OLF by in situ replacing of derivatized groups in the molecular scaffold of the template ligand AAD1. An exhaustive conformational search over all rotatable bonds of the replacing function groups coupled with a careful gradual energy-minimization of the modified ligand and active site residues of the FXR located in the vicinity of the ligand(within 5 Å distance) was employed to identify low-energy bound conformations of the modified ligand. The resulting low-energy structures of the P-L complexes were then carefully refined by minimization of the whole complex.
This procedure has been successfully used for model building of viral, bacterial, and protozoal enzyme–inhibitor complexes and design of peptidomimetic. Hydroxynaphthoic, thymidine, triclosan, pyrrolidine carboxamide, nitriles, chalcone-based, Benzamide inhibitors [18,23,24,30].
2.3. Molecular Mechanics
Modeling of ligands. FXR and P-L complexes was carried out by molecular mechanics using CFF91 force field [31] as described earlier [18].
2.4. Conformational Search
Free ligand conformations were derived from their bound conformations in the P-L complexes by gradual relaxation to the nearest local energy minimum as described earlier [18].
2.5. Solvation Gibbs Free Energies
The electrostatic component of solvation Gibbs free energy (GFE) that includes also the effects of ionic strength via solving nonlinear Poisson–Boltzmann equation [32,33] was computed by the DelPhi module in Discovery Studio [21] as described earlier [18].
2.6. Calculation of Binding Affinity and QSAR Model
The calculation of binding affinity expressed as complexation GFE has been described fully earlier [18].
2.7. Interaction Energy
The calculation of MM interaction energy (Eint) between protein residues and the ligand CFF91 force field [31] was performed as described earlier [18].
2.8. Pharmacophore Generation
Bound conformations of ligands taken from the models of P-L complexes were used for constructing of 3D-QSAR pharmacophore (PH4) by means of Catalyst HypoGen algorithm [34] implemented in Discovery Studio [21] as described earlier [18].
2.9. ADME Properties
The pharmacokinetics profile of AADs were computed by the QikProp program [27] as described earlier [18].
2.10. Virtual Library Generation
The virtual library generation was performed as described earlier [18].
2.11. ADME-Based Library Searching
The drug-likeness selection criterion served to focus the initial virtual library as described earlier [18].
2.12. Pharmacophore-Based Library Searching
The pharmacophore model (PH4) described in Section 4.8 and derived from the bound conformations of AADs at the active site of FXR served as library searching tool as described earlier [18].
2.13. Activation Potency Prediction
The conformer with the best mapping on the PH4 pharmacophore in each cluster of the focused library subset was used for ∆∆Gcom calculation and EC50pre estimation (virtual screening) by the complexation QSAR model as described earlier [18].
3.1. Training and Validation Sets
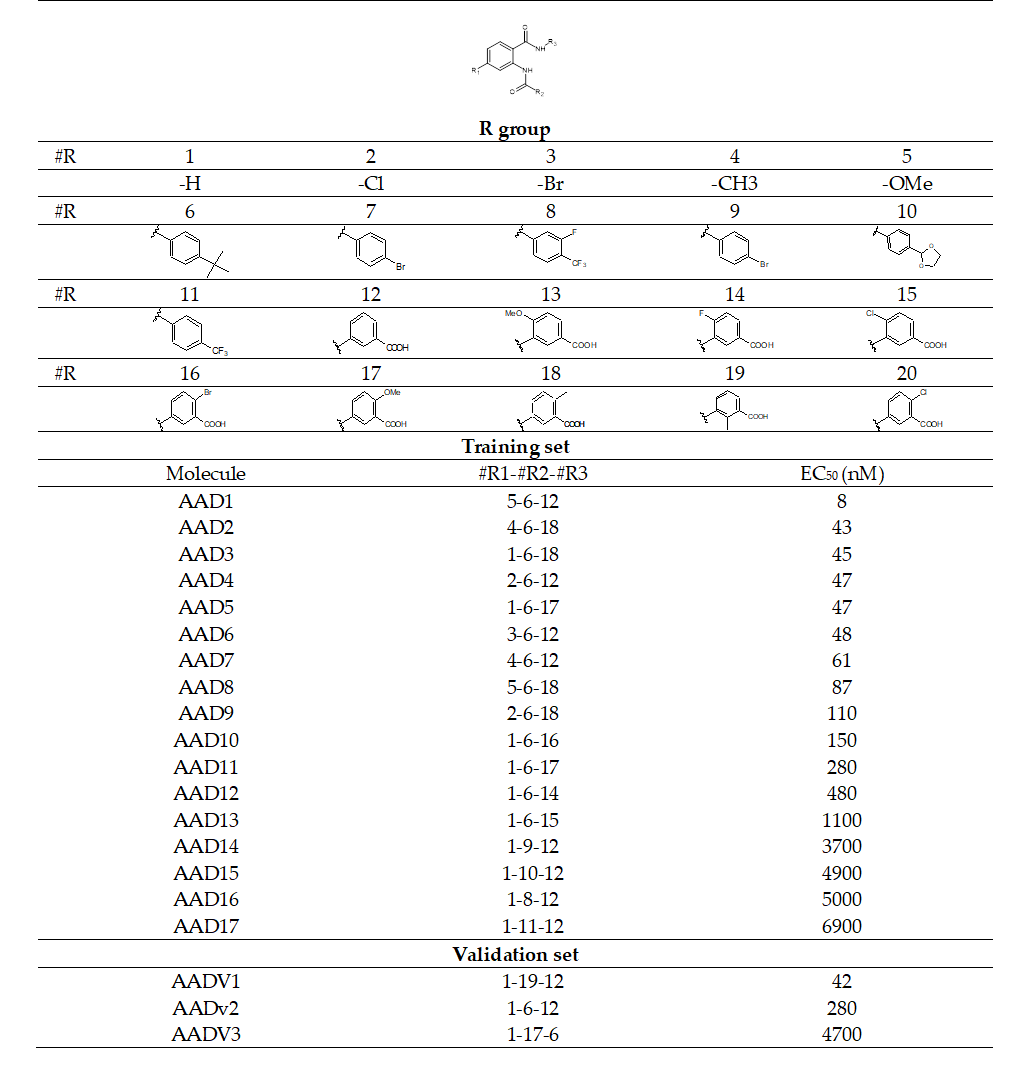
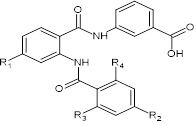
The training set of 17 AADs and validation set of another 3 ligands (Table 1) were selected from the structure-activity relationship (SAR) of anthranilic acid derivatives as partial FXR agonists reported by Merck and al [15]. The whole series was obtained by variations at three positions R1, R2 and R3 of the aromatic ring and amide group as shown in (Table 1). The experimental half - maximal effective concentration (EC50) (8 ≤ EC50exp ≤ 6900 nM) [15] cover a sufficiently wide concentration range for building of a reliable QSAR model. The ratio between the sizes of training and validation sets remains a critical point of correct classification but is limited by the count of the set of homologous compounds available from the literature[17].
Table 1. Training Set (AAD1-17) and validation set (AADV1-3) of FXR activation [15] used in the preparation of QSAR models of activation binding. The R1, R2 and R3 groups are numbered in the first part of the Table as #R _ group index
3.2. QSAR Model
3.2.1. One Descriptor QSAR Models
Each of the 17 training sets (TS) and 3 validation sets (VS) FXR-AADx complexes (Table1), was prepared by in situ modification of the complex (PDB ID: 3OLF) [15] with the benzimidazole-based partial agonistic ligand as described in the Methods section. Further, the relative Gibbs free energy (GFE) of the FXR-AADs complex formation (DDGcom) was computed for each of the 20 optimized FXR-AADs complexes. Table 2 lists computed values of DDGcom and its components as defined in Equation (7) [18], for the TS and VS of AADx [15]. The QSAR model explained variation in the ADDs experimental activation potencies (pEC50exp = -log10(EC50exp) [15].) by correlating it with computed GFE DDGcom through linear regression (Equation (8) [18], Table 2).In addition, significant correlation obtained in this QSAR relationship permitted to determine the active bound conformation of the AADs at the FXR binding site and enabled definition of the PH4 pharmacophore. In search for a better insight into the binding affinity of AADs towards FXR, we have analyzed the enthalpy of complexation in gas phase DDHMM by correlating it with the pEC50exp. The validity of this linear correlation (for statistical data of the regression see Table 3, Equation A) allowed assessment of the significance of receptor-ligand (R-L) interactions (DDHMM) when solvent effect and loss of entropy of the ligand upon binding to the protein were neglected. This correlation explained about 98% of the pEC50exp data variation and underlined the role of the enthalpic contribution to the binding affinity of the ligand. Similarly, the more advanced descriptor, namely the GFE of the FXR:AADx complex formation including all components: DDHMM, DDTSvib and DDGsol, has been assessed (for statistical data see Table 3, Equation B). Relatively high values of the regression coefficient R2, leave-one-out cross-validated regression coefficient R2xv and Fischer F-test of the correlation suggest strong relationship between the 3D model of ligand binding and the observed activation potencies of the AADs [15]. Therefore, structural information derived from the 3D models of FXR:ADDx complexes can be expected to lead to reliable prediction of FXR activation potencies for new AADs analogs based on the QSAR model B, (Table 3).
Table 2. Gibbs free energy (binding affinity) and its components for the training set of FXR ligands AAD1-17 and validation set ligands AADV1-3 [15].
|
Training set a |
Mw b |
ΔΔHMM c |
ΔΔGsol d |
ΔDTSvib e |
ΔΔGcom f |
EC50ex g |
|
AAD1 |
445 |
0 |
0 |
0 |
0 |
8 |
|
AAD2 |
443 |
7.5 |
0.41 |
1.43 |
6.45 |
43 |
|
AAD3 |
429 |
7.9 |
-2.84 |
-1.92 |
7.02 |
45 |
|
AAD4 |
449 |
6.4 |
-4.03 |
-5.29 |
7.62 |
47 |
|
AAD5 |
445 |
8.4 |
-1.21 |
-0.10 |
7.28 |
47 |
|
AAD6 |
494 |
6.8 |
-4.56 |
-6.21 |
8.48 |
48 |
|
AAD7 |
429 |
8.8 |
-3.53 |
-2.61 |
7.84 |
61 |
|
AAD8 |
459 |
15.2 |
-2.92 |
1.37 |
10.92 |
87 |
|
AAD9 |
463 |
10.4 |
-3.78 |
-3.71 |
10.32 |
110 |
|
AAD10 |
494 |
9.5 |
-4.13 |
-5.94 |
11.32 |
150 |
|
AAD11 |
449 |
12.1 |
-2.43 |
-5.42 |
15.08 |
280 |
|
AAD12 |
433 |
14. |
-1.48 |
-5.28 |
17.81 |
480 |
|
AAD13 |
449 |
19.4 |
-5.4 |
-5.7 |
19.9 |
1100 |
|
AAD14 |
437 |
31.4 |
-12.7 |
-5.1 |
23.9 |
3700 |
|
AAD15 |
417 |
31.2 |
-12.7 |
-3.7 |
22.2 |
4900 |
|
AAD16 |
445 |
29.9 |
-11.08 |
-6.4 |
25.3 |
5000 |
|
AAD17 |
427 |
31.8 |
-11.5 |
-6.1 |
26.3 |
6900 |
|
Validation set a |
Mw b |
ΔΔHMM c |
ΔΔGsol d |
ΔDTSvi e |
ΔΔGcom f |
EC50exp/EC50exp h |
|
AADV1 |
426 |
6.29 |
-2.26 |
-3.74 |
7.77 |
1.00 |
|
AADV2 |
415 |
14.6 |
-2.84 |
-3.74 |
15.51 |
1.00 |
|
AADV3 |
445 |
29.2 |
-4.25 |
0.23 |
24.73 |
1.01 |
afor the chemical structures of the training set of ligands see Table 1; b Mw is the molar mass (g.mol-1) of ligands; c DDHMM (kcal.mol-1) is the relative enthalpic contribution to the GFE change related to R-L complex formation derived by MM; DDHMM ≈ [EMM{R-Lx} - EMM{Lx}] [EMM{R-Lref} - EMM{Lref}], Lref is the reference ligand AAD1; d DDGsol (kcal.mol-1) is the relative solvent effect contribution to the GFE change of R-L complex formation: DDGsol = [Gsol{R-Lx} - Gsol{Lx}] - [Gsol{R-Lref} - Gsol{Lref}]; e DDTSvib (kcal.mol-1) is the relative entropic contribution of ligand to the GFE of R-Lx complex formation: DDTSvib = [TSvib{Lx}E - TSvib{Lx}] - [TSvib{Lref}E - TSvib{Lref}]; f DDGcom (kcal.mol-1) is the overall relative GFE change of R-Lx complex formation: DDGcom ≈ DDHMM + DDGsol − DDTSvib; g EC50exp is the experimental half-maximal effective concentration of FXR obtained from ref15; h ratio of predicted and experimental half-maximal effective concentration pEC50pre/pEC50exp(pEC50pre=-log10EC50pre) was predicted from computed DDGcom using the regression equation for FXR shown in Table 3, B.
Table 3. Analysis of computed binding affinities DDGcom, its enthalpic component DDHMM, and experimental half-maximal effective concentration pEC50pre = -log10EC50pre of AADs towards FXR [15].
|
Statistical Data of Linear Regression |
(A) |
(B) |
|
pEC50exp = -0,0856DDHMM + 7,90915 (A) |
|
|
|
pEC50exp = -0,1146DDGcom + 8,1746 (B) |
|
|
|
Number of compound n |
17 |
17 |
|
Squared correlation coefficient of regression |
0,94 |
0,98 |
|
LOO cross-validated squared correlation coef. |
0,94 |
0,98 |
|
Standard error of regression s |
0,224 |
0,117 |
|
Statistical significance of regression, Fisher F-test |
242,91 |
926,68 |
|
Level of statistical significance α |
˃95% |
˃95% |
|
Range of activities EC50exp [nM] |
8– 6900 |
8–6900 |
The statistical data confirmed validity of the correlation Equations (A) and (B) plotted on Figure 2.The ratio pEC50pre/pEC50exp 1 (the pEC50pre values were estimated using correlation Equation B,Table 3) calculated for the validation set AADV1-3 documents the substantial predictive power of the complexation QSAR model from Table 2. Thus, the regression Equation B (Table 3) and computed DDGcom GFEs can be used for prediction of activator potencies EC50pre against FXR for novel AAD analogs, provided they share the same binding mode as the training set AAD1-19.
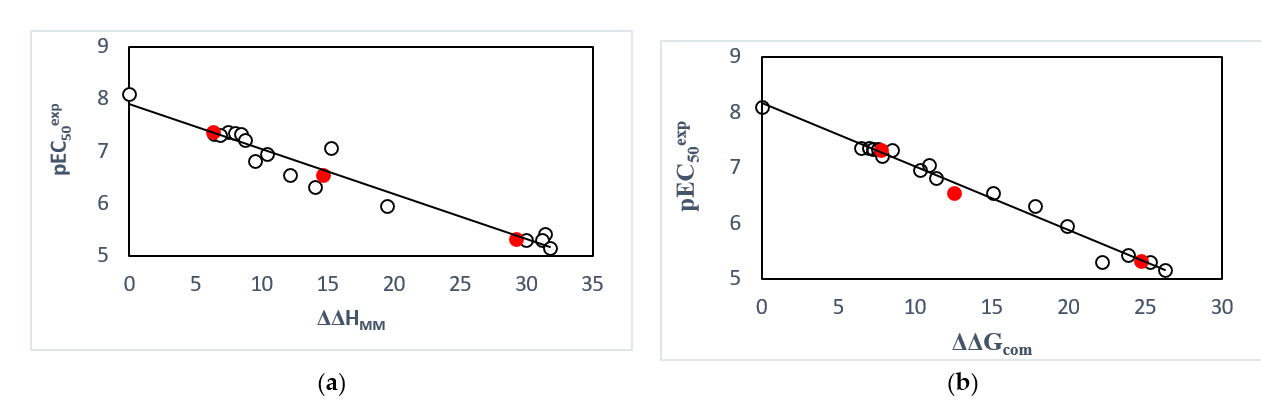
Figure 2. (a) plot of correlation equation between pEC50exp and relative enthalpic contribution to the GFE (Equation (6)) DDHMM [kcal.mol-1]. (b) similar plot for relative complexation Gibbs free energies of the FXR-AADx complex formation DDGcom [kcal.mol-1] of the training set [15]. The validation set data points are shown in red color.
3.2.2. Binding Mode of AAD
To date, we have over 60 FXR structures registered in the protein database (PDB) [13]. Among the cocrystal structures of the FXR-LBD, the complex (PDB ID: 3OLF) with the benzimidazole-based partial agonistic ligand seemed most suited for docking studies on the here reported partial FXR agonists. The ligand binding site reveal a triangular ligand binding pocket (S1, S2, S3) [15].
Of our Structural investigation receptor-ligand interactions retrieved from the crystal structure of FXR: AAD1 complex [15] showed that AADs scaffold is well suited to orient its substituents R1, R2 and R3 into the three binding pockets (S1, S2, S3) of the active site. As indicated in Figure 3, in catalytic site, in pocket S3, it’s formed prominent polar interactions in between the carboxylic acid head group and Arg335 [5,15.19,20]. Previous studies suggested hydrophobic interaction of groups at pocket (S2) with Trp458, Leu455, Ph333 and Leu291 seemed to stabilize the compound within the binding site, thus contributing greater activity [8]. However contribution of residue of pocket (S1) are not yet well known. Consequently, the obtained 3D-QSAR models and Eint could provide valuable guidance for future design of new potent partial FXR agonists with an anthranilic acid scaffold.
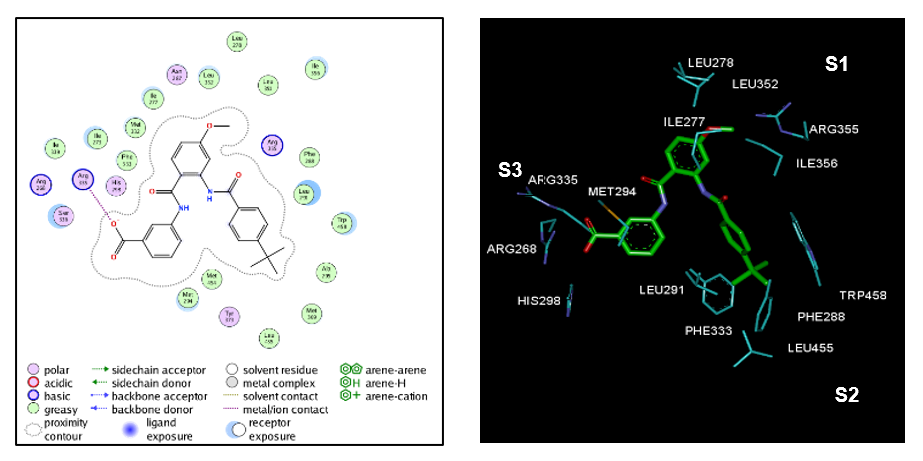
Figure 3. (Left) 2D schematic interaction diagram of the most potent ligand AAD1 [15] at the active site of FXR. (Right) 3D schematic interaction diagram of AAD1 at the active site of FXR involving residues that occupy S1, S2, and S3 pockets of the active site.
3.3. Interaction Energy
More structural information was provided by the interaction energy (IE, DEint) diagram obtained for training set. R:L breakdown to contributions from FXR active site residue is helpful for the choice of relevant R groups which could improve the binding affinity of AAD analogs to the FXR and subsequently enhance the ligand potency. In FXR:AADx complexes is listed in Table 4 along with its correlation between that energy with observed ligand potency (EC50exp) plotted in Figure 4. The quality of this correlation (69% and 81%) opens the gate to a deeper analysis of the intermolecular interaction energy Eint variation in blight with structural requirement of FXR activation namely the active site pockets filling.
The prominent role of the van der Waals (vdW) component of Eint in the binding affinity to FXR is highlighted by the correlation between individual contributions to the overall Eint. In addition, to assess the impact of the residues occupying individual active site pockets (S1, S2, S3,) we have analyzed their contribution to the overall Eint (Table 5, 6, 7; Figure 5).The contribution of all the three pockets together explained 85% of the FXR activation potencies of the training set ligand. This fell down to 32% when removing the contribution of the S1 pocket and 36% when removing S2 pocket. However contribution of the two pockets S1 and S2 together explained 93%. The filling of the S1 and S2 pockets by function groups of the ligands is therefore crucial for enhance affinity FXR-AAD1-17.
Thus, our virtual FXR-ligand design prioritized optimal filling of the S1 and S2 pockets by the AAD analogs. We have adopted a combinatorial approach to novel ADD analogs design and in silico screened a virtual library of 33134 AAD analogs with help of the PH4 pharmacophore of FXR activation derived from the complexation QSAR model.
Table 4. Receptor–ligand FXR-ADDx overall intermolecular interaction energy Eint (kcalmol-1).
|
Training set a |
Ewdv b |
Eele c |
Eint d |
ΔEint |
pEC50exp e |
|
AAD1 |
-72.93 |
18.34 |
-54.59 |
0.00 |
8.10 |
|
AAD2 |
-72.93 |
18.89 |
-54.05 |
0.55 |
7.37 |
|
AAD3 |
-70.00 |
16.72 |
-53.28 |
1.31 |
7.35 |
|
AAD4 |
-70.25 |
16.02 |
-54.22 |
0.37 |
7.33 |
|
AAD5 |
-70.96 |
19.77 |
-51.19 |
3.40 |
7.33 |
|
AAD6 |
-71.15 |
15.23 |
-55.91 |
-1.32 |
7.32 |
|
AAD7 |
-69.13 |
19.02 |
-50.12 |
4.48 |
7.21 |
|
AAD8 |
-73.80 |
18.36 |
-55.44 |
-0.84 |
7.06 |
|
AAD9 |
-70.53 |
19.11 |
-51.42 |
3.17 |
6.96 |
|
AAD10 |
-69.74 |
18.25 |
-51.49 |
3.11 |
6.82 |
|
AAD11 |
-68.16 |
18.73 |
-49.44 |
5.16 |
6.55 |
|
AAD12 |
-67.68 |
15.59 |
-52.09 |
2.50 |
6.32 |
|
AAD13 |
-67.32 |
15.75 |
-51.57 |
3.02 |
5.96 |
|
AAD14 |
-57.91 |
18.43 |
-39.47 |
15.12 |
5.43 |
|
AAD15 |
-64.27 |
16.55 |
-47.72 |
6.87 |
5.31 |
|
AAD16 |
-61.91 |
17.28 |
-44.47 |
10.12 |
5.30 |
|
AAD17 |
-60.76 |
17.44 |
-43.33 |
11.27 |
5.16 |
a For the chemical structures of the training set of ligands see Table 1. b van der Walls component of non-bonded of interaction energy. c Electrostatic component of non-bonded interaction energy. d Eint is the interaction energy of two sets of atoms, one set represents residues of the FXR the other the ligand: Eint = Evdw + Eele. e EC50 exp is the experimental half-maximal effective concentrations of AADs towards FXR [15] , pEC50exp = -log10(EC50 exp).
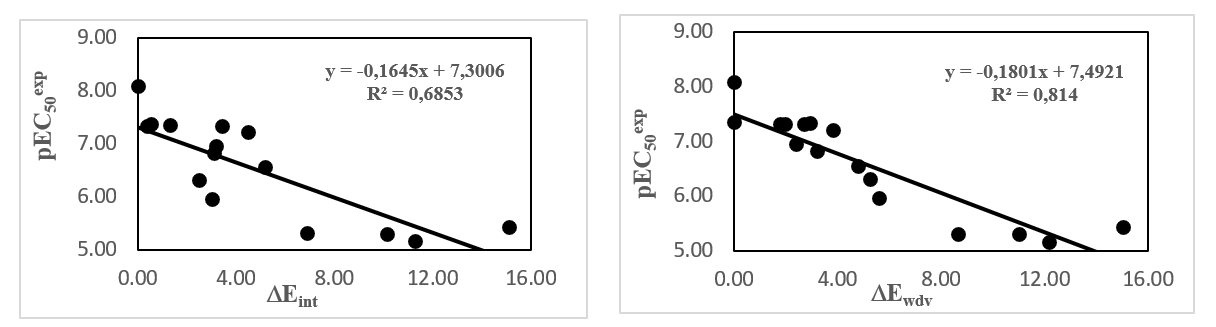
Figure 4. Active site residue contribution to Eint in FXR-AADx complex (kcal.mol-1).
Table 5. Active site residue contribution to Eint in FXR-AADx complex (kcal.mol-1).
|
|
S1 |
||||||
|
Residue |
Ile 277 |
Ile 278 |
Leu 352 |
ILe 356 |
Arg 355 |
Total |
pEC50exp |
|
AAD1 |
-3.6 |
-1.8 |
-2.1 |
-3.1 |
-6.6 |
-17.2 |
8.10 |
|
AAD2 |
-2.6 |
-1.2 |
-1.4 |
-2.8 |
-6.0 |
-14.0 |
7.37 |
|
AAD3 |
-3.0 |
-1.5 |
-1.3 |
-2.7 |
-5.6 |
-14.1 |
7.35 |
|
AAD4 |
-2.5 |
-1.0 |
-1.4 |
-2.6 |
-5.9 |
-13.3 |
7.33 |
|
AAD5 |
-2.8 |
-1.2 |
-1.2 |
-3.0 |
-5.8 |
-14.0 |
7.33 |
|
AAD6 |
-2.5 |
-1.0 |
-1.4 |
-2.6 |
-5.8 |
-13.3 |
7.32 |
|
AAD7 |
-2.3 |
-0.9 |
-1.3 |
-2.8 |
-5.8 |
-13.1 |
7.21 |
|
AAD8 |
-3.0 |
-1.2 |
-2.4 |
-1.0 |
-6.7 |
-14.3 |
7.06 |
|
AAD9 |
-2.3 |
-1.0 |
-1.4 |
-2.9 |
-6.4 |
-13.9 |
6.96 |
|
AAD10 |
-2.6 |
-1.1 |
-1.2 |
-2.8 |
-5.8 |
-13.5 |
6.82 |
|
AAD11 |
-2.0 |
-0.5 |
-0.8 |
-2.6 |
-5.4 |
-11.1 |
6.55 |
|
AAD12 |
-2.4 |
-0.8 |
-1.0 |
-2.7 |
-5.5 |
-12.3 |
6.32 |
|
AAD13 |
-1.7 |
-0.4 |
-0.7 |
-2.5 |
-5.4 |
-10.6 |
5.96 |
|
AAD14 |
-1.8 |
-0.4 |
-0.7 |
-2.5 |
-5.4 |
-10.8 |
5.43 |
|
AAD15 |
-1.4 |
-0.3 |
-0.8 |
-2.2 |
-4.9 |
-15.1 |
5.31 |
|
AAD16 |
-1.5 |
-0.3 |
-0.6 |
-2.1 |
-5.0 |
-9.6 |
5.30 |
|
AAD17 |
-1.4 |
-0.2 |
-0.8 |
-2.0 |
-5.1 |
-9.5 |
5.16 |
Table 6. Active site residue contribution to Eint in FXR-AADx complex (kcal.mol-1).
|
|
S2 |
||||||
|
Residue |
Phe 288 |
Phe 333 |
Met 454 |
Leu 455 |
Trp 458 |
Total |
pEC50exp |
|
AAD1 |
-1.5 |
-3.7 |
-1.5 |
-1.2 |
-4.9 |
-12.8 |
8.10 |
|
AAD2 |
-1.6 |
-3.9 |
-1.5 |
-1.4 |
-5.7 |
-14.1 |
7.37 |
|
AAD3 |
-1.5 |
-3.7 |
-1.6 |
-1.4 |
-5.0 |
-13.2 |
7.35 |
|
AAD4 |
-1.5 |
-3.9 |
-1.7 |
-1.3 |
-4.9 |
-13.2 |
7.33 |
|
AAD5 |
-1.5 |
-4.0 |
-1.5 |
-1.4 |
-5.2 |
-13.5 |
7.33 |
|
AAD6 |
-1.5 |
-4.0 |
-1.6 |
-1.1 |
-4.6 |
-12.9 |
7.32 |
|
AAD7 |
-1.4 |
-4.0 |
-1.5 |
-1.4 |
-5.1 |
-13.3 |
7.21 |
|
AAD8 |
-1.9 |
-3.0 |
-1.2 |
-0.1 |
-5.5 |
-11.7 |
7.06 |
|
AAD9 |
-1.4 |
-3.9 |
-1.5 |
-1.3 |
-5.2 |
-13.4 |
6.96 |
|
AAD10 |
-1.5 |
-3.9 |
-1.6 |
0.0 |
-5.3 |
-12.4 |
6.82 |
|
AAD11 |
-1.2 |
-4.0 |
-1.5 |
-1.4 |
-4.9 |
-13.1 |
6.55 |
|
AAD12 |
-1.4 |
-4.0 |
-1.5 |
-1.3 |
-5.3 |
-13.5 |
6.32 |
|
AAD13 |
-1.2 |
-4.1 |
-1.6 |
-1.2 |
-5.3 |
-13.5 |
5.96 |
|
AAD14 |
-1.1 |
-3.4 |
-1.7 |
-1.3 |
-4.9 |
-12.3 |
5.43 |
|
AAD15 |
-0.3 |
-3.0 |
-1.3 |
-1.0 |
-1.8 |
-7.5 |
5.31 |
|
AAD16 |
-1.4 |
-4.0 |
-2.4 |
-1.4 |
-3.0 |
-12.1 |
5.30 |
|
AAD17 |
-0.9 |
-3.9 |
-2.2 |
-1.3 |
-2.8 |
-11.1 |
5.16 |
Table 7. Active site residue contribution to Eint in FXR-AADx complex (kcal.mol-1).
|
|
S3 |
|||||
|
Residue |
Arg 268 |
Met 294 |
His 298 |
Arg 335 |
Total |
pEC50exp |
|
AAD1 |
-11.9 |
-4.9 |
-2.4 |
-20.6 |
-39.7 |
8.10 |
|
AAD2 |
-11.0 |
-5.2 |
-2.9 |
-21.8 |
-40.9 |
7.37 |
|
AAD3 |
-11.7 |
-5.3 |
-2.9 |
-21.9 |
-41.8 |
7.35 |
|
AAD4 |
-12.1 |
-4.9 |
-2.4 |
-21.7 |
-41.2 |
7.33 |
|
AAD5 |
-10.8 |
-5.6 |
-3.1 |
-20.4 |
-39.8 |
7.33 |
|
AAD6 |
-12.5 |
-4.9 |
-2.5 |
-22.5 |
-42.4 |
7.32 |
|
AAD7 |
-11.6 |
-4.8 |
-2.4 |
-21.5 |
-40.3 |
7.21 |
|
AAD8 |
-10.7 |
-4.7 |
-2.7 |
-21.9 |
-40.1 |
7.06 |
|
AAD9 |
-11.3 |
-5.2 |
-2.9 |
-21.2 |
-40.6 |
6.96 |
|
AAD10 |
-10.9 |
-5.2 |
-2.8 |
-22.0 |
-40.9 |
6.82 |
|
AAD11 |
-11.8 |
-4.8 |
-2.4 |
-21.9 |
-40.9 |
6.55 |
|
AAD12 |
-11.2 |
-5.1 |
-2.8 |
-21.9 |
-41.0 |
6.32 |
|
AAD13 |
-12.0 |
-4.9 |
-2.5 |
-22.7 |
-42.2 |
5.96 |
|
AAD14 |
-12.1 |
-5.1 |
-2.5 |
-23.2 |
-42.9 |
5.43 |
|
AAD15 |
-11.5 |
-4.8 |
-2.5 |
-22.5 |
-41.2 |
5.31 |
|
AAD16 |
-11.7 |
-5.3 |
-2.6 |
-23.4 |
-42.9 |
5.30 |
|
AAD17 |
-12.0 |
-4.8 |
-2.5 |
-22.8 |
-42.1 |
5.16 |
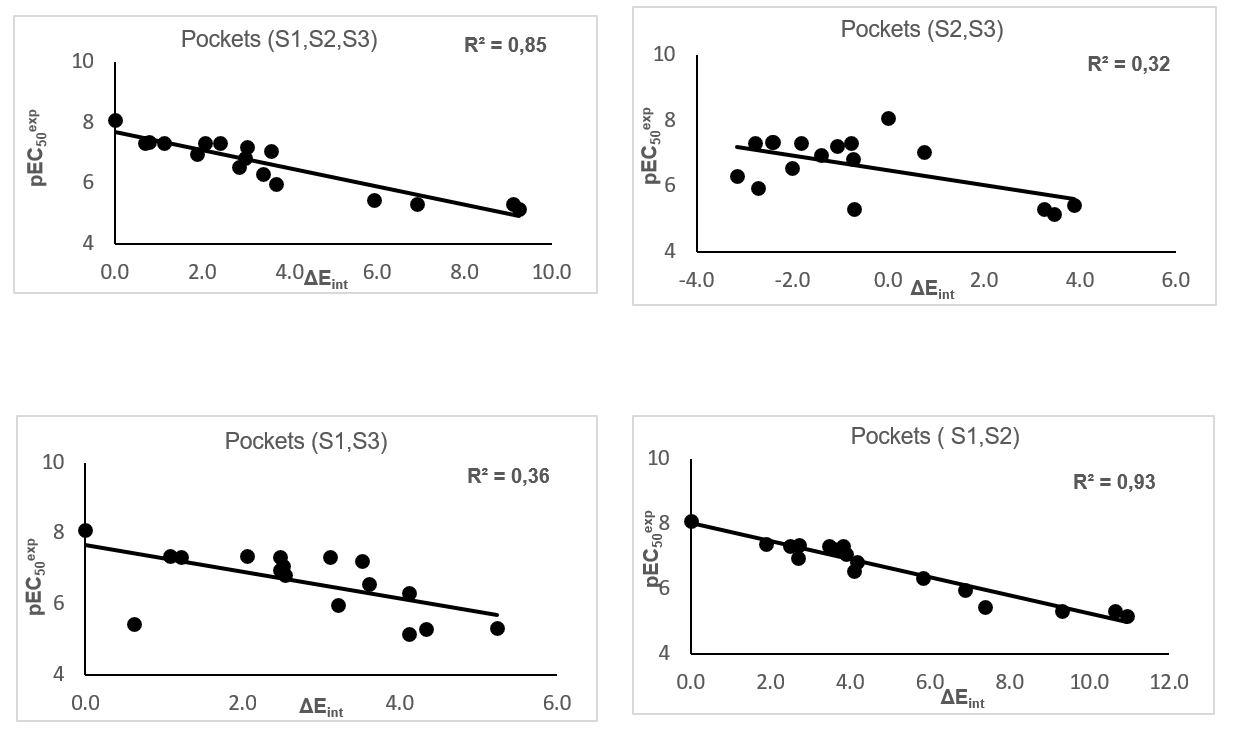
Figure 5. Plot of the correlation between interaction energies of residues belonging to individual active site pockets (S1, S2, S3) and observed activities pEC50exp.
3.4. QSAR Pharmacophore Model
3.4.1. FXR Active Site Pharmacophore
The interaction generation protocol molecular modeling program [21] provides the pharmacophore features of the active site of a protein. FXR predominantly displays hydrophobic features at the active site (Figure 1) as confirmed by previously reported works [15]. The largest being the hydrophobic pocket S2 if it accommodates large groups here then the activity of the ligand would be improved. While it is suggested that the agonist activity would be decreased by the introduction of large groups in the aliphatic pocket S1 [8]. On the other hand, judicious investigation of this pocket S1 could also improve the activity of the ligand.
3.4.2. Generation and Validation of 3D-QSAR Pharmacophore
FXR activation 3D-QSAR pharmacophore was generated from the active conformation of 17 TS AAD1-17 and evaluated by 3 VS AADV1-3 covering a large range of experimental activity (8–6900 nM) spanning more than two orders of magnitude. The generation process is divided into three main steps: (i) the constructive step, (ii) the subtractive step and (iii) the optimization step [21].
During the constructive phase. AAD1 alone was retained as the lead (since only the activity of AAD1 fulfilled the threshold criterion. EC50exp ≤ 2 ×20 nM) and used to generate the starting PH4 features. In the subtractive phase, compounds for which EC50exp > 8×103.5 nM = 25.298 nM were considered inactive. Accordingly none of the training set AADx was inactive and no starting PH4 features were removed. Finally, during the optimization phase, the score of the pharmacophoric hypotheses was improved. Hypotheses were scored according to errors in activity estimates from regression and complexity via a simulated annealing approach. At the end of the optimization, the top scoring 10 unique pharmacophore hypotheses were kept, all displaying five-point features. The cost values, correlation coefficients, root-mean square deviation (RMSD) values, the pharmacophore features, and the max-fit value of the top 10 ranked hypotheses (Hypo1- Hypo10) are listed in Table 8. They were selected based on significant statistical parameters, such as high correlation coefficient, low total cost, and low RMSD (Table 8).
The generated pharmacophore models were then assessed for their reliability based on the calculated cost parameters ranging from 91.56 (Hypo1) to 180.00 (Hypo10). The relatively small gap between the highest and lowest cost parameter corresponds well with the homogeneity of the generated hypotheses and consistency of the TS of AADx. For this PH4 model, the fixed cost (41.53) is lower than the null cost (773.28) by a difference Δ = 731.75. This difference is a major quality indicator of the PH4 predictability (Δ > 70 corresponds to an excellent chance or a probability higher than 90% that the model represents a true correlation [21]. To be statistically significant, a hypothesis has to be as close as possible to the fixed cost and as far as possible from the null cost. For the set of 10 hypotheses, the difference Δ ≥ 593.28 which attests to the high quality of the pharmacophore model. The standard indicators such as the RMSD between the hypotheses ranged from 2.03 to 4.03, and the squared correlation coefficient (R2) falls to an interval from 0.98 to 0.90. The first PH4 hypothesis with the closest cost (91.56) to the fixed one (41.53) and best RMSD and R2 was retained for further analysis. The statistical data for the set of hypotheses (costs, RMSD, R2) are listed in Table 8. The configuration cost (10.94 for all hypotheses) far below 17 confirms this pharmacophore as a reasonable one.
The link between the 98% significance and the number 49 scrambled runs of each hypothesis is based on the formula S = [1 - (1 + X)/Y] × 100. with X the total number of hypotheses having a total cost lower than the original hypothesis (Hypo 1) and Y the total number of HypoGen runs (initial + random runs): X = 0 and Y = (1 + 49), hence 98% = {1 - [(1 + 0)/(49 + 1)]}×100. The evaluation of Hypo 1 was performed first through Fischer’s randomization cross-validation test. The CatScramble program was used to randomize the experimental activities of the training set. At 98% confidence level, each of the 49 scramble runs created ten valid hypotheses, using the same features and parameters as in the generation of the original 10 pharmacophore hypotheses. Among them, the cost value of Hypo1 is the lowest compared with those of the 49 randomly generated hypotheses, as we can see in Table 8 where the lowest cost of the 49 random runs is listed for each original hypothesis and none of them was as predictive as the original hypotheses generated shown in Table 8. Thus, there is a 98% probability that the best selected hypothesis Hypo1 represents a pharmacophore model for activation activity of AADs with a similar level of predictive power as the complexation QSAR model, which relies on from 3D structures of the FXR-AADx complexes and computed GFE of protein–ligand binding ΔΔGcom. Another evaluation of Hypo 1 is the mapping of the best active training set AAD1 (Figure 8) displaying the geometry of the Hypo1 pharmacophore of FXR activation. The regression equation for pEC50exp vs. pEC50pre estimated from Hypo1: pEC50exp = 1.024× pEC50pre - 0.16 (n = 17. R2 = 0.95. Rxv2 = 0.95. F-test = 306.70. σ = 0.2, α > 98 %) is also plotted on Figure 6.
Table 8. Parameters of 10 generated PH4 pharmacophoric hypotheses for FXR ligand after Cat-Scramble validation procedure (49 scrambled runs for each hypothesis at the selected level of confidence of 98%).
|
Hypothesis |
RMSD a |
R2 b |
Total cost c |
Costs Difference d |
Closest Random e |
|
Hypo 1 |
2.03 |
0.98 |
91.56 |
681.72 |
240.075 |
|
Hypo 2 |
2.68 |
0.96 |
110.7 |
662.58 |
281.52 |
|
Hypo 3 |
2.77 |
0.96 |
114.56 |
658.72 |
293.836 |
|
Hypo 4 |
3.50 |
0.93 |
146.89 |
626.39 |
295.49 |
|
Hypo 5 |
2.78 |
0.96 |
149.16 |
624.12 |
363.251 |
|
Hypo 6 |
3.61 |
0.93 |
152.28 |
621 |
403.878 |
|
Hypo 7 |
3.91 |
0.91 |
172.56 |
600.72 |
422.141 |
|
Hypo 8 |
3.96 |
0.91 |
174.54 |
598.74 |
431.48 |
|
Hypo 9 |
4.00 |
0.90 |
178.14 |
595.14 |
447.521 |
|
Hypo 10 |
4.03 |
0.90 |
180.00 |
593.28 |
449.687 |
a root mean square deviation; b squared correlation coefficient; c overall cost parameter of the PH4 pharmacophore; d cost difference between Null cost and hypothesis total cost; e lowest cost from 49 scrambled runs at a selected level of confidence of 98%. The Fixed Cost = 41.53 with RMSD = 0, the Null Cost = 773.28 with RMSD = 9.35 and the Configuration cost = 10.94.
We can carry out computational design and selection of new AAD analogs with elevated activation potencies against FXR. based on a strategy using the noticeable presence of the hydrophobic features included in the best pharmacophore model at the position of R2 coupled with mapping of R1 to the aromatic ring feature and the appropriate ring substitution to the hydrophobic aliphatic feature in Hypo1 (Figure 6).
3.5. Virtual Screening
In silico screening of a virtual (combinatorial) library can lead to hit identification as it was shown in our previous works on inhibitors design [18,22,23,24].
3.5.1. Virtual Library
An initial virtual library (VL) was generated by substitutions at positions for R1, R2, R3 and R4 (Table 9) on the AAD scaffold. During the virtual library enumeration. the R-groups listed in Table 9 were attached to in positions R1.R2.R3 and R4 of the AAD scaffold to form a combinatorial library of the size: R1 × R2 × R3 × R4 = 71 × 11 × 11 × 11 = 94501 analogs. In order match the substitution pattern of the best training set ligand AAD1 and taking into account the reported structural information about S pockets filling suitable for substitution not excluded through the Lipinski’s rule violation (Mw > 500 g/mol [25]. the VL underwent a focusing. To increase the content of drug-like and orally bioavailable analogs, the initial VL was filtered in an ADME-based focusing step. Only those molecules that satisfied the Lipinski’s rule of five[25] computed using QikProp [26], were kept. From the initial set of 94501 analogs, 33134 fulfilled the Lipinski test (except the restriction M w < 500 g/mol). Out of them, 100 best fitting analogs (PH4 hits) were retained and submitted to structure-based screening using the QSAR model and computed GFE of the FXR: AAD complex formation. The calculated ΔΔGcom of the FXR:AAD complexes of the hits, their components as well as predicted half-maximal effective concentration EC50 pre estimated from the correlation equation (B) (Table 3) are listed in Table 10.
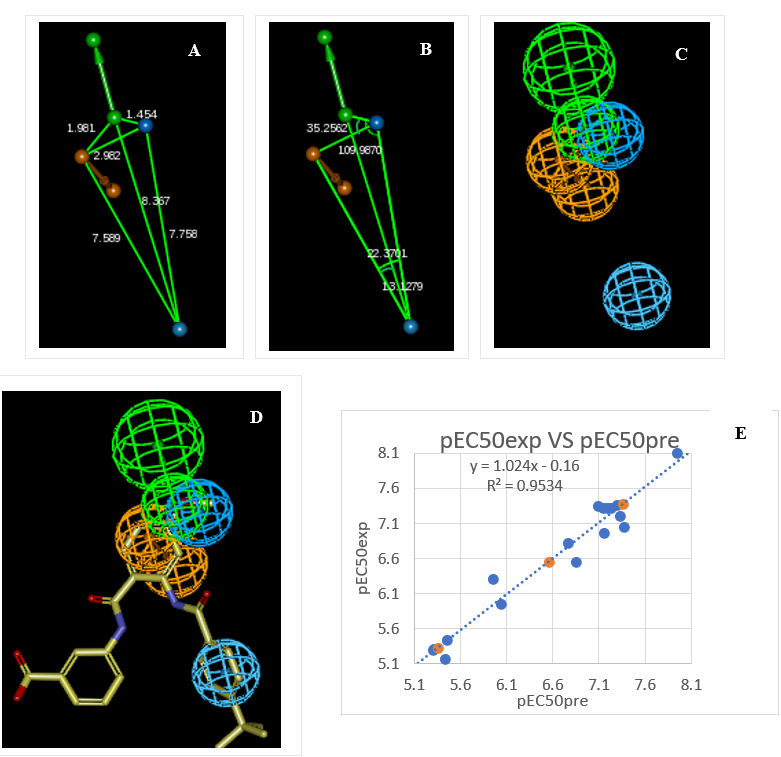
Figure 6. (A) Distances between centers, (B) angles between centers of pharmacophoric features (C) features, (D) mapping of pharmacophore of FXR ligand with the most partial agonist AAD1 (yellow). Feature legend: HYDA = Hydrophobic Aliphatic (blue), HYD = Hydrophobic (cyan), Ar = Ring aromatic (orange), HBA = Hydrogen bond Acceptor (green). (E) Correlation plot of experimental vs. predicted activation activity.
3.5.2. In Silico Screening of Library of AADs
The focused library of 94501 analogs was further screened for molecular structures matching the 3D-QSAR PH4 pharmacophore model Hypo1 of FXR activation, 100 best fitting analogs (PH4 hits) then underwent complexation QSAR model screening. The computed GFE of FXR-ADDx complex formation, their components and predicted half-maximal effective concentrations EC50pre calculated from the correlation Equation B (Table 3) are listed in Table 10.
Table 9. R-groups (fragments. building blocks. substituents) used in the design of the diversity VL of AAD analogs.
|
R1 group |
|||||
|
1 |
Me |
25 |
iodoacetyl |
49 |
3-hydroxyprop-1-en-1-yl |
|
2 |
F-Me |
26 |
ethenyl |
50 |
2-hydroxyprop-1-en-1-yl |
|
3 |
Cl-Me |
27 |
2-fluroethenyl |
51 |
1-hydroxyprop-1-en-1-yl |
|
4 |
Br-Me |
28 |
2-chloroethenyl |
52 |
3-fluoroprop-1-en-1-yl |
|
5 |
I-Me |
29 |
2,2-difluroethenyl |
53 |
3-chloroprop-1-en-1-yl |
|
6 |
CF3 |
30 |
2,2-dichloroethenyl |
54 |
3-hydroxyprop-2-en-1-yl |
|
7 |
methoxy |
31 |
ethoxy |
55 |
2-hydroxyprop-2-en-1-yl |
|
8 |
fluoromethoxy |
32 |
2-fluoroethoxy |
56 |
3-chloroprop-2-en-1-yl |
|
9 |
Chloromethoxy |
33 |
2-chloroethoxy |
57 |
3-fluoroprop-2-en-1-yl |
|
10 |
bromomethoxy |
34 |
2-bromoethoxy |
58 |
3,3-difluoroprop-2-en-1-yl |
|
11 |
iodomethoxy |
35 |
2-iodoethoxy |
59 |
2-fluoroprop-2-en-1-yl |
|
12 |
trifluoromethoxy |
36 |
propyl |
60 |
2-chloroprop-2-en-1-yl |
|
13 |
Et |
37 |
3-fluoropropyl |
61 |
2,3-difluoroprop-2-en-1-yl |
|
14 |
2-fluroEt |
38 |
3-chloropropyl |
62 |
2,3-dichloroprop-2-en-1-yl |
|
15 |
2-chloroEt |
39 |
2-fluoropropyl |
63 |
3-fluoro-2-oxopropyl |
|
16 |
2-bromoEt |
40 |
3-chloropropyl |
64 |
3-chloro-2-oxopropyl |
|
17 |
2-iodoEt |
41 |
3-hydroxypropyl |
65 |
3-fluoro-1-oxopropyl |
|
18 |
2-hydroxyEt |
42 |
2-hydroxypropyl |
66 |
3-chloro-1-oxopropyl |
|
19 |
1-hydroxyEt |
43 |
1-hydroxypropyl |
67 |
aminomethyl |
|
20 |
2-oxoEt |
44 |
prop-1-en-1-yl |
68 |
aminoethyl |
|
21 |
acetyl |
45 |
Prop-2-en-1-yl |
79 |
amido |
|
22 |
fluoroacetyl |
46 |
3-oxopropyl |
70 |
aminomethoxy |
|
23 |
chloroacetyl |
47 |
2-oxopropyl |
71 |
aminoacethyl |
|
24 |
bromoacetyl |
48 |
propanoyl |
|
|
|
R2 group |
|||||
|
1 |
tert-butyl |
5 |
3,3-dimethylbutyl |
9 |
2-(4-methylcyclohexyl)ethyl |
|
2 |
2-methylbutan-2-yl |
6 |
2-cyclohexylethyl |
10 |
2-(4-fluorocyclohexyl)ethyl |
|
3 |
2,2-dimethylpropyl |
7 |
cyclohexylmethyl |
11 |
(4-fluorocyclohexyl)methyl |
|
4 |
3-fluoro-2,2-dimethylpropyl |
8 |
(4-methylcyclohexyl) methyl |
|
|
|
R3, R4 group |
|||||
|
1 |
-H |
5 |
-I |
9 |
CF3 |
|
2 |
-F |
6 |
Me |
10 |
Et |
|
3 |
-Cl |
7 |
F-Me |
11 |
-NH2 |
|
4 |
-Br |
8 |
Cl–Me |
|
|
Table 10. GFE and their components for the top scoring 100 virtual AAD analogs. The analog numbering concatenates the index of each substituent R1.R2.R3 and R4 with the substituent numbers taken from Table 9.
|
Designed Analogsa |
ΔΔHMM b |
ΔΔGsol c |
ΔTΔSvib d |
ΔΔGcom e |
EC50pre f |
|
|
N° |
DDA1 |
0.00 |
0.00 |
0.00 |
0.00 |
8 g |
|
1 |
02-6-6-11 |
-13.85 |
0.35 |
1.30 |
-14.80 |
0.135 |
|
2 |
03-6-6-11 |
-13.44 |
-0.28 |
3.67 |
-17.39 |
0.068 |
|
3 |
07-1-6-11 |
-1.87 |
1.72 |
5.40 |
-5.54 |
1.547 |
|
4 |
07-5-6-11 |
-10.73 |
3.70 |
2.03 |
-9.06 |
0.612 |
|
5 |
07-6-1-1 |
-11.93 |
0.06 |
2.17 |
-14.04 |
0.164 |
|
6 |
07-6-6-11 |
-15.51 |
1.52 |
6.51 |
-20.49 |
0.030 |
|
7 |
07-7-6-11 |
-8.48 |
0.67 |
4.53 |
-12.35 |
0.257 |
|
8 |
08-1-6-11 |
-6.37 |
1.65 |
4.00 |
-8.72 |
0.669 |
|
9 |
08-3-6-11 |
-10.61 |
1.02 |
2.13 |
-11.72 |
0.303 |
|
10 |
08-5-1-1 |
-14.69 |
5.26 |
1.82 |
-11.25 |
0.343 |
|
11 |
08-5-6-11 |
-15.99 |
6.07 |
2.05 |
-11.96 |
0.284 |
|
12 |
08-6-1-1 |
-16.31 |
0.16 |
0.53 |
-16.69 |
0.082 |
|
13 |
08-6-11-2 |
-20.08 |
0.98 |
-1.23 |
-17.86 |
0.060 |
|
14 |
08-6-2-11 |
-18.87 |
1.04 |
-0.62 |
-17.21 |
0.071 |
|
15 |
08-6-3-11 |
-20.41 |
1.57 |
-0.93 |
-17.92 |
0.059 |
|
16 |
08-6-6-11 |
-19.00 |
0.78 |
4.70 |
-22.92 |
0.015 |
|
17 |
08-7-6-11 |
-13.46 |
0.74 |
2.31 |
-15.03 |
0.127 |
|
18 |
08-8-11-6 |
-15.47 |
1.32 |
5.94 |
-20.08 |
0.033 |
|
19 |
08-8-6-11 |
-15.76 |
0.44 |
6.04 |
-21.37 |
0.024 |
|
20 |
09-3-6-11 |
-10.50 |
0.66 |
0.80 |
-10.64 |
0.403 |
|
21 |
09-5-6-11 |
-16.89 |
5.48 |
0.89 |
-12.30 |
0.260 |
|
22 |
09-6-6-11 |
-18.45 |
-0.17 |
2.72 |
-21.33 |
0.024 |
|
23 |
09-7-6-11 |
-13.31 |
0.29 |
2.31 |
-15.34 |
0.117 |
|
24 |
09-8-6-11 |
-15.16 |
0.51 |
5.15 |
-19.80 |
0.036 |
|
25 |
26-5-1-1 |
-9.47 |
2.21 |
2.57 |
-9.84 |
0.498 |
|
26 |
26-5-6-11 |
-9.70 |
2.00 |
2.19 |
-9.89 |
0.492 |
|
27 |
27-3-6-11 |
-7.39 |
0.98 |
2.08 |
-8.49 |
0.711 |
|
28 |
27-6-6-11 |
-17.04 |
3.82 |
4.88 |
-18.11 |
0.056 |
|
29 |
27-7-1-1 |
-9.30 |
0.37 |
2.82 |
-11.75 |
0.301 |
|
30 |
31-3-6-11 |
-7.46 |
0.65 |
1.04 |
-7.85 |
0.842 |
|
31 |
31-5-1-1 |
-13.09 |
0.73 |
1.74 |
-14.10 |
0.162 |
|
32 |
31-5-6-11 |
-13.41 |
0.96 |
5.20 |
-17.65 |
0.063 |
|
33 |
31-5-6-2 |
-14.70 |
1.05 |
2.41 |
-16.07 |
0.096 |
|
34 |
31-6-1-1 |
-13.80 |
-0.29 |
0.75 |
-14.84 |
0.133 |
|
35 |
31-6-6-11 |
-16.45 |
1.63 |
5.93 |
-20.74 |
0.028 |
|
36 |
31-7-1-1 |
-8.97 |
0.01 |
3.70 |
-12.66 |
0.237 |
|
37 |
31-7-6-11 |
-10.83 |
0.16 |
4.62 |
-15.30 |
0.118 |
|
38 |
31-8-11-6 |
-11.20 |
0.25 |
6.45 |
-17.41 |
0.068 |
|
39 |
31-8-6-11 |
-14.04 |
0.15 |
6.73 |
-20.62 |
0.029 |
|
40 |
32-1-6-11 |
-7.21 |
1.21 |
-0.01 |
-5.99 |
1.375 |
|
41 |
32-3-11-1 |
-7.85 |
1.08 |
1.79 |
-8.56 |
0.697 |
|
42 |
32-3-6-1 |
-9.61 |
0.18 |
1.80 |
-11.24 |
0.344 |
|
43 |
32-3-6-11 |
-11.17 |
0.58 |
-0.56 |
-10.03 |
0.474 |
|
44 |
32-5-1-1 |
-15.70 |
-0.57 |
1.24 |
-17.51 |
0.066 |
|
45 |
32-5-11-2 |
-17.52 |
1.68 |
1.61 |
-17.46 |
0.067 |
|
46 |
32-5-6-11 |
-15.48 |
0.88 |
3.46 |
-18.06 |
0.057 |
|
47 |
32-5-6-2 |
-17.76 |
0.85 |
0.86 |
-17.77 |
0.061 |
|
48 |
32-6-11-2 |
-20.14 |
1.83 |
2.72 |
-21.03 |
0.026 |
|
49 |
32-6-11-6 |
-18.49 |
3.73 |
3.51 |
-18.28 |
0.054 |
|
50 |
32-6-2-11 |
-19.81 |
1.89 |
1.70 |
-19.62 |
0.038 |
|
51 |
32-6-3-11 |
-21.77 |
1.48 |
2.49 |
-22.78 |
0.016 |
|
52 |
32-6-6-11 |
-21.41 |
1.63 |
5.11 |
-24.89 |
0.009 |
|
53 |
32-6-7-11 |
-22.92 |
1.71 |
1.73 |
-22.94 |
0.015 |
|
54 |
32-7-1-1 |
-12.08 |
0.13 |
2.40 |
-14.34 |
0.152 |
|
55 |
32-7-6-11 |
-14.58 |
0.24 |
3.17 |
-17.52 |
0.066 |
|
56 |
32-8-1-1 |
-14.89 |
0.63 |
4.23 |
-18.50 |
0.051 |
|
57 |
32-8-11-6 |
-15.07 |
0.92 |
5.64 |
-19.79 |
0.036 |
|
58 |
32-8-6-11 |
-15.95 |
0.66 |
5.68 |
-20.98 |
0.026 |
|
59 |
33-6-11-2 |
-20.98 |
2.13 |
1.04 |
-19.89 |
0.035 |
|
60 |
33-7-1-1 |
-11.78 |
0.59 |
2.20 |
-13.38 |
0.196 |
|
61 |
33-7-6-11 |
-13.98 |
0.90 |
3.21 |
-16.29 |
0.091 |
|
62 |
33-8-11-6 |
-14.16 |
0.95 |
4.72 |
-17.93 |
0.059 |
|
63 |
33-8-6-11 |
-15.84 |
0.65 |
4.83 |
-20.02 |
0.034 |
|
64 |
37-5-6-11 |
-13.14 |
1.12 |
5.01 |
-17.04 |
0.075 |
|
65 |
45-6-11-1 |
-13.68 |
3.12 |
4.26 |
-14.81 |
0.134 |
|
66 |
45-7-6-11 |
-8.92 |
0.46 |
3.30 |
-11.76 |
0.300 |
|
67 |
45-8-11-2 |
-11.80 |
2.99 |
4.39 |
-13.20 |
0.205 |
|
68 |
45-8-2-11 |
-9.53 |
0.59 |
5.35 |
-14.28 |
0.154 |
|
69 |
48-6-6-11 |
-16.91 |
2.39 |
5.29 |
-19.81 |
0.036 |
|
70 |
50-5-1-1 |
-12.68 |
1.64 |
0.55 |
-11.59 |
0.314 |
|
71 |
50-6-6-11 |
-17.10 |
6.90 |
5.06 |
-15.26 |
0.119 |
|
72 |
50-8-6-11 |
-10.10 |
0.49 |
6.39 |
-16.00 |
0.098 |
|
73 |
51-5-1-1 |
-13.27 |
2.20 |
0.69 |
-11.76 |
0.300 |
|
74 |
51-5-6-11 |
-13.53 |
2.59 |
4.50 |
-15.44 |
0.114 |
|
75 |
51-6-6-11 |
-22.89 |
10.00 |
4.39 |
-17.28 |
0.070 |
|
76 |
52-5-1-1 |
-14.54 |
0.92 |
0.35 |
-13.97 |
0.168 |
|
77 |
52-5-6-11 |
-16.46 |
0.41 |
2.49 |
-18.55 |
0.050 |
|
78 |
52-6-11-1 |
-19.27 |
1.67 |
2.13 |
-19.73 |
0.037 |
|
79 |
52-6-11-2 |
-19.67 |
1.15 |
0.58 |
-19.10 |
0.043 |
|
80 |
52-7-6-11 |
-13.64 |
0.80 |
3.14 |
-15.98 |
0.098 |
|
81 |
52-8-6-11 |
-15.61 |
0.55 |
5.25 |
-20.31 |
0.030 |
|
82 |
55-6-6-11 |
-14.72 |
3.46 |
4.62 |
-15.87 |
0.101 |
|
83 |
65-1-1-1 |
-2.11 |
0.83 |
1.18 |
-2.45 |
3.500 |
|
84 |
65-1-6-11 |
-3.95 |
1.52 |
-1.42 |
-1.01 |
5.116 |
|
85 |
65-5-6-11 |
-16.50 |
2.61 |
2.28 |
-16.17 |
0.094 |
|
86 |
65-6-6-11 |
-20.48 |
2.22 |
3.21 |
-21.47 |
0.023 |
|
87 |
65-8-6-11 |
-15.67 |
0.38 |
4.32 |
-19.61 |
0.038 |
|
88 |
68-6-1-1 |
-11.56 |
0.20 |
2.35 |
-13.70 |
0.180 |
|
89 |
68-6-6-2 |
-15.66 |
-0.12 |
5.24 |
-21.02 |
0.026 |
|
90 |
70-5-6-2 |
-14.01 |
1.96 |
0.75 |
-12.81 |
0.227 |
|
91 |
70-6-1-1 |
-13.60 |
0.41 |
0.46 |
-13.64 |
0.183 |
|
92 |
70-6-6-2 |
-19.15 |
0.31 |
3.03 |
-21.86 |
0.020 |
|
93 |
70-6-6-3 |
-19.07 |
-0.33 |
4.18 |
-23.57 |
0.013 |
|
94 |
70-6-6-5 |
-16.08 |
0.55 |
2.38 |
-17.91 |
0.059 |
|
95 |
70-6-6-6 |
-15.54 |
0.02 |
4.80 |
-20.32 |
0.030 |
|
96 |
70-8-6-2 |
-14.63 |
0.59 |
5.45 |
-19.49 |
0.039 |
|
97 |
71-5-6-2 |
-13.89 |
2.58 |
2.33 |
-13.64 |
0.183 |
|
98 |
71-6-6-2 |
-16.35 |
2.88 |
4.47 |
-17.94 |
0.059 |
|
99 |
71-6-6-6 |
-13.90 |
2.39 |
5.30 |
-16.81 |
0.079 |
|
100 |
71-8-6-2 |
-15.93 |
0.97 |
5.64 |
-20.60 |
0.029 |
a Mw is molar mass of ligand; bΔΔHMM is the relative enthalpic contribution to the GFE change of the FXR-AAD complex formation ΔΔGcom (for details see footnote pf Table 2); c ΔΔGsol is the relative solvation GFE contribution to ΔΔGcom; d ΔΔTSvib is the relative (vibrational) entropic contribution to ΔΔGcom; e ΔΔGcom is the relative Gibbs free energy change related to the receptor–ligand FXR-AAD complex formation ΔΔGcom = ΔΔHMM + ΔΔGsol - ΔΔTSvib; f EC50pre is the predicted activation potency towards FXR calculated from ΔΔGcom using correlationEquation B. Table 3; g EC50exp [15] is given for the reference ligand AAD1 instead of the EC50pre.
3.6. Novel AAD Analogs
The design of virtual library of novel analogs was guided by structural information retrieved from the AADx active conformation and was used for the selection of appropriate substituents (R1. R2. R3 and R4-groups). In order to identify which substituents lead to new ligand candidates with the highest predicted potencies towards the FXR, we have prepared histograms of the frequency of occurrence of R1 to R4-groups among the 100 best fit PH4 hits (Figure 7). The histograms show that the R1-groups 8: fluoromethoxy (12). 31: ethoxy (10). 32: 2-fluoroethoxy (19) and 70: aminomethoxy (7) were represented with the highest frequency among the 100 AAD hits. The R2-groups most frequently represented in this subset are 5: 3, 3-dimethylbutyl (19). 6: 2-cyclohexyléthyl (34) and 8: (4-méthylcyclohexyl) methyl (14). In the case of R3-groups fragments 1: H (17), 6: Me (51), 11: -NH2 (14) and for R4-groups 1: H (21), 2: -F (14),11: -NH2 (44).The top ten scoring virtual hits. Namely, analogs are 32-6-6-11 (EC50 pre = 9.3 pM), 70-6-6-3 (13 pM), 32-6-7-11 (15 pM), 08-6-6-11 (15 pM), 32-6-3-11 (16 pM), 70-6-6-2 (20 pM), 65-6-6-11 (23 pM), 09-5-6-11 (24 pM), 08-8-6-11 (24 pM) and 32-8-6-11 (26 pM). The R-groups were buried more deeply in lipophilic pockets display preferences for probably leading to rise in potency [15].
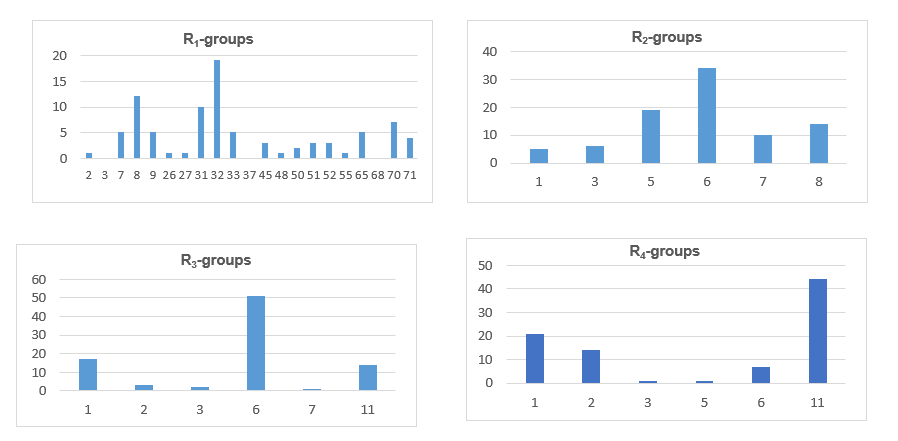
Figure 7. Histograms of frequency of occurrence of individual R-groups in the 100 best selected analogs mapping to four features of the PH4 pharmacophore hypothesis Hypo1 (for the structures of the fragments see Table 10); R1 = 8: fluoromethoxy (12); 31: ethoxy (10); 32: 2-fluoroethoxy (19); 70: aminomethoxy (7); R2 = 5:3.3-dimethylbutyl (19); 6:2-cyclohexylethyl (34) and 8:(4-methylcyclohexyl) methyl (14); R3 = 1:H(17).6:Me(51), 11: -NH2 (14) and R4 = 1:H(21), 2: -F (14).11: -NH2 (44).
The substitutions in R1 and R2 positions of AADs deeply buried in lipophilic pockets led to an overall increase of affinity of FXR binding as exemplified by the activation potencies of majority of new designed analogs. The best designed AAD, 32-6-6-11 displays predicted half-maximal effective concentrations of EC50pre = 9.3 pM that is about 860 times lower than that of the most active compound of the TS, namely the AAD1 with EC50exp = 8 nM. Figures 7 and 8.
3.7. Pharmacokinetic Profile of Novel AAD Analogs
Properties that determine the pharmacokinetics profile of a compound, besides octanol/water partitioning coefficient, aqueous solubility, blood/brain partition coefficient. Caco-2 cell permeability, serum protein binding, number of likely metabolic reactions and other 18 descriptors related to adsorption, distribution. metabolism and excretion (ADME properties) of the ligands were computed by the QikProp program [27] based on the methods of Jorgensen [26,28]. According to these methods, experimental results of more than 710 compounds including about 500 drugs and related heterocycles, were correlated with computed physicochemical descriptors, resulting in an accurate prediction of molecule’s pharmacokinetic profile. Drug likeness (#stars) is represented by the number of descriptors that exceed the range of values determined for 95% of known drugs out of 24 selected descriptors computed by QikProp [27]. Drug-likeness was used as the global compound selection criterion related to ADME properties. The selected ADME descriptors were calculated from 3D structures of compounds considered. They were used to assess the pharmacokinetics profile of designed compounds (table 11). The values for the best active designed AADs are compared with those computed for drugs used for treatment of metabolic diseases such as diabetes and PBC clinical trials (Table 11).
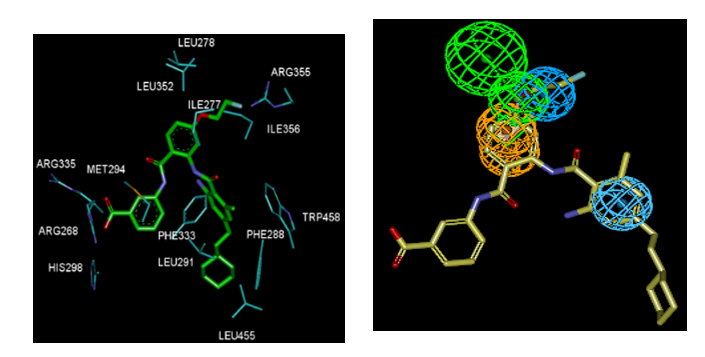
Figure 8. (Left) Close up of virtual hit 32-6-6-11, the most active designed AAD analog (IC50pre = 9.3 pM) at the active site of FXR. (Right) Mapping of the AAD 32-6-611 to FXR activation pharmacophore.
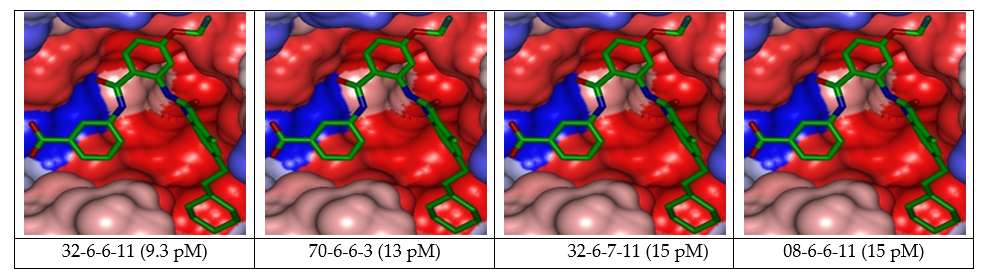
Figure 9. Connolly Surface of the active site of FXR for 4 best active designed AAD analogs. The binding site surface is colored according to residue hydrophobicity: red = hydrophobic, blue = hydrophilic and white = intermediate
Table 11. ADME-related properties of the best designed AAD analogs computed by QikProp [27]
|
AADa |
#starsb |
MWc (g.mol-1) |
Smol [Å2] |
Smol.hfoe [Å2] |
Vmolf [Å3] |
rotBg |
HBdonh |
HBacci |
logPo/wj |
logSwatk |
logKhsal |
logB/Bm |
BIPCacon |
#metabo |
HOAp |
%HOAq |
EC50pre r [nM] |
|
31-6-6-11 |
3 |
543.7 |
937.9 |
480.6 |
1742.7 |
11 |
3 |
7 |
6.5 |
-8.7 |
1.23 |
-2.47 |
33.0 |
7 |
1 |
66.1 |
0.028 |
|
32-6-11-2 |
4 |
565.6 |
935.3 |
369.3 |
1721.8 |
11 |
3 |
7 |
6.4 |
-9.0 |
1.17 |
-2.64 |
19.0 |
6 |
1 |
61.6 |
0.026 |
|
32-8-6-11 |
3 |
561.7 |
931.9 |
432.9 |
1738.4 |
10 |
3 |
7 |
6.6 |
-9.0 |
1.26 |
-2.27 |
33.3 |
7 |
1 |
67.1 |
0.026 |
|
08-8-6-11 |
1 |
547.6 |
872.9 |
378.5 |
1652.7 |
9 |
3 |
7 |
6.1 |
-8.1 |
1.09 |
-2.06 |
32.7 |
7 |
1 |
63.9 |
0.024 |
|
09-5-6-11 |
2 |
538.0 |
898.5 |
355.0 |
1651.9 |
10 |
3 |
7 |
6.2 |
-8.5 |
1.03 |
-2.16 |
34.5 |
7 |
1 |
65.1 |
0.024 |
|
65-6-6-11 |
3 |
573.7 |
958.8 |
429.3 |
1791.7 |
11 |
3 |
8 |
6.2 |
-8.9 |
1.12 |
-2.83 |
14.5 |
7 |
1 |
58.0 |
0.023 |
|
70-6-6-2 |
3 |
547.6 |
905.9 |
386.8 |
1691.0 |
11 |
4 |
8 |
3.0 |
-7.2 |
0.83 |
-2.40 |
3.5 |
7 |
1 |
41.2 |
0.020 |
|
32-6-3-11 |
4 |
582.1 |
942.2 |
366.9 |
1747.8 |
11 |
3 |
7 |
6.9 |
-9.3 |
1.24 |
-2.27 |
30.0 |
6 |
1 |
67.8 |
0.016 |
|
08-6-6-11 |
1 |
547.6 |
892.5 |
389.8 |
1677.9 |
10 |
3 |
7 |
6.3 |
-8.3 |
1.11 |
-2.19 |
31.6 |
7 |
1 |
64.5 |
0.015 |
|
32-6-7-11 |
4 |
579.6 |
957.3 |
414.0 |
1774.7 |
11 |
3 |
7 |
7.0 |
-9.4 |
1.31 |
-2.28 |
33.9 |
7 |
1 |
69.5 |
0.015 |
|
70-6-6-3 |
3 |
564.1 |
906.7 |
381.2 |
1706.6 |
11 |
4 |
8 |
3.1 |
-7.3 |
0.87 |
-2.31 |
3.6 |
7 |
1 |
42.5 |
0.013 |
|
32-6-6-11 |
4 |
561.7 |
946.7 |
441.5 |
1757.1 |
11 |
3 |
7 |
6.8 |
-9.1 |
1.27 |
-2.36 |
33.7 |
7 |
1 |
67.9 |
0.0093 |
|
Obeticholic acid |
1.0 |
420.6 |
687.2 |
508.6 |
1343.8 |
7.0 |
3.0 |
5.4 |
4.4 |
-5.4 |
0.7 |
-1.5 |
50.8 |
3.0 |
3.0 |
83.3 |
- |
|
Repaglinide |
0.0 |
452.6 |
647.1 |
339.9 |
1342.4 |
9.0 |
2.0 |
6.3 |
4.4 |
-3.5 |
0.2 |
-0.9 |
139.0 |
4.0 |
3.0 |
90.9 |
- |
|
Metformin |
3.0 |
129.2 |
317.0 |
151.8 |
488.6 |
2.0 |
5.0 |
3.5 |
-0.8 |
-0.5 |
-0.8 |
-0.8 |
268.9 |
1.0 |
2.0 |
65.9 |
- |
|
liraglutide |
1.0 |
369.5 |
779.8 |
610.6 |
1386.2 |
19.0 |
1.3 |
5.8 |
4.2 |
-5.1 |
-0.1 |
-2.5 |
57.4 |
3.0 |
1.0 |
83.3 |
- |
|
pioglitazone |
0.0 |
356.4 |
621.4 |
229.0 |
1096.0 |
7.0 |
1.0 |
4.8 |
3.6 |
-4.9 |
0.4 |
-1.1 |
474.5 |
6.0 |
3.0 |
95.8 |
- |
|
sitagliptin |
1.0 |
407.3 |
617.6 |
152.8 |
1082.4 |
5.0 |
1.0 |
5.0 |
2.9 |
-4.0 |
0.1 |
0.0 |
99.0 |
5.0 |
3.0 |
79.9 |
- |
|
Gglicazide |
0.0 |
323.4 |
570.8 |
323.6 |
1017.8 |
3.0 |
1.0 |
5.0 |
2.2 |
-3.0 |
0.0 |
-0.9 |
221.9 |
1.0 |
3.0 |
82.0 |
- |
a designed AAD analogs. Table 6; bdrug likeness. number of property descriptors (24 out of the full list of 49 descriptors of QikProp. ver. 3.7. release 14) that fall outside of the range of values for 95% of known drugs; cmolar mass in [g.mol-1] (range for 95% of drugs: 130–725 g.mol−1) [27]; d total solvent-accessible molecular surface. in [Å2] (probe radius 1.4 Å) (range for 95% of drugs: 300–1000 Å2); e hydrophobic portion of the solvent-accessible molecular surface, in [Å2] (probe radius 1.4 Å) (range for 95% of drugs: 0–750 Å2); f total volume of molecule enclosed by solvent-accessible molecular surface, in [Å3] (probe radius 1.4 Å) (range for 95% of drugs: 500–2000 Å3); g number of non-trivial (not CX3), non-hindered (not alkene. amide. small ring) rotatable bonds (range for 95% of drugs: 0–15); h estimated number of hydrogen bonds that would be donated by the solute to water molecules in an aqueous solution. Values are averages taken over a number of configurations, so they can assume non-integer values (range for 95% of drugs: 0.0–6.0); i estimated number of hydrogen bonds that would be accepted by the solute from water molecules in an aqueous solution. Values are averages taken over a number of configurations, so they can assume non-integer values (range for 95% of drugs: 2.0–20.0); j logarithm of partitioning coefficient between n-octanol and water phases (range for 95% of drugs: −2 to 6.5); k logarithm of predicted aqueous solubility. logS. S in [mol·dm–3] is the concentration of the solute in a saturated solution that is in equilibrium with the crystalline solid (range for 95% of drugs: −6.0 to 0.5); l logarithm of predicted binding constant to human serum albumin (range for 95% of drugs: −1.5 to 1.5); m logarithm of predicted brain/blood partition coefficient (range for 95% of drugs: −3.0 to 1.2); n predicted apparent Caco-2 cell membrane permeability in Boehringer-Ingelheim scale in [nm s-1] (range for 95% of drugs: < 25 poor. > 500 nm s−1 great); o number of likely metabolic reactions (range for 95% of drugs: 1–8); p human oral absorption (1 = low. 2 = medium. 3 = high); q percentage of human oral absorption in gastrointestinal tract (<25% = poor. >80% = high); r predicted activation constants EC50pre. EC50pre was predicted from computed ∆∆Gcom using the regression Equation B shown in Table 3.
4.1. Binding mode of anthranilic acid derivatives
Besides the robustness of the QSAR model, the analysis of the interactions between the AAD and active site residues revealed the key interactions responsible for the AAD affinity to FXR, such as hydrogen bonds, van der Waals interactions, and hydrophobic contacts, etc. As displayed in the 2D and 3D schemes of Figure 3, the binding of AAD1 most active ligand in the TS to the active site of FXR is supported by the following interactions: HB of the benzoic acid with Arg335 and hydrophobic contacts.
To verify whether also other stronger interactions codetermine the binding mode of AAD to FXR active site and aid structure-based design of new analogs, interaction energies Eint between active site residues and AAD were computed (Table 4). The structure of AAD shed some light on the structure features for binding affinity and opened the gate to the design of new AAD ligands taking benefit from S1 to S2 pockets filling. In this way key residues from these pockets contribution to the global interaction energy FXR–AADx correlate with their activation potencies as displayed in Figure 5 (table 5, 6 and 7).
4.2. Analysis of new ligands from in silico screening
An analysis of structural requirement for FXR activation at the level of hydrophobic contacts with the active site revealed that the substituent, namely R1-group and R2-group in the training set insufficiently explored the S1 and S2 pockets of the FXR active site. Therefore, new AAD agonistics that match the FXR activation pharmacophore and fill better the S1 and S2 pockets may form potent ligands (Table 10). The top scoring virtual hits are AAD analogs: are 32-6-6-11 (EC50pre = 9.3 pM), 70-6-6-3 (13 pM), 32-6-7-11 (15 pM), 08-6-6-11 (15 pM), 32-6-3-11 (16 pM), 70-6-6-2 (20 pM). 65-6-6-11 (23 pM). 09-5-6-11 (24 pM). 08-8-6-11 (24 pM), and 32-8-6-11 (26 pM) with specific substitution targeting S1 and S2 pockets filling (R1.R2. R3 and R4 substituents). The predicted activity of the best designed AAD analog 32-6-6-11 reached approximately 860 times lower than that of the most active ligand of the training set AAD1 with IC50exp = 8 nM (Table 10).
Despite this exceedingly optimistic picture, our approach helped to identify interesting hydrophobic side chains (R1-groups) such as 2-fluoroéthoxy (19). fluoromethoxy (12) for the S1 pocket filling and a bulkier group (R2-groups) 2-cyclohexylethyl (34) compared to the lipophilic 4-tert-butylbenzoyl substituent for S2 [15,19]. These substituents allowed to entirely fill the spacious FXR ligand-binding site [20]. The Connolly surface of the binding site shows the lipophilic S2 pocket accommodating a bulkier substituent contributing to better stabilization and greater affinity (Figure 9).
The ADME-related properties were also computed for the best active designed AAD (Table 11). It can be noticed that the human oral absorption in gastrointestinal tract (HOA) is low for the new AAD analogs suggesting non-oral delivery. The blood–brain barrier descriptor is in the appropriate range.
Structural investigation of the SAR of anthranilic acid derivatives as partial FXR agonists from the crystal structure of FXR: AAD complex guided us during preparation of a reliable QSAR model of activation of FXR which correlated computed Gibbs free energies upon complex formation with observed FXR activation potencies. In addition we have derived a 3D-QSAR PH4 pharmacophore model for AAD activation using a training set of 17 and validation set of 3 AADs with known activation activities [15]. Careful analysis of interactions between the FXR’s active site residues and AADs directed us in the design of an initial diversity virtual combinatorial library of new AAD analogs with multiple substitutions on the benzene ring and amido group. A focused library filtered by a set of ADME-related descriptors and screened by matching of the analogs to the PH4 pharmacophore permitted selection of a library subset of AADs. This subset of 100 best virtual hits was submitted to computation of predicted activation potencies by the complexation QSAR model. The best analogs reached predicted activities in the low picomolar concentration range. The best designed AAD analogs are 32-6-6-11 (EC50pre = 9.3 pM), 70-6-6-3 (13 pM), 32-6-7-11 (15 pM), 08-6-6-11 (15 pM), 32-6-3-11 (16 pM), 70-6-6-2 (20 pM), 65-6-6-11 (23 pM), 09-5-6-11 (24 pM), 08-8-6-11 (24 pM) and 32-8-6-11 (26 pM) (Table 11) are recommended for synthesis and subsequent activity evaluation in FXR activation assays and may lead to a discovery of novel potent partial FXR agonists.
In addition, our structural study revealed that the residues Ile277, Leu278, Leu352, Arg355 of the S1 pocket strongly participate in the stabilization of the molecule.
The authors tank Eugene Megnassan for his helpful advice.
Gronemeyer H, Gustafsson J-Å, Laudet V. Principles for modulation of the nuclear receptor superfamily. Nat. Rev. Drug Discov. 2004; 3(11): 950-964. PMid:15520817
View Article PubMed/NCBIMakishima M. Identification of a Nuclear Receptor for Bile Acids. Science 1999; 284(5418): 1362-1365. PMid:10334992
View Article PubMed/NCBIHollman DAA, Milona A, van Erpecum KJ, van Mil SWC. Anti-inflammatory and metabolic actions of FXR: Insights into molecular mechanisms. Biochim. Biophys. Acta BBA - Mol. Cell Biol. Lipids 2012; 1821(11): 1443-1452. PMid:22820415
View Article PubMed/NCBIMerk D, Sreeramulu S, Kudlinzki D, et al. Molecular tuning of farnesoid X receptor partial agonism. Nat. Commun. 2019; 10(1): 2915. PMid:31266946
View Article PubMed/NCBIRichter HGF, Benson GM, Bleicher KH, et al. Optimization of a novel class of benzimidazole-based farnesoid X receptor (FXR) agonists to improve physicochemical and ADME properties. Bioorg. Med. Chem. Lett. 2011; 21(4): 1134-1140. PMid:21269824
View Article PubMed/NCBIPellicciari R, Passeri D, De Franco F, et al. Discovery of 3α,7α,11β-Trihydroxy-6α-ethyl-5β-cholan-24-oic Acid (TC-100), a Novel Bile Acid as Potent and Highly Selective FXR Agonist for Enterohepatic Disorders. J. Med. Chem. 2016; 59(19): 9201-9214. PMid:27652492
View Article PubMed/NCBICarotti A, Marinozzi M, Custodi C, et al. Beyond Bile Acids: Targeting Farnesoid X Receptor (FXR) with Natural and Synthetic Ligands. Curr. Top. Med. Chem. 2014; 14(19): 2129-2142. PMid:25388537
View Article PubMed/NCBIChen M, Yang X, Lai X, Kang J, Gan H, Gao Y. Structural Investigation for Optimization of Anthranilic Acid Derivatives as Partial FXR Agonists by in Silico Approaches. Int. J. Mol. Sci. 2016; 17(4): 536. PMid:27070594
View Article PubMed/NCBISingh N, Yadav M, Singh AK, et al. Synthetic FXR Agonist GW4064 Is a Modulator of Multiple G Protein-Coupled Receptors. Mol. Endocrinol. 2014; 28(5): 659-673. PMid:24597548
View Article PubMed/NCBIDwivedi SKD, Singh N, Kumari R, et al. Bile Acid Receptor Agonist GW4064 Regulates PPARγ Coactivator-1α Expression Through Estrogen Receptor-Related Receptor α. Mol. Endocrinol. 2011; 25(6): 922-932. PMid:21493670
View Article PubMed/NCBILanthier N. Les nouveaux traitements de la stéatohépatite non-alcoolique. Nutr. Clin. Métabolisme 2020; S0985056220304623.
View ArticleGege C, Hambruch E, Hambruch N, Kinzel O, Kremoser C. Nonsteroidal FXR Ligands: Current Status and Clinical Applications, in Bile Acids Their Recept., edited by S. Fiorucci and E. Distrutti (Springer International Publishing, Cham, 2019), pp. 167-205. PMid:31197565
View Article PubMed/NCBIMassafra V, Pellicciari R, Gioiello A, van Mil SWC. Progress and challenges of selective Farnesoid X Receptor modulation. Pharmacol. Ther. 2018; 191: 162-177. PMid:29933033
View Article PubMed/NCBIAchenbach J, Gabler M, Steri R, Schubert-Zsilavecz M, Proschak E. Identification of novel farnesoid X receptor modulators using a combined ligand- and structure-based virtual screening. MedChemComm 2013; 4(6): 920.
View ArticleMerk D, Lamers C, Ahmad K, et al. Extending the Structure-Activity Relationship of Anthranilic Acid Derivatives As Farnesoid X Receptor Modulators: Development of a Highly Potent Partial Farnesoid X Receptor Agonist. J. Med. Chem. 2014; 57(19): 8035-8055. PMid:25255039
View Article PubMed/NCBIAlbers M, Blume B, Schlueter T, et al. A Novel Principle for Partial Agonism of Liver X Receptor Ligands: COMPETITIVE RECRUITMENT OF ACTIVATORS AND REPRESSORS. J. Biol. Chem. 2006; 281(8): 4920-4930. PMid:16354658
View Article PubMed/NCBIXu Y, Goodacre R. On Splitting Training and Validation Set: A Comparative Study of Cross-Validation, Bootstrap and Systematic Sampling for Estimating the Generalization Performance of Supervised Learning. J. Anal. Test. 2018; 2(3): 249-262. PMid:30842888
View Article PubMed/NCBIKouassi A, Kone M, Keita M, et al. Computer-Aided Design of Orally Bioavailable Pyrrolidine Carboxamide Inhibitors of Enoyl-Acyl Carrier Protein Reductase of Mycobacterium tuberculosis with Favorable Pharmacokinetic Profiles. Int. J. Mol. Sci. 2015; 16(12): 29744-29771. PMid:26703572
View Article PubMed/NCBIMerk D, Gabler M, Gomez RC, et al. Anthranilic acid derivatives as novel ligands for farnesoid X receptor (FXR). Bioorg. Med. Chem. 2014; 22(8): 2447-2460. PMid:24685112
View Article PubMed/NCBIMerk D, Grisoni F, Schaller K, Friedrich L, Schneider G. Discovery of Novel Molecular Frameworks of Farnesoid X Receptor Modulators by Ensemble Machine Learning. ChemistryOpen 2019; 8(1): 3-3. PMid:30622876
View Article PubMed/NCBIDiscovery Studio Molecular Modeling and Simulation Program, version 2.5; Accelrys, Inc.: San Diego, CA, USA, 2009. (n.d.).
N'Guessan H, Megnassan E. Design of Phosphonic Arginine and Hydroxamic Acid Inhibitors of Plasmodium falciparum M17 Leucyl Aminopeptidase with Favorable Pharmacokinetic Profile. J. Drug Des. Med. Chem. 2017; 3(6): 98.
View ArticleAllangba KNPG, Keita M, Kre N'Guessan R, Megnassan E, Frecer V, Miertus S. Virtual design of novel Plasmodium falciparum cysteine protease falcipain-2 hybrid lactone-chalcone and isatin-chalcone inhibitors probing the S2 active site pocket. J. Enzyme Inhib. Med. Chem. 2019; 34(1): 547-561. PMid:30696325
View Article PubMed/NCBIKouman KC, Keita M, Kre N'Guessan R, et al. Structure-Based Design and in Silico Screening of Virtual Combinatorial Library of Benzamides Inhibiting 2-trans Enoyl-Acyl Carrier Protein Reductase of Mycobacterium tuberculosis with Favorable Predicted Pharmacokinetic Profiles. Int. J. Mol. Sci. 2019; 20(19): 4730. PMid:31554227
View Article PubMed/NCBILipinski CA, Lombardo F, Dominy BW, Feeney PJ. Experimental and computational approaches to estimate solubility and permeability in drug discovery and development settings. Adv. Drug Deliv. Rev. 2012; 64: 4-17.
View ArticleJorgensen WL, Duffy EM. Prediction of drug solubility from structure. Adv. Drug Deliv. Rev. 2002; 54(3): 355-366. 00008-X
View ArticleQikProp Version 3.7, Release 14. New York, NY: X Schrodinger, LLC; 2014. (n.d.).
Duffy EM, Jorgensen WL. Prediction of Properties from Simulations: Free Energies of Solvation in Hexadecane, Octanol, and Water. J. Am. Chem. Soc. 2000; 122(12): 2878-2888.
View ArticleInsight-II and Discover molecular modeling and simulation package, Version 2005. San Diego, CA: Accelrys, Inc.; 2005. (n.d.).
Owono Owono LC, Ntie-Kang F, Keita M, Megnassan E, Frecer V, Miertus S. Virtually Designed Triclosan-Based Inhibitors of Enoyl-Acyl Carrier Protein Reductase of Mycobacterium tuberculosis and of Plasmodium falciparum. Mol. Inform. 2015; 34(5): 292-307. PMid:27490275
View Article PubMed/NCBIMaple JR, Hwang M-J, Stockfisch TP, et al. Derivation of class II force fields. I. Methodology and quantum force field for the alkyl functional group and alkane molecules. J. Comput. Chem. 1994; 15(2): 162-182.
View ArticleGilson MichaelK, Honig B. The inclusion of electrostatic hydration energies in molecular mechanics calculations. J. Comput. Aided Mol. Des. 1991; 5(1). PMid:2072125
View Article PubMed/NCBIRocchia W, Sridharan S, Nicholls A, Alexov E, Chiabrera A, Honig B. Rapid grid-based construction of the molecular surface and the use of induced surface charge to calculate reaction field energies: Applications to the molecular systems and geometric objects. J. Comput. Chem. 2002; 23(1): 128-137. PMid:11913378
View Article PubMed/NCBILi, H.; Sutter, J.; Hoffmann, R. Pharmacophore Perception, Development and Use in Drug Design; Güner, O.F., Ed.; International University Line: La Jolla, CA, USA, 2000; pp. 171-189. n.d.;