Dires Yigezu
Department of Hydraulic and Water resource Engineering, Debre Tabor University, Debre Tabor, Ethiopia
Email: diresyigezu928@gmail.com
© 2019 Sift Desk Journals. All Rights Reserved
VOLUME: 4 ISSUE: 5
Page No: 708-713
Dires Yigezu
Department of Hydraulic and Water resource Engineering, Debre Tabor University, Debre Tabor, Ethiopia
Email: diresyigezu928@gmail.com
Douglas Bertram(douglas.bertram@strath.ac.uk)
G Q Chen(gqchen@pku.edu.cn)
Nikolaos Efthimiou(efthimiounik@yahoo.com)
Jisha John(jisha.john45@gmail.com)
Dires Yigezu, DYNAMICS OF LAND USE/COVERCHANGE CASE STUDY ON JEWAHA CATCHMENT NORTH EASTERN, ETHIOPIA (2019) Journal of Earth Sciences & Environmental Studies 4(5) p:708-713
The main objective of this study is to assess the dynamics of land use/cover changes of Jewaha catchment. The growing demand for food because of population growth has created greater pressure on land resources, as in the case of agriculture and housing. These anthropogenic activities lead to an expansion of agricultural land and urbanization due to deforestation. Deforestation, intense agricultural activities, industry and urban area expansion in a watershed can influence different processes. The satellite data were classified using ERDAS Imagine 2015 software to develop land use/cover maps for 1990, 2000 and 2018 of the Jewaha catchment. The result of image classification showed that the catchment land use/cover change has shown an increase in urban, agriculture and closed shrubs land by 3.98%, 7.4%, and 0.74% respectively, and decrement in the other land uses like forest and open shrubs land by 8.3% and 6.9% respectively.
Keywords: - ERDAS Imagine, Land use/cover change, Satellite image
Land use/cover changes are crucial issues in terms of the global context and their responses to environmental and socio-economic factors. The dynamics of land use/cover change are currently affecting the environment in an unbalanced manner, including the hydrology of watersheds (Chakilu et al., 2015: Lambin et al.,2003: Xiubin, L. ,1996: Tu, 2009). land use/cover activities such as conversion of natural landscapes for human use and different land management practices have transformed a large proportion of the earth’s land surface ( Bavani et al., 2017). Thus, land use/cover change mainly caused due to high population growth and it is most common in developing countries like Ethiopia (Tekle & Hedlund, 2000).The growing demand for food because of population growth has created greater pressure on land resources, as in the case of agriculture and housing. These anthropogenic activities lead to an expansion of agricultural land and urbanization due to deforestation. Agricultural activities, industry and urban area expansion in a watershed can influence different hydrological processes, including infiltration, groundwater recharge, base flow and runoff (Fan & Shibata, 2015).
The socioeconomic activities of an area play an important role in the land use/cover type. Economic activities of the study area are based on primary productions such as agricultural and livestock. Because of this questionnaire was prepared to interview the local people about the historical description of the study area and to understand different land cover features of the catchment. Supervised classification methods are used to generate land use/cover map with each pixel assigned to a class based on its multispectral composition using ERDAS imagine 2015 software for 1990, 2000 and 2018 years. The main objective of this study is to assess the dynamic of land use/cover change on Jewaha catchment and to mitigate the problems of rapid land use/cover change.
2.1. Location
Jewaha River is a tributary of lower Awash River and it is located in the north-Shewa zone of the Amhara region between 1000’ to 10020’N latitude and 39040’ to 4000’E longitudes with an elevation of a range of 1000 up to 3552m meters above mean sea level and the catchment covered 567 km2. It is mainly covered by steep mountains characterized through abrupt faults.
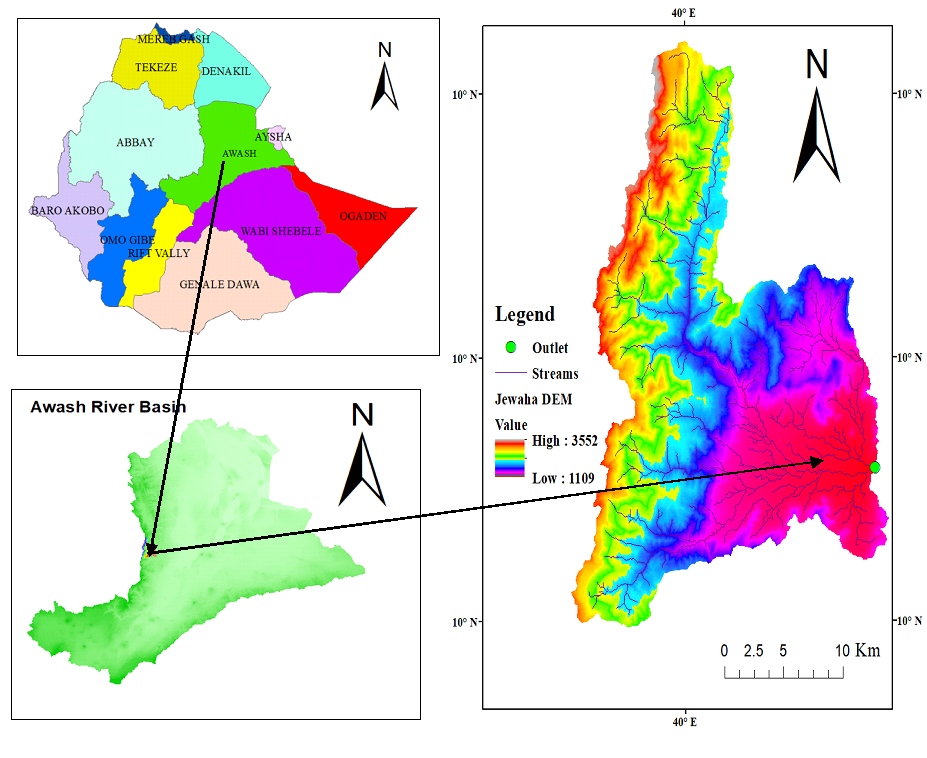
Figure1: Location of Jewaha Catchment
The climate of the area upstream of the town of Jewaha varies between sub-humid and subtropical. There is a high spatial and temporal variation of rainfall in Jewaha catchment area. The mean annual rainfall varies from 800 mm in the elevated areas to 1200 mm in the Jewaha catchment and the mean annual temperature of ranges from 20°C to 29°C.
2.2. Data collection
The land use/cover classification was made using Landsat imageries downloaded from the U.S. Geological Survey (USGS) website satellite images. The classification of the land use/cover map was done to represent the land cover according to the specific land cover types. Differentiate the type of Jewaha land use classes based on the available data source such as remote sensing, and the previous local knowledge. Hence, based on the prior knowledge of the previous land use map from EMA. Six classes were adopted for image classification using ERDAS Imagine software.
The primary data were collected at the field, used for classification, accuracy assessment and geometric correction of satellite images of the watershed. The Ground control points (GCP‘s) collected from the field for some selected land cover were taken as a signature for supervised classification. Representative samples were taken from agriculture, forest, closed and open shrubs land, water body and urbanization as training samples to start image analysis. The numbers of representative training samples for agriculture, forest, closed shrubland , open shrubs land, water body, and urbanization were 47, 39, 44, 30, 20 and 20, respectively.
The socioeconomic activities of an area play an important role in the land use/cover type. Economic activities of the study area are based on primary productions such as agricultural and livestock. Because of this questionnaire was prepared to interview the local people about the historical description of the study area and to understand different land cover features of the study area.
A total of 50 households were randomly selected for interview to obtain the required information. Fifty (50) questionnaires were administered to 65% and 35% of men and women respectively, spread across the age range of 25 to 70 years in the study area.
2.3. Method of Analysis
Image pre-processing
This study was done using Landsat images of seven bands to identify changes in land use/cover distribution in the Jewaha River catchment. Landsat 4-5TM, Landsat 7 ETM+ and Landsat 8 OLI was used for data acquisition. Landsat images used in this study area were ortho-rectified to a Universal Transverse Mercator projection using datum WGS 1984, zone 370N and to avoid a seasonal variation in vegetation pattern and distribution throughout a year, the selection of dates of the acquired data were made in the same annual season of the acquired years.
Image classification
Image classification consists of extracting classes of information from a multiband raster image. The process of classifying pixels into a number of data categories based on the values of their data files and reducing images into a number of land use/cover categories. This is done mainly using the ERDAS Imagine software. For this study supervised classification method was used. In supervised classification, spectral signatures are developed from specified locations in the image. These specified locations are given the generic name 'training sites' and are defined by the user (Banman, 2002).
Generally, image is digitized over the raster scene. The image consists of various polygons overlaying different land use types. Once the training sites are developed using ERDAS imagine use this information, along with the various images of different band widths, to create spectral signatures from the specified areas. These signatures will be used to classify all pixels in the scene. Using these methods agricultural, urbanization, water body, open shrubs, closed shrubs, and forests classes were identified according to their reflectance values for 1990, 2000 and 2018 year. Google earth was linked with ERDAS software to collect training samples from Google earth imageries especially for 1990 and 2000. For supervised classification, the Maximum Likelihood Classification Method (MAXLIKE) was used to reclassify each pixel. MAXLIKE is based on the probability that a pixel belongs to a particular class and classifies signatures with relatively large values in the Confusion matrix.
Accuracy assessment
Accuracy assessment is an important step in the image classification process. The objective of this process is to quantitatively determine how effectively pixels were grouped into the correct features classes in the area under study. A field survey is conducted to observe and collect information on the current condition of the ground. The most common way to express the accuracy of land cover maps is to indicate the percentage of the map area correctly classified.
There are different methods to asses’ accuracy assessment. But for this study confusion matrix calculations method was used. The confusion matrix is a simple cross-tabulation of the mapped class label against the observed in the ground or reference data for a sample set(Caetano, 2007).
Confusion matrix calculations the confusion matrix is a simple cross-tabulation of the mapped class label against the observed in the ground or reference data for a sample set(Caetano, 2007). For this study used Confusion matrix. The following are some of the accuracy calculations and indices that can be generated from a confusion matrix.
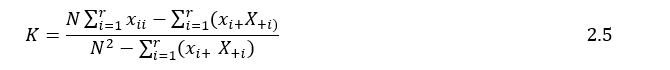
Where, N = total number of observations (pixels), r = number of rows and columns in error matrix, xii=observation in row i and column i, X+i = marginal total of row i, and X+i = marginal total of column i
3.1. Land Cover Changes
Major land cover type in Jewaha catchment includes agriculture, forests, open and closed shrubs land, urbanization and water body from 1990 to the 2018 year. Spatial analysis was carried out to describe land use/cover changes with time. This is done after image classification of the three-land use/cover maps (1990, 2000 and 2018).
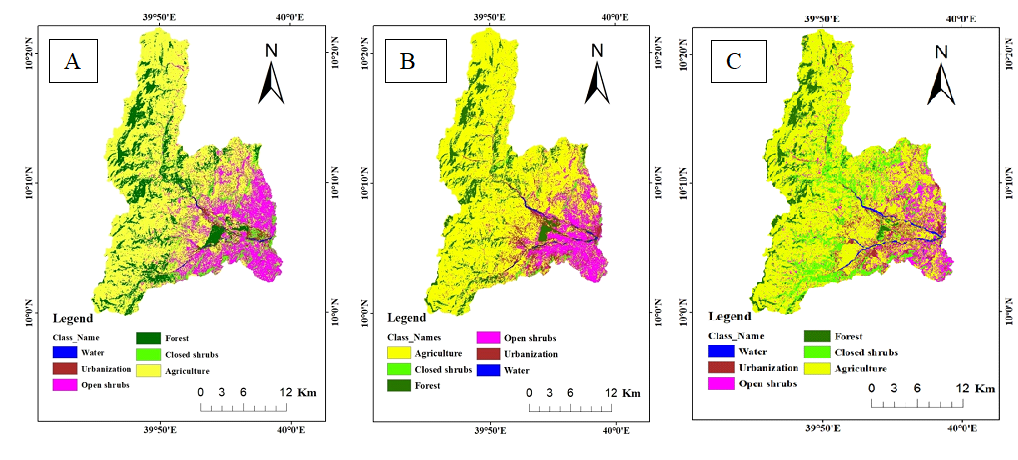
Figure 2: Land use/cover maps of Jewaha catchment A) 1990 B) 2000 C) 2018
3.2. Accuracy assessment
The accuracy assessment was conducted for the 2018 image. An accuracy assessment test was performed using a confusion matrix with 137 randomly selected points for 2018 land cover. The results of supervised classification satellite images were evaluated using the overall accuracy and kappa coefficient. The overall accuracy of maps was 88% and the result of Kappa is 0.81 for current land use. As a result, the kappa coefficient is rated almost perfect for 2018 land cover map and hence the classified image found to be fit for further research.
Table 1: Confusion matrix for the classification of 2018
|
Classified Data |
WATR |
RNGE |
AGRL |
RNGB |
URBN |
FRST |
Total |
Users Accuracy (%) |
|
WATR |
6 |
1 |
1 |
0 |
0 |
0 |
8 |
100 |
|
RNGE |
1 |
6 |
0 |
0 |
0 |
0 |
6 |
85.7 |
|
AGRL |
1 |
4 |
76 |
6 |
0 |
0 |
86 |
87.4 |
|
RNGB |
0 |
1 |
0 |
10 |
0 |
0 |
11 |
90.9 |
|
URBN |
0 |
0 |
1 |
0 |
13 |
0 |
14 |
92.9 |
|
FRST |
0 |
0 |
1 |
1 |
0 |
10 |
12 |
83.3 |
|
Total |
8 |
12 |
79 |
17 |
13 |
10 |
137 |
0.88 |
|
Producers Accuracy (%) |
75 |
54.6 |
97.5 |
58.82 |
100 |
100 |
Overall Accuracy = 88.1% |
|
Note: - WATR=Water body, AGRL = Agriculture, URBN = Urbanization, RNGB = Closed Shrubland, RNGE= Open shrubs, FRST= Forests
3.3. Change Detection
1990 land use/cover result shows agriculture land dominantly covered with 58.8% the total catchment and the rest covered by forests, open and closed shrublands and urbanization with 16.6%, 15.8%, 5.7%and 2.8% respectively. 2000 land use/cover result shows agriculture land dominantly covered with 63.5% the total catchment and the rest covered by forests, open and closed shrublands and urbanization with 12.3%, 14.6%, 3.6%and 5.5% respectively.
2018 land use/cover result shows agriculture land dominantly covered with 66.5% the total catchment and the rest covered by open and closed shrublands and urbanization with 8.3%, 8.9%, 6.4%and 6.78% respectively. Generally, urbanization become increase from time to time and agriculture decrease slightly due to expansion of urbanization. Water body increase slightly due to irrigation structure constructed. The distribution of land cover class as shown in Table 2.
Table 2: The land cover change analysis in terms of percentage
|
Year |
1990 |
2000 |
2018 |
||||
|
SN |
Land cover |
Area(km2) |
Percent (%) |
Area(km2) |
Percent (%) |
Area(km2) |
Percent (%) |
|
1 |
Forests |
94.1 |
16.6 |
69.7 |
12.3 |
47 |
8.3 |
|
2 |
Water body |
1.9 |
0.34 |
2.7 |
0.47 |
5.95 |
1.05 |
|
3 |
Open shrub |
89.6 |
15.8 |
82.8 |
14.6 |
50.7 |
8.9 |
|
4 |
Closed shrubs |
32.5 |
5.7 |
20.6 |
3.63 |
36.5 |
6.44 |
|
5 |
Agricultural |
333.1 |
58.8 |
360 |
63.5 |
388.4 |
66.5 |
|
6 |
Urbanization |
15.7 |
2.8 |
31.2 |
5.5 |
38.4 |
6.78 |
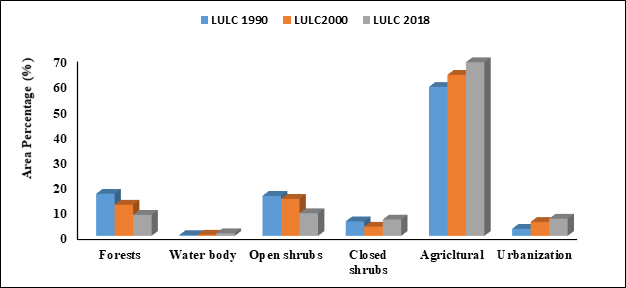
Figure 3: Land use/cover change for 1990, 2000 and 2018 year
Table 3: land use/cover change detection
|
SN |
Land cover classes |
Land use/cover change detection |
||
|
1990-2000 |
2000-2018 |
1990-2018 |
||
|
1 |
Forests |
-4.3% |
-4% |
-8.3% |
|
2 |
Water body |
+0.13 |
+0.58 |
0.71% |
|
3 |
Open shrub |
-1.2% |
-5.7% |
-6.9% |
|
4 |
Closed shrubs |
-2.07% |
+2.81% |
0.74% |
|
5 |
Agricultural |
+4.7% |
+3% |
7.4% |
|
6 |
Urbanization |
+2.7 |
+1.28 |
3.98% |
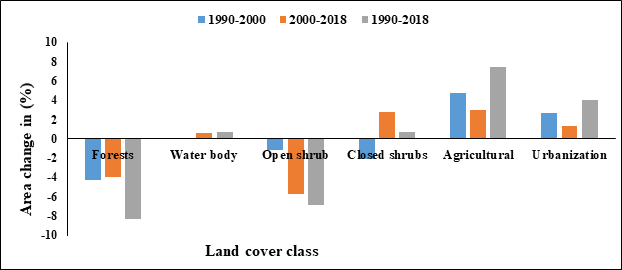
Figure4: Area changes in Lulc between 1990 and 2018
3.4. Socioeconomic data analysis
The economy of farmers is based on agriculture and livestock. Average land holding size of farmers interviewed varied 0.5 to 3 ha per household. Age has a factor for land holding size as a result; older farmers have larger land size than younger ones.
Table 4: Average lands holding in each age category
|
Landholding size for agriculture (ha) |
Age category of farmers (years) |
||||
|
<35 |
35- 44 |
45-54 |
55-64 |
>65 |
|
|
0 to 0.5 |
2 |
1 |
- |
- |
- |
|
0.6 to 1.5 |
3 |
4 |
3 |
3 |
1 |
|
1.6 to 2.5 |
4 |
5 |
4 |
4 |
3 |
|
Greater than 2.5 |
2 |
3 |
3 |
2 |
3 |
Based on the farmers’ knowledge lived in and around the study area, the land cover changes dominantly from forest to Agriculture and from agriculture to urbanization. This judgment was compared and validated with the result of remote sensing data. The land cover conversion from agriculture to urbanization affects the food production for community and conversion from forest to agriculture affect the hydrology of the watershed. More than 89% of the questionnaire respondents were aged between 25 and 65 years, which is the most active age group while less than 11% were above 65 years old.
Table 5: the main direction of LCC in the perception of interviewees (%)
|
The direction of land conversion |
Respondents (%) in age categories |
|||||
|
<35 |
35-44 |
45-54 |
55-64 |
≥65 |
Total of respondents (%) |
|
|
Forest to Agriculture |
14 |
17 |
10 |
8 |
6 |
55 |
|
Forest to closed shrub |
2 |
2 |
2 |
0 |
0 |
6 |
|
Agriculture to urban |
10 |
9 |
8 |
7 |
5 |
39 |
|
Forest to open shrub |
0 |
0 |
0 |
0 |
0 |
0 |
|
Open shrub to agricultural |
0 |
0 |
0 |
0 |
0 |
0 |
|
Closed shrub to agriculture |
0 |
0 |
0 |
0 |
0 |
0 |
|
No observation |
0 |
0 |
0 |
0 |
0 |
0 |
|
Total (%) |
26 |
28 |
20 |
15 |
11 |
100 |
According to the interviewed people’s response, 55% of the respondents observed the main change is from forest to agriculture and 39% of the respondents observed the change from agriculture to urbanization.
This research addressed the dynamics land use/cover change in Jewaha catchment. The satellite data were classified using ERDAS Imagine2015 software to develop land use/cover maps of the catchment. From this study, it can be concluded that there was slightly increasing land use/cover change in Jewaha catchment during the period from 1990 to 2018.The closed shrubs land increase from 2000 to 2018 period due to reforestation policy implemented on Ethiopian millennium. The results revealed that the magnitude of the agricultural land was increased from 4.7%, 3%, 7.4%, and urbanization also increase in 2.7%, 1.28%, 3.98% for 1990, 2000 and 2018respectively. The close shrub land decrease by 2.07% during 1990-2000 and increased by 2.8% and 0.74% from 2000-2018 and 1990-2018 respectively.
Banman, C. (2002). Supervised and Unsupervised Land Use Classification, (Jensen 2000), 1-8. Retrieved from
View ArticleBavani, A. M. , Talebbeydokhti & Vaighan, A. A.(2017). Assessing the impacts of climate and land use/coverchange on streamflow, water quality and suspended sediment in the Kor River Basin, Southwest of Iran. Environmental Earth Sciences, 76(15).
View ArticleCaetano. (2007). A reference sample database for the accuracy assessment of medium spatial resolution land cover products in Portugal. International Geoscience and Remote Sensing Symposium (IGARSS), 3967-3970.
Chakilu, G. G., Moges, M. A., &Tilahun, S. A. (2015). Evaluating the Land use/cover/ cover Dynamics and its impact on Low Stream Flow of Gumara watershed, upper Blue Nile basin, Ethiopia. 3 (November), 2015.
Fan M, Shibata H (2015) Simulation of watershed hydrology and stream water quality under land use/coverand climate change scenarios in Teshio River watershed, northern Japan. Ecol Indic50:79-89.
View ArticleLambin, E. F., Geist, H. J., & Lepers, E. (2003). Dynamics of land-use and land-cover change in tropical regions. Annual review of environment and resources, 28(1), 205-241.
View ArticleTekle, K. & Hedlund, L. (2000). Land Cover Changes between 1958 and 1986 in Kalu District, Southern Wello, Ethiopia. Mountain Research and Development, 20(1): 42 - 51 020[0042:LCCBAI]2.0.CO;2
View ArticleTu J (2009) Combined impact of climate and land use/cover changes on streamflow and water quality in eastern Massachusetts, USA.J Hydrol 379:268-283.
View ArticleXiubin, L. (1996). A review of the international researches on land use/land cover change [J]. Acta Geographica Sinica, 6