Katsanou K.
Department of Geology, University of Patras, Rio, Greece, E-mail: katsanou@upatras.gr
FIRST OUTCOMES OF THE COP METHOD APPLICATION FOR THE ASSESSMENT OF INTRINSIC VULNERABILITY IN THE KARST SYSTEM OF VOURAIKOS CATCHMENT, GREECE
Corresponding Author
Affiliation
Katsanou K.1* and Lambrakis N.1
1Department of Geology, University of Patras, Greece
Citation
Konstantina Katsanou, FIRST OUTCOMES OF THE COP METHOD APPLICATION FOR THE ASSESSMENT OF INTRINSIC VULNERABILITY OF IN THE KARST SYSTEM OF VOURAIKOS CATCHMENT, GREECE(2017)SDRP Journal of Earth Sciences & Environmental Studies 3(1)
Abstract
The karst formations host complex aquifer systems, yet the knowledge of which needs further study. Karst aquifers are particularly vulnerable to pollution because of their hydrological behavior. The mapping of their vulnerability is one of the most simple and effective tools to protect them.
This study aims at the investigation of the vulnerability of the karst aquifers hosted in the carbonate formations of Olonos-Pindos and Gavrovo-Tripolis units. For this purpose the COP method, which is an intrinsic vulnerability mapping method, was applied to study the vulnerability of Vouraikos catchment karst system. Based on the application of this method zones were defined that illustrate five vulnerability classes, including very high, high, moderate, low and very low vulnerability classes. The coverage areas of each class are (38.83%, 25.03%, 24.61%, 11.15% and 0.37% respectively).
Keywords
Vulnerability methods; karstification; Gavrovo-Tripolis zone; Chelmos-Vouraikos Geopark
Introduction
The exploitation, and in many cases the overexploitation of the karst aquifers, the absence of the unsaturated zone, or limited in thickness epikarst zone, coupled with the burden of their quality due to human activities led many researchers, such as Scholz (1994), Vrba and Zoporozec (1994), Hoetzl (1996), Drew and Hoetzl (1999), GSI (1999), Doerfliger et al. (1999), Petelet-Giraud et al. (2000), Goldscheider (2002), Daly et al. (2002), Zwahlen, (2004), Bellos and Stournaras (2002), Panagopoulos and Lambrakis (2006), Koutsi (2007), Civita (2008), in the last few decades, to emphasize on the study of the vulnerability of karst systems to pollution.
In the frame of COST Action 65, in 1995, the European Union, published guidelines for the protection of groundwater. Later on, the Directive 60/2000/EC for the protection and management of all water bodies (European Commission, 2000), and the COST-action 620, in 2004, for assessing and mapping of the vulnerability of karst aquifers were published.
The work of the latter proposed the use of a generalized multicriteria analysis and the assessment of the different factors that affect the vulnerability of the aquifers. Subsequently, a number of methods that were called vulnerability models of the karst aquifers were developed. However, before the announcement of the COST-action 620 results, similar methodologies such as EPIK (Doerfliger et al., 1999) were already published. Later on, the same researcher proposed the RISKE method, as an improvement of the previous one. From the European method other methods such as the COP method (Concentration of flow, Overlying layers, Precipitation; Daly et al., 2002; Goldscheider and Popescu, 2004) and PI method (Protective cover, Infiltration conditions; Goldsccheider, 2005) arose.
Karst systems are mostly developed in inaccessible mountain areas, which is a factor that complicates the application of standard techniques, such as drilling or geophysical applications for their aquifers’ study.
The selection of the most appropriate method for study of the groundwater vulnerability in a certain area depends on the data availability and spatial distribution, the scale of mapping, the purpose of the map, and the hydrogeological setting. The scale mainly depends on the availability of data and their spatial distribution. The better the data availability, the more detailed the map that is derived (Margane, 2003).
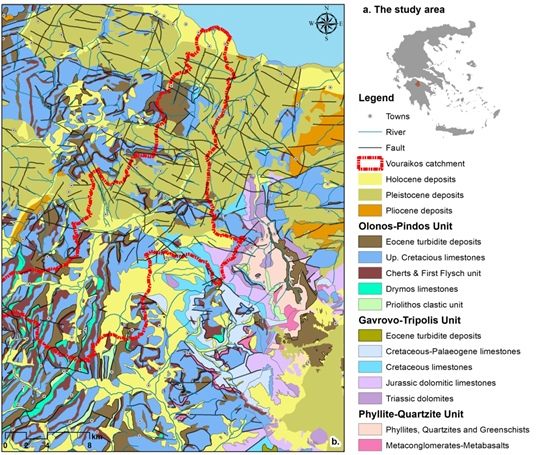
In Greece, the knowledge of the properties and hydrodynamic characteristics of karst aquifers is incomplete, mainly due to the lack of data. The study area is part of the Chelmos-Vouraikos Unesco Geopark, which is located in Peloponnese and covers an area of 550 km2. It is mainly structured by the formations of Olonos-Pindos and Gavrovo-Tripolis units that host significant aquifers within their carbonate formations.
The activities in the area are mainly industrial and livestock activities, such as milk industries, stables, and fish farms that are potential sources of pollution. This multitude of potentially polluting activities makes the assessment of the vulnerability of these aquifers even more urgent. Since the susceptibility to pollution cannot be directly measured in the field; COP method an indirect methodology for its assessment was used.
The mapping of vulnerability will contribute to the identification of the most vulnerable zones of Vouraikos catchment, and hence to the proposal of measures that will substantially contribute to the protection of the highly contagious karst aquifers and to the sustainable management of their water resources.
- Characterization of the study area
The older formations, which constitute the geological bedrock of the area, belong to the Phyllite-Quartzite unit. This unit is impermeable and it is visible outside the Vouraikos catchment, where its outrops constitute a boundary for surface and groundwater.
The Gavrovo-Tripolis unit comprises of a sequence of carbonate formations that were deposited from the Triassic to Eocene and are abundant in Chelmos Mountain, where karstified Cretaceous thick-bedded and Eocene medium-bedded limestones host important aquifers.
The Olonos-Pindos unit overlaps the Gavrovo-Tripolis unit, forms Erymanthos Mountain, and comprises of Upper Cretaceous platy limestones and Jurassic medium-bedded limestones of Drymos. Although the presence of cherts prevented the intense karstification of the carbonate formations of this unit, they still host important aquifers, as for example the one within the Kertezi area, where the homonymous springs of Vouraikos River are being discharged.
The Upper Cretaceous limestones are the most permeable formation of the Olonos-Pindos unit. They form a heterogeneous, slightly karstified aquifer that consists of carbonate beds of small thickness with chert intercalations. This aquifer, which is one of the major aquifers in the region lies in depth of 100 m and is extended to the Corinth Gulf where, it is being discharged through sub marine springs (Nikas, 2004).
A sequence of Plio-Pleistocene sediments as well as Holocene fluvial deposits was deposited uncomformably above the Pindos formations. The sediments within the drainage basins are distinguished into three different facies, lacustrine- lagoonal marls, and marine sandstone, forming elevated terraces, and coarse-grained braided river or fan delta deposits (Poulimenos et al., 1989).
The difference between the Gavrovo-Tropolis and Olonos-Pindos limestones is that the Gavrovo-Tropolis limestones present an extensive network of conduits due to karstification, while the Olonos-Pindos limestones display fissures and fractures within them aquifers develop.
The structure of Olonos-Pindos limestones, resulting in the presence of a sequence of layers with impermeable cherts and permeable limestones is the reason why within these formations aquifers and consequently springs occur at different levels. The Olonos-Pindos aquifer is a fissured karst aquifer of small to moderate thickness, intensively tectonized and folded in alterations with the flysch and cherts. Most of the aquifer’s discharge is through springs at the contact with the more impermeable formations.
On the contrary, the Gavrovo-Tripolis limestones host a karst aquifer of considerable thickness (up to 1000 m), with a deep and large conduit flow system. The discharge of the aquifer is through springs of significantly great volume, at the altitude of their base layer, such as the impermeable layer of phyllites or slightly higher than that.
Impermeable formations, such as phyllites, flysch and cherts, play an important role, since in many cases they define the permeable formations and determine the groundwater flow.
Materials & Methods
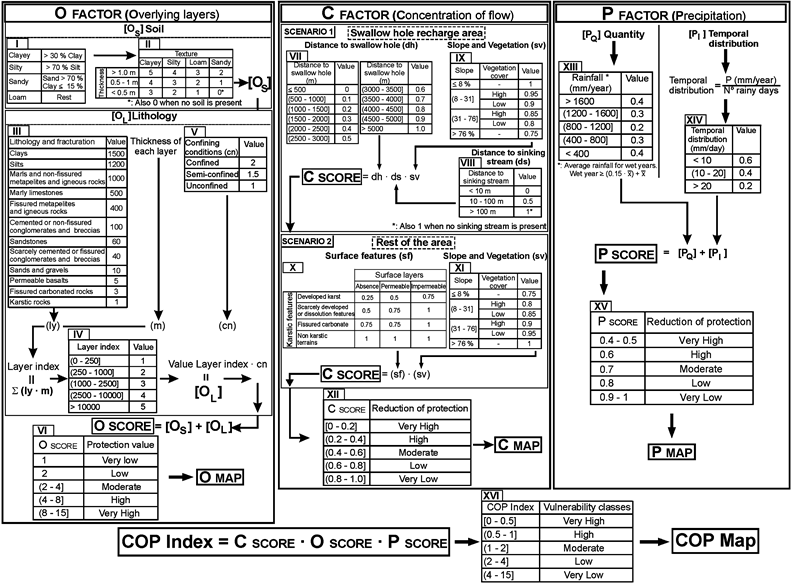
The COP method is an intrinsic vulnerability mapping method. It comprises, and is the acronym, of three main factors: concentration of flow (C), overlying layers (O) and precipitation (P). Each one represents the variables involved in groundwater vulnerability that are discretisized using scored intervals according to the relative degree of sensitivity to contamination.
COP Index Map = C x O x P (1)
C factor is related to the surface flow recharge conditions; O factor expresses the capacity of the overlying layers to protect the aquifer and P factor has to do with the precipitation of the area.
Vulnerability maps are mostly constructed with the use of geographic information systems (GIS) that enable the user to match data on the characteristics of the study area, while keeping the geographic framework as reference. Previously to the construction of the vulnerability maps, hydrogeological characterization of the studied aquifer was carried out.
The details of the COP method are shown in Figure 2 (Vıas et al. 2006), while a brief description concerning the evaluation of the C, O and P factors is discussed together with the results of the application in the following paragraph.
All the maps for the study area were constructed using ArcGIS 10.1.
Results
4.Estimation of the factors, results and Discussion
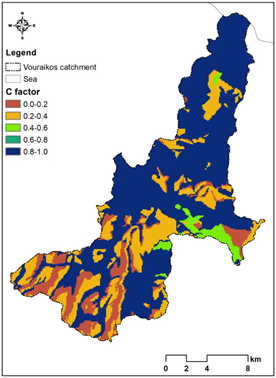
4.1 The C factor
The C factor is the flow concentration map and represents the types of infiltration occurring on the catchment. Karst systems are characterized by a duality of infiltration, where infiltration can occur diffusively on the entire catchment and/or concentrated in sinkholes or dolines (fast flow pathways) (Zwahlen, 2004). Hence, it represents the potential for contaminated water to bypass the protection provided by the overlying layers (Daly et al., 2002). This factor is similar to the I factor of the EPIK (Doerfliger and Zwahlen 1998) and PI methods (Goldscheider et al. 2000).
In the COP method, the catchment is divided into two main parts. The first part (Scenario 1) includes the recharge area of karst features, i.e. dolines or sinkholes. The second part (Scenario 2) consists of the rest of the area, where no karst features were identified on the surface. The process that led to the estimation of this factor is described in Figure 2.
The C factor for Scenario 1 consists of the multiplication of three main factors (distance to swallow hole (dh), vegetation and slope (sv) and distance to sinking stream (ds)).
Cscore= sf x sv (2)
In order to extract the C factor, it is required to construct sf and sv maps. The required data were extracted from land cover, geological and soil maps. The slopes of the area were extracted from the Digital Elevation Model (DEM) in percent, and were reclassified into three (3) categories (Fig. 2), which were assigned weights accordingly for constructing sv map.
The karst features of the broader area were investigated both by fieldwork and topographic maps of the region. In the study area fieldwork showed that within the catchment of Vouraikos the karst is not mature enough, hence the surface karst features are not well developed and also no sinking streams were indentified. In this area, the flow is mainly diffuse, this why the C factor was evaluated by Scenario 2.
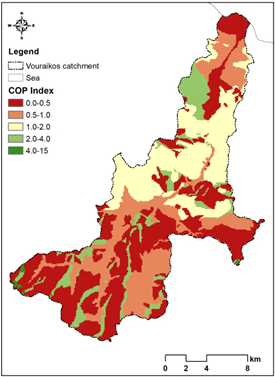
The distribution of C factor is given in Figure 3 where it is noticed that the higher reduction of protection (low values of the C factor) is found in karst areas with low slops and no surface layers as well as in regions with concentrated infiltration through swallow holes.
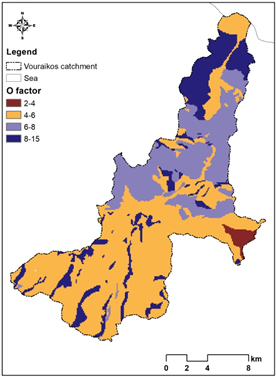
4.2 The O factor
The O factor considers the protection provided for the aquifer by the physical properties and thickness of the layers (Vias et al. 2010; Zwahlen 2004; Daly et al. 2002). O factor is the sum of two subfactors:
Oscore= OS + OL (3)
The OS subfactor takes into account the overlying layers. For example, areas that are not covered by soil are assigned the value 0, while any sandy soils of thicknesses greater than 1.0 m are assigned the value 2. Most of the soils of the study area ensure limited or no protection.
The values of the OL subfactor were estimated from the deep drilling project of the Corinth Laboratory Project (Cornet et al., 2004). At the southern part of the catchment, the aquifer is at free surface with a very limited protection due to the unsaturated zone corresponding to an OL value equal to 1.
It considers the rock nature (mostly effective porosity and hydraulic conductivity) and the scale of fracturing (ly), the thickness of each layer (m) and every confining condition (cn). The confining condition parameter (cn) is a weighting coefficient for the layer index, similar to those of the GOD method (Foster, 1987) and the PI method (Goldscheider et al. 2000). The values assigned to the (cn) parameter give the highest protection to the confined aquifer, whereas an unconfined aquifer is not affected by this parameter (cn=1).
The total natural protection provided to the groundwater of the region is shown in Figure 4. This O map resulted from the superposition of OS and OL maps and adding their scores. This map represents the natural protection ensured both by the overlying soils and the unsaturated zones. The O factor describes the natural protection of groundwater to contamination in case that all the amount of rainfall infiltrates diffusely into the soil and percolates through the unsaturated zone towards the groundwater.
The lowest values of the O factor, corresponding to higher vulnerability, are found in areas where carbonate rocks outcrop, and where the soil is poorly developed or absent due to high slopes. The higher values of O factor correspond to areas that are covered by soils, and display high protection, or lithological types of low permeability.
4.3 The P factor
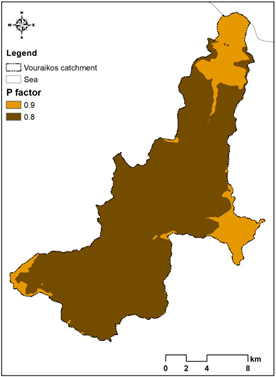
The P factor represents the climatic conditions that prevail in an area. It takes into consideration the spatial and temporal variability of precipitation which is the transport agent of contamination from the surface of soil to the groundwater resource.
As shown in Eq. 4, P factor is the sum of two subfactors: a. the PQ subfactor, which has to do with the quantity of precipitation, and b. the PI subfactor, which relates to the intensity of precipitation.
Pscore= PQ+PI (4)
The precipitation data that was used for the estimation of the P factor was carried out using the meteorological stations of the area for the period 1975-1999 (Nikas, 2004).
The average value of rainfall for this period and the average number of rainy days per year were found respectively equal to 1001.7 mm and 150.5 days. These values led to the estimation of the P factor in the range of 0.8 to 0.9, which reflects that the reduction in the level of protection due to the precipitation is very low. The distribution of P factor is shown in Figure 5.
Finally, the COP map was obtained by superposing the O, C and P maps and multiplying their scores. The results are shown in Figure 6, reveals the existence of five vulnerability classes within the study area. The percentages of area for each vulnerability class are given in Table 1.
These areas coincide with outcrops where the protection assigned by the O factor is low to moderate. Areas of very low and low vulnerabilities represent 11.15% of the total surface area and correspond to those where the protection provided by the unsaturated zone is very high (Fig. 3).The aquifer under these areas is protected by thick layers of sediments.
Zones of moderate vulnerability include areas of high vulnerability and areas of moderate vulnerability of the map in Figure 6. These zones may include some small areas of low and very low vulnerability, which are located within areas of high and moderate vulnerability shown by the COP map. Zones of low vulnerability include areas that are mainly covered by formations of low permeability like flysch. The P factor map does not contribute to the vulnerability zoning in low and very low vulnerability classes that are found at the northern part, towards the coastline where the low permeable Pliocene marls and soils protect the groundwater.
The existence of some polluted samples in the region may affirm the direct relation between human activities and the deterioration of the groundwater quality.
Conclusion
In order to evaluate the intrinsic vulnerability of groundwater contamination in Vouraikos catchment, the COP method was chosen. The results showed that all vulnerability categories are present, while the high and moderate are the most extensive ones.
The areas of high vulnerability are mostly found on the top of carbonate formations where the karst landforms are not covered by soil, their degree of karstification is moderate and the topography is high in combination with little or absence of vegetation.
The results from the construction of the vulnerability map are expected to contribute to the assessment of the risk of pollution of the aquifers in the area and indirectly to the determination of the carbonate aquifers properties of the Olonos-Pindos and Gavrovo-Tripolis units. In addition, they will provide direct information on the sustainable management of its water resources.
The local authorities can easily use the simple zoning map proposed in this work in order to prohibit potentially polluting activities on zones of high vulnerability. They may allow certain polluting activities on moderate vulnerability areas, while imposing strict technical inspections.
Particular attention is drawn to the southern part of the catchment, where the vulnerability is very high.
Finally, it is necessary to note that in the frame of this paper vulnerability index values obtained by this method have not been compared with other methods. The validation of the method is the next step and will be happen in the near future. Αt a later stage, the validation can be done by installing quality control points in the region and regulating polluting activities on the catchment.
Acknowledgement
The authors would like to deeply thank the Greek State Scholarship Foundation (I.K.Y.) for the financial support of this research.
Images and Tables
|
COP Index |
Vulnerability class |
Percentages of area (%) |
|
0.0-0.5 |
Very high |
38.83 |
|
0.5-1.0 |
High |
25.03 |
|
1.0-2.0 |
Moderate |
24.61 |
|
2.0-4.0 |
Low |
11.15 |
|
4.0-15.0 |
Very low |
0.37 |
The COP index shows very high vulnerability values throughout 38.83% of the total area is due to the existence of limestones of Gavrovo-Tripolis unit and Olonos-Pindos units (OL=1). These areas have no soils (Os= 0) or have only loam soils of small thickness, less than 0.1 m (Os=1). On the other hand, areas of high and moderate vulnerabilities cover more than 24.61% of the total area.
References
Bellos, Th. and Stournaras, G. (2002) Karstic forms in central Greece (area of mountains Parnasse, Giona, Elikonas) and their implication in the field of groundwater vulnerability, 6th National Geographic Congress of Greek Geographical Society, Thessaloniki.
Civita, M. (2008) An improved method for delineating source protection zones for karst springs based on analysis of recession curve data. Hydrogeology Journal 16, 855.
View ArticleCornet, F.H., Doana, M.L., Moretti, I., Bormc G. (2004) Tectonics Drilling through the active Aigion Fault: the AIG10 well observatory. Comptes Rendus Geoscience 336 (4-5): 395-406.
View ArticleDaly, D., Dassargeus, A., Drew, D., Dunne, S., Goldscheider, N., Neale, S., Popescu, IC., Zwahlen, F. (2002) Main concepts of the European approach for (karst) groundwater vulnerability assessment and mapping. Hydrogeology Journal 10(2): 340-345.
View ArticleDoerfliger, N., Zwahlen, F(1998) Practical Guide, Groundwater Vulnerability Mapping in Karstic Regions (EPIK). Swiss Agency for the Environment Forests and Landscape (SAEFL), Bern.
Doerfliger, N., Jeannin, P.Y., Zwahlen, F. (1999) Water vulnerability assessment in karst environments: a new method of defining protection areas using a multi-attribute approach and GIS tolls (EPIK Method). Environmental Geology 39(2): 165-176.
View ArticleDrew, D., Hoetzl, H. (1999) Karst Hydrogeology and Human Activities. Impacts, Consequences and Implications- International Contributions to Hydrogeology (IAH) 20, Balkema.
Foster, S. (1987) Fundamental Concepts in Aquifer Vulnerability, Pollution Risk and Protection Strategy. In: Van Duijvenbooden, W. and Van Waegeningh, H.G., Eds., Vulnerability of Soil and Groundwater to Pollutants, Committee on Hydrological Research, The Hague, 69-86.
Goldscheider, N., Klute M, Sturm S, Holtz H (2000) The PI method - a GIS-based approach to mapping groundwater vulnerability with special consideration of karst aquifers Zeitschrift f?r angewandte Geologie 46:157-166.
Goldscheider, N. (2002) Hydrogeology and Vulnerability of Karst Systems- Examples from the Northern Alps and the Swabian Alb. Dissertation, University Karlsruhe, 236 pp.
GSI (1999) Groundwater Protections Schemes. Department of the Environmental and Local Government, Environmental Protection Agency and Geological Survey of Ireland 24 pp. Dublin.
Hoetzl, H. (1996) Grundwasser in Karstgebieten. Grundwasser 1/1:5-11.
View ArticleKoutsi, R. (2007) The role of epikarst in assessment and mapping of the karstic formations vulnerability, using the under establishment new relevant European method, PhD Thesis, NKUA.
Nikas K., 2004. Hydrogeological conditions of NW Achaia. PhD Study. University of Patras.
Panagopoulos, G., Lambrakis, N. (2006) The contribution of time series analysis to the study of the hydrodynamic characteristics of the karst systems. Application on two typical karst aquifers of Greece (Trifilia, Almyros Crete). Journal of Hydrology 329, 368-376.
View ArticlePetelet-Giraud, E., Doerfliger, N., Crochet, P. (2000) RISKE: method d'evaluation multicritre de la cartographie de la vulnerabilite des aquiferes karstiques. Application aux systemes des Fontanilles et Cent-Fonts karstic aquifers (H?rault, S. France). Hydrog?ologie 4, 71-88.
Poulimenos, G., Albers, G. and Doutsos, T., 1989. Neotectonic evolution of the central section of the Corinth graben. Z. dt. geol. Ges 140: 173-182.
Scholz, W. (1994) Geohydrologische Kriterien bei der Ausweisung von Grundwasserschutzgebieten, dargelegt an Fallbeispielen f?r Festgestiens- und Karstgrundwaaserleiter. DVGW-Schriftenreihe Wasser 84,113-126.
Vias, J, Andreo, B., Ravbar, N, Holtz, H. (2010) Mapping the vulnerability of groundwater to the contamination of four carbonate aquifers in Europe. Journal of Environmental Management 91, 1500-1510. PMid:20346572
View Article PubMed/NCBIVrba, J., Zoporozec, A. (1994) Guidebook on Mapping Groundwater Vulnerability vol 16. Int Assoc Hydrogeol, Int Contrib Hydrogeol 16, Heinz Heise, Hannover, Germany.
Zwahlen F (2004) Vulnerability and risk mapping for the protection of carbonate (karst) aquifers. EUR 20912. European Commission, Directorate-General XII Science, Research and Development, Brussels Hydrogeology Journal 14:912-925.