Ibeneme, S.I.
Ph: +234(0)8026182505
Email : peseesabim@gmail.com, sabinusibeneme@futo.edu.ng
© 2019 Sift Desk Journals. All Rights Reserved
VOLUME: 4 ISSUE: 5
Page No: 696-707
Ibeneme, S.I.
Ph: +234(0)8026182505
Email : peseesabim@gmail.com, sabinusibeneme@futo.edu.ng
Ibeneme Sabinus I., Okoro Chiedozie, Ezetoha Nnaemeka O. Ahiarakwem Cosmas A., Nwankwor Godwin I.
Department of Geology, Federal University of Technology Owerri, Imo State, Nigeria
Shamsollah Ayoubi(ayoubi@cc.iut.ac.ir)
IBENEME SABINUS IKECHUKWU, INTEGRATING FIELD AND LANDSAT DATA IN STRUCTURAL MAPPING OF GULLY EROSION SITES WITHIN ORLU-OKIGWE AXIS SOUTHEASTERN NIGERIA(2019)Journal of Earth Sciences & Environmental Studies 4(4)p:696-707
Field and Landsat data were integrated to precisely map the structural orientations of gully erosion sites within Orlu-Okigwe axis Southeastern Nigeria with the aim of assessing the structural aspects of both the causes and effects of gully erosion and their associated hazards within the study area. Sixteen (16) gully erosion sites were mapped and studied. All the gully erosion sites in the northeastern and northwestern parts of the study area are more developed than those in other parts of the area. These areas are dominated by Ameki and Nsukka Formations which porous, permeable, fissile and friable properties of their sand/sandstone units aid being easily dispersed. The average gully geometries-length, width and depth of the studied gullies range from 138.4 to 1997m, 9.7 to 42m and 12.4 to 62m respectively. Their approximate cross sectional area ranges from 63.05 to 1197m2 with the average soil volume loss ranging from 0.13 x10⁵ to 8.47x10⁵m3 and drainage slope range of -0.02 to 0.03. The gully erosion at Ezumezu Urualla in Ideato North Local Government area was observed to have the highest volume of soil loss (8.47x10⁵ m3). This could be as a result of the intense scouring effect of surface run off occasioned by the enhanced topography of the gully axis with the highest drainage slope of 0.03. The end of the Ezumezu Urualla gully site terminated at a straight course path of the flowing Orashi River which is at its youthful stage with pronounced vibrancy thereby acting as a quick sediment receptacle. This condition permits quick transportation of washed out soils to the river which moves same downstream instantly. All the gully erosion sites in the study area trend in the NE-SW direction which coincides with the trend of one of the trans-oceanic mega lineaments (Chain and Charcott fracture zone) which extended into the Nigerian section of the African craton. This is indicative of the fact that the erosion menace in the area is structural as evidenced by high concentration of lineaments within the vicinity of these gullies. The major rivers in the area exhibit dendritic patterns depicting structurally controlled river system and flow in the NW-SE direction (with their tributaries flowing majorly in the NE/SW direction) which are perpendicular to the trend of the gullies. This shows that the direction of flow of major rivers in the area follows axis of recent structural failures whereas the gullies trend along the axis of ancient structural failures. The lineament density in the study area varies from 20-50km per 100km2 in the area. Out of the 368 lineaments digitized from edge enhanced Landsat7 ETM+ data about 48 lineaments plot along the NE-SW direction which represents about 13% of the entire data. Subordinate trends include N-S, NNE-SSW, NNW-SSE and NW-SE directions. Thus there is a direct relationship between the trend of the observed major lineaments as structural features and the trend of the gullies in the area. The likely cause of the gullies in the study area is not just only the well known surface phenomenon of washing away of loose top soils by moving water but also due to both near surface and deep seated structural weaknesses along the axis of these gullies.
Keywords: Erosion, Gully, Gully Geometry, Landsat, Lineament, Lineament Density, Orashi River
Soil erosion is the physical removal of loose and friable portion of soil from one location to another by some known actions cum agents. Erosion physically removes materials (soil) in place after weathering (breakdown of rock or mineral materials) have broken them down into smaller pieces which are movable (Akpokodje et al 2010). Imo State has the fifth highest concentration of active gully site in Nigeria (Onu 2011). It is indeed surprising that erosion continues to pose serious environmental problems in southeastern Nigeria despite all efforts by different authorities to check the ugly trend of this menace (Ezezika and Adetoria 2011). Most of the control measures often utilized in trying to solve this problem were anchored on the premise that erosion menace are often caused by running water with none looking in-depth at the structural integrity of the soils underlying the gully sites. Hence this research intends to fill the gap that is lacking in knowledge as far as erosion menace in the study area is concerned.
2.The Study Area
It is located within latitude 50 30’ N and 50 55’ N and longitude 70 05’ E and 70 25’ E in the tropical rain forest zone of Nigeria, with mean maximum temperature of 270C and total annual rainfall exceeding 250mm (Ezemanye and Emeribe, 2012). The population density of the area is about 1000 people per kilometer square. This dependence on land has led to the over exploitation of land resources in the region. The location and Digital Elevation Model (DEM) maps of the area are shown in figures 1 and 2 below.
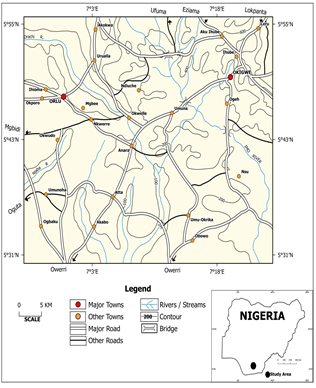
Fig 1: Location Map of the Study Area
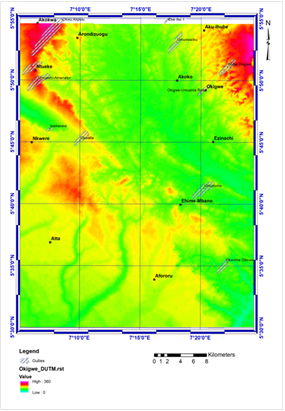
Fig 2: Digital Elevation Model (DEM) Map of the Study Area
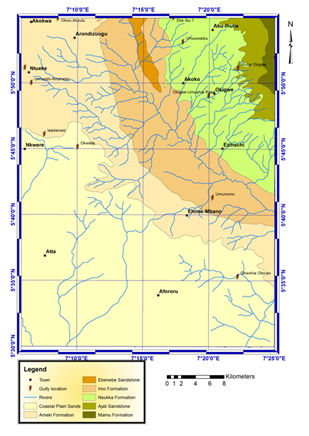
Fig 3: Geological map of the study area
3. Geology of the Area
The geology of the study area is part of Anambra Basin. The area lies at the Southeastern part of Nigeria. It is a sedimentary terrain which is predominantly underlain by the following geologic formations: Benin, Ameki, Imo Shale, Nsukka, Ajali and Mamu Formations. The occurrence, characteristics lithological descriptions of these geologic formations have been well documented by Wilson (1925), Reyment (1965), Kogbe (1975), Herngreen and Chlonova, (1981), Herngreen et al. (1996), Durugbo (2013) and Uzoegbu et al, 2013. Table 1 shows the Stratigraphic Sequence within Southeastern Nigeria. The geologic map of the area showing the different geologic formations is shown in figure 3.
Table 1: Stratigraphic Sequence within Southeastern Nigeria (Reyment, 1965)
|
Age |
Formation |
Lithology |
|
Miocene-Recent |
Benin Formation |
Medium-coarse grained, poorly consolidated sands with clay lenses and stringers |
|
Oligocene-Miocene |
Ogwashi Formation |
Unconsolidated sands with Lignite seams |
|
Eocene |
Ameki Formation, Nanka sands |
Grey clayed sandstone and sandy clay stone |
|
Paleocene |
Imo Shale |
Laminated clayed shale |
|
Maastrichtian |
Nsukka Formation
Ajali Sandstone |
Sandstone intercalating with shale, poorly consolidated sandstone.
Typically cross-bedded with minor clay layers |
|
Lower Maastrichtian |
Mamu Formation |
Shale, sandstone mudstones and coal seams |
|
Campanian |
Mkporo/Enugu shale |
Dark grey shale, clayed shale with clay lenses |
|
Turonian |
Ezeaku Formation |
Black shale with clay and limestone lenses |
The first stage of the field study was identification of the gully erosion channels, while the second stage involved coordinate and elevation measurements using GPS CSX 76 version. Oral interview was also conducted with some elders of the community. Gully sites and drainage channels including the natural erosion channels were traced by foot. The height (depth) of gully from the head to the terminal point of the gully was determined using leveling staff while the width and length were measured using a measuring tape at some locations but generally extracted from the Landsat 7 Enhanced Thematic Mapper (ETM+) data scene of the study area which was acquired online from the Global Land Cover Facility (GLCF). Digital Elevation Model for the study area was generated from the Shuttle Radar Topographic Mission (SRTM) acquired by SRTM during an 11-day mission in February 2000. The separate Landsat 7 ETM+ scenes were combined into a mosaic using ERDAS IMAGINE Version 9.0. The mosaic was exported to Ilwis 3.0 academic software where the study area was windowed using the sub-map routine. The various ETM+ bands were then subjected to computer processing. The processing flowchart is shown in figure 4.
The gully cross sectional area was computed using a notable formula of triangulation method. The distance of the gully head estimated incision point to the nearest residential area was measured at each of the gully site visited. At each gully site, five elevation points were measured at 100 m interval from the gully head, and along the natural drainage channel.
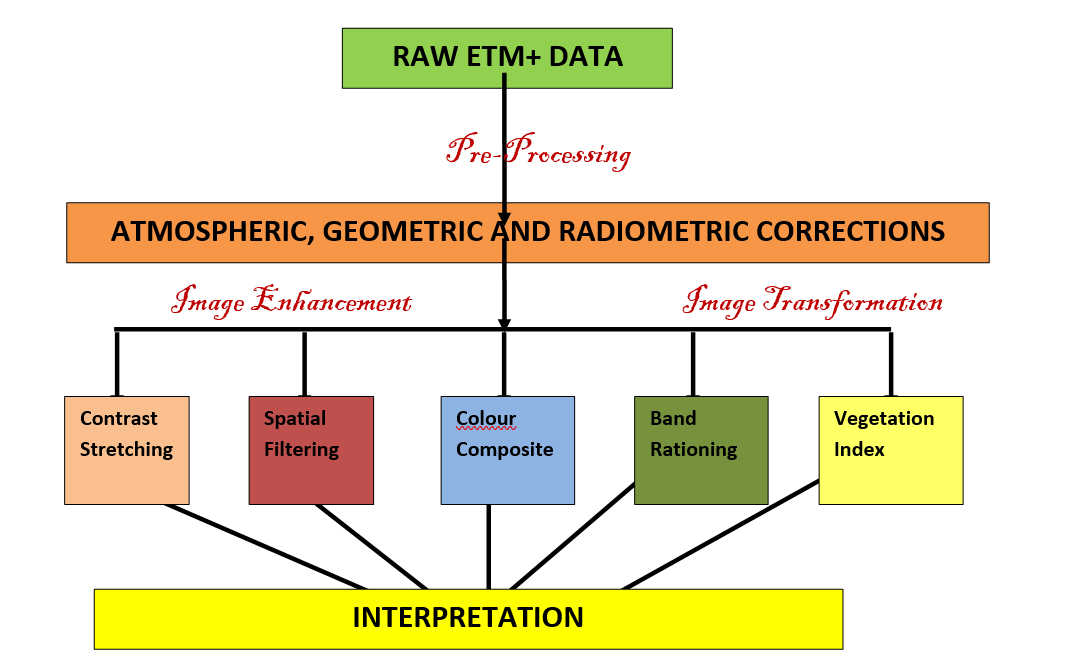
Fig 4: Flowchart for Landsat7 ETM+ Data Processing, Analyses and Interpretation.
A total of sixteen (16) gully erosion sites were mapped and studied. All the gully erosion sites in the northeastern and northwestern parts of the study area are more developed than those in other parts of the area. The latter area is dominated by the Ameki and Nsukka Formations whose sand/sandstone units have been known to be highly porous, permeable, fissile and friable which can easily be washed away by a surface run off. All the gully erosion sites in the study area trend in the NE-SW direction which coincides with the trend of one of the trans-oceanic mega lineaments (Chain and Charcott fracture zone).
5.1 Field Results
At some selected gully sites, five elevation points were measured at 100 m interval from the gully head, and along the natural drainage channel. A gradual increase in elevation was observed from the gully head to 1.0 km upland in some areas and decreases in other areas. By direct reading using a GPS, the following plots were generated (Figures 5 to 10).
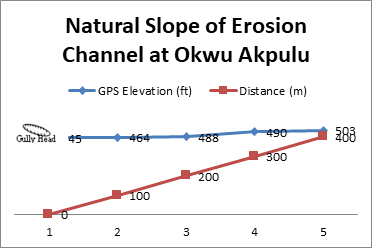
Fig 5: Natural slope of erosion channel at Okwu Akpulu Gully Site
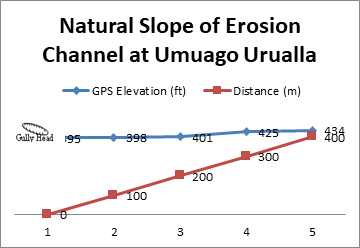
Fig 6: Natural slope of erosion channel at Umuago Urualla Gully Site
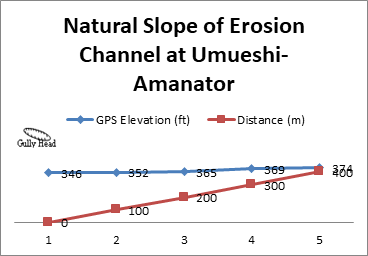
Fig 7: Natural slope of erosion channel at Umueshi-Amanator Gully Site
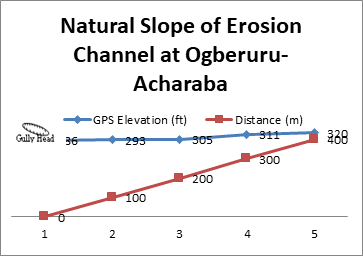
Fig 8: Natural slope of erosion channel at Ogberuru-Acharaba Gully Site
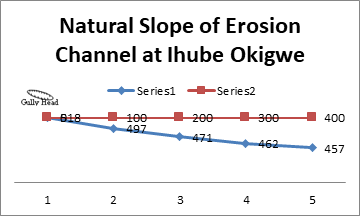
Fig 9: Natural slope of erosion channel at Ihube Okigwe Gully Site
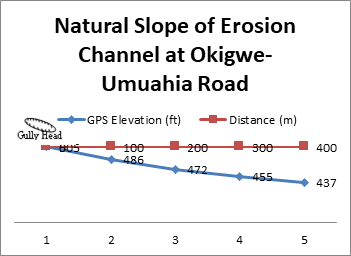
Fig 10: Natural slope of erosion channel at Okigwe-Umuahia Road Gully Site
Figures 5 to 10 show the plot of Natural slope of erosion channel for Akpulu, Umuago Urualla, Umueshi-Amanator, Ogberuru-Acharaba, Ihube Okigwe and Okigwe-Umuahia gully erosion sites. The Vertical Elevation (VE), Horizontal Distance (HD) and Drainage Slope (DS) for Akpulu gully erosion are 58 ft (17.7 m), 1000m and 0.0177 respectively. For Umuago Urualla, these values are 39 ft (11.89 m), 1000m and 0.0119 respectively. At Umueshi-Amanator, they are 28 ft (8.537 m), 1000m and 0.00854 respectively. Vertical Elevation (VE) of 34 ft (10.366 m) for a total Horizontal Distance (HD) of 1000m gave a Drainage Slope (DS) of 0.0104 across Ogberuru-Acharaba area along the natural erosion channel. For Ihube Okigwe, total Vertical Elevation (VE) of -61 ft (-18.59 m) for a total Horizontal Distance (HD) of 1000m represents a Drainage Slope (DS) of -0.0186 across Ihube Okigwe area along the natural erosion channel. A total Vertical Elevation (VE) of -68 ft (-20.73 m) for a total Horizontal Distance (HD) of 1000m represents a Drainage Slope (DS) of -0.0207 across Okigwe-Umuahia area along the natural erosion channel. Table 2 below shows the mean gully geometries for all the gully sites studied.
Table 2: Gully Erosion Sites Studied and their measured Parameters
|
Gully Erosion Site |
LGA |
Lat. (N) |
Long. (E) |
Elevation (ft) |
Gully Trend |
Approx. Mean Gully Length (m) |
Approx. Mean Gully Width (m) |
Approx. Mean Gully Depth (m) |
Approx. Cross Sectional Area of Gully (m2)x105 |
|
Umueme Obodoukwu |
Ideato North |
5o28'26'' |
7o02'13'' |
426 |
NE-SW |
413 |
26 |
29 |
4.19 |
|
Okwu Akpulu |
Ideato North |
5o55'27'' |
7o08'28'' |
473 |
NE-SW |
6500 |
42 |
57 |
8.47 |
|
Umuago Urualla |
Ideato North |
5o50'20'' |
7o02'21'' |
401 |
NE-SW |
1997 |
15 |
28 |
1.39 |
|
Umuturu Ezemazu |
Ideato North |
5o51'01'' |
7o06'00'' |
374 |
NW-SE |
742 |
37 |
62 |
7.78 |
|
Umueshi-Amanator |
Ideato South |
5o50'00'' |
7o06'28'' |
346 |
NE-SW |
972 |
35.9 |
18.6 |
3.29 |
|
Okwohia Obowo |
Obowo |
5o35'20'' |
7o22'14'' |
267 |
NE-SW |
480 |
17 |
33.2 |
1.35 |
|
Umunumo |
Ehime Mbano |
5o41'20'' |
7o20'19'' |
295 |
NE-SW |
748 |
14 |
27 |
1.41 |
|
Isiekenesi |
Ideato South |
5o46'08'' |
7o07'30'' |
351 |
NE-SW |
225.85 |
32.4 |
12.4 |
0.53 |
|
Umuaghobe-Ogboko |
Ideato South |
5o48'03'' |
7o04'20'' |
338 |
NW-SE |
138.4 |
25.8 |
14.5 |
0.31 |
|
Ogberuru-Acharaba |
Orlu |
5o47'03'' |
7o01'00'' |
286 |
NE-SW |
476 |
11 |
17.8 |
0.47 |
|
Iyi Uzo Ihioma |
Orlu |
5o42'21'' |
7o02'17'' |
253 |
NW-SE |
210 |
9.7 |
13 |
5.08 |
|
Ihube Okigwe |
Okigwe |
5o51'02'' |
7o22'02'' |
518 |
NE-SW |
712 |
31 |
46 |
0.13 |
|
Okwelle |
Onuimo |
5o45'06'' |
7o10'02'' |
417 |
NE-SW |
467 |
10.2 |
27 |
0.64 |
|
Okigwe-Umuahia Road |
Okigwe |
5o49'02'' |
7o20'00'' |
505 |
NE-SW |
543 |
26 |
39 |
2.75 |
|
Umuowaibu |
Okigwe |
5o53'07'' |
7o218'00'' |
495 |
NE-SW |
710 |
24 |
58 |
4.90 |
|
Eke Ibu 1 |
Okigwe |
5o55'00'' |
7o217'21'' |
518 |
NE-SW |
238 |
16 |
36 |
0.69 |
5.2 Landsat 7 ETM+ Results
The linear stretch applied in the raw ETM+ data of the study area automatically expands the DN range of each band. It is observed that the stretched band 7 image in fig 11 shows marked improvement from which further interpretations were made.
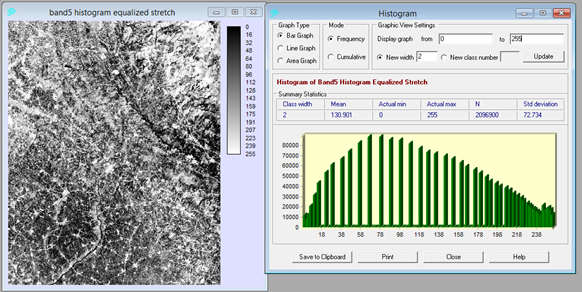
Fig 11: Contrast Stretched band 7 image of the study area.
A total of 368 lineaments (fig 12A).were identified and delineated in order to generate a lineament map for the study area. Only lineaments longer than 1km were captured during on-screen digitization. The distribution of frequency and lineament length across the study area is displayed on a rose plot (fig 12B). The rose diagrams display the lineaments in their subtle trends and their dominant trend are in NE-SW and NWW-SEE directions. The rose plot reveals that the dominant trend for lineaments in the study area is NE-SW. Statistical report shows that about 13.0% of the data plot along this direction (between N30oE to N60oE). Subordinate trends include E-W and NW – SE directions. The rose diagram on lineaments at three different zones of the area (Fig 12B) reveals that the major trend in those zones is the predominant NE-SW with a well pronounced mixed trend towards the south. It is observed that higher densities exist around the axis of the gully erosion sites indicating zones of pronounced weaknesses. Fig 13 shows the Rose Diagram superimposed on the lineament map of the area. From the figure, it could be deduced that the northern and northeastern parts of the area with well distributed lineaments correspond with areas of pronounced gully development with the Rose plot having its resultant mean direction in the NE-SW direction. Towards the southern part of the area, there is a mixed behavior in the structural direction as shown in the Rose plot. The mean resultant direction is in both the NE-SW and NW-SE directions (Fig 13).
Figs 14 and 15 show the lineament density map and lineament draped on filtered band 5 map respectively. A closer look at these maps shows that there is high density of lineaments of the order of 20-50km per 100km2 within the areas occupied by the gully sites. This shows intense deformation of the area by agents of soil weathering that acted as forerunner to gully development. Figure 16 shows lineament draped on the drainage map of the study area. It shows that the dendritic drainage pattern observed in the area is structurally controlled as the lineaments indicating structural failures or zones of structural weaknesses trend parallel to the axis of the major rivers and their tributaries in the study area. The lineament draped on the Geologic and Drainage maps of the area (Fig 17) shows that the major rivers in the area flow parallel to the geologic boundaries whereas their tributaries cut across the geologic boundaries joining the main river at almost acute angle. This signifies the impervious nature of the Imo and Mamu Formations as they do not allow percolation of surface water and possible transport to join the underground water system. There is pronounced surface flow through these formations along weak zones to join the Main river (Imo river).
The Normalized Difference Vegetation Index (NDVI) image (Fig 18) which is a measure of the index of plant “greenness” or photosynthetic activity, was generated using the vegetation index module in Idrisi 32; the resulting image gives an overview of the vegetation spread in the study area. This transformation also helps in delineating zones of bare rock, which are represented by brown color shades, and have NDVI values as low as -0.139784.
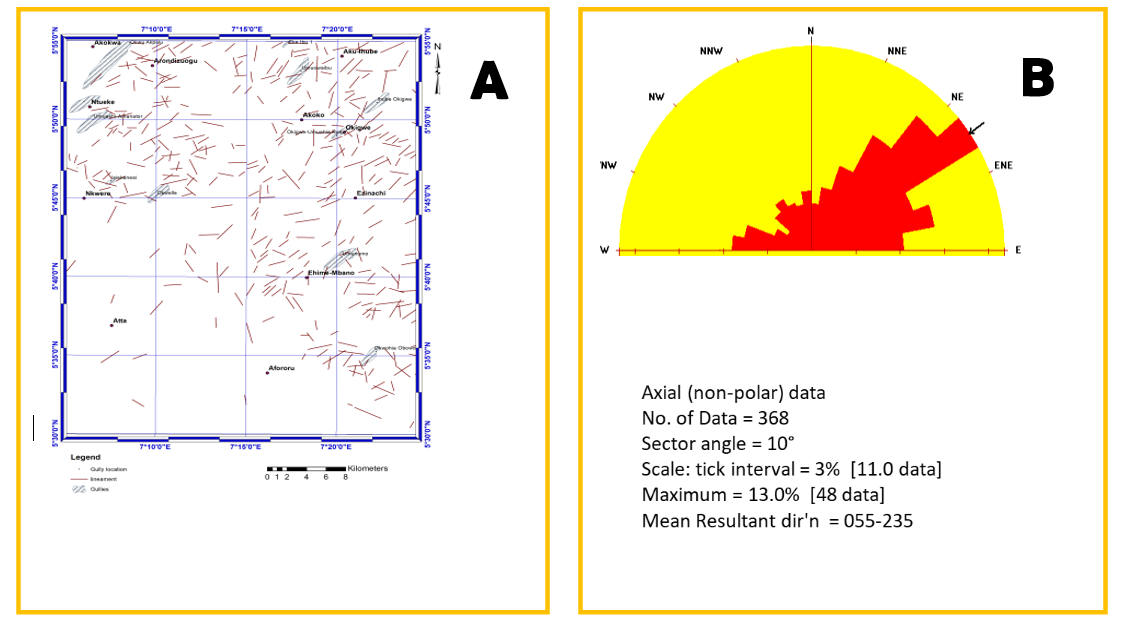
Fig 12: (A) Lineament Map of the Study Area (B) Rose plot showing the dominant trend for lineaments in the study area.
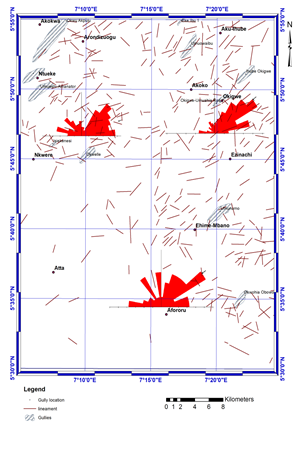
Fig 13: Rose Diagram superimposed on the lineament map of the study area.
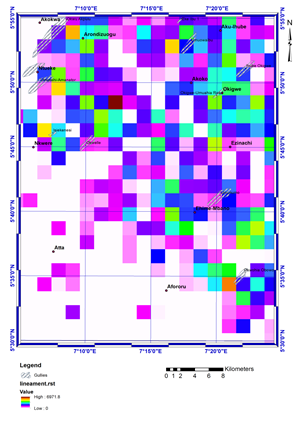
Fig 14: Lineament Density map of the area.
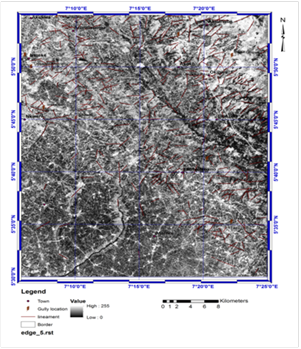
Fig 15: Lineament draped on filtered band 5 Map of the Study Area.
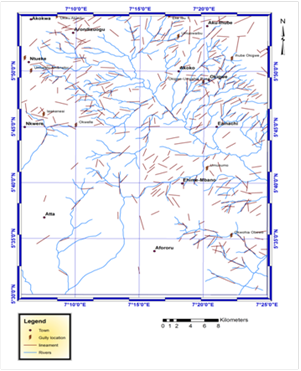
Fig 16: Lineament draped on Drainage Map of the Study Area.
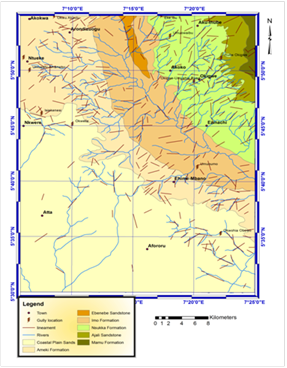
Fig 17: Lineament draped on Geologic and Drainage Maps of the Study Area.
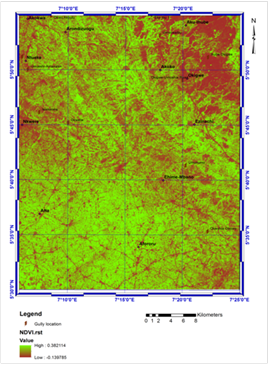
Fig 18: Normalized Difference Vegetation Index (NDVI) image of the study area.
Most of the study area is represented by yellow – light green color shades indicative of sparse to moderate vegetation with NDVI values ranging from -0.139784 to 0.382114 (fig 18). Areas characterized by thick vegetation are represented by dark green shades and have NDVI values above 0.382114. Most of the areas traversed by the main rivers and their tributaries show relatively high NDVI values indicating high vegetative cover around these areas as it ought to be due to the fact that presence of water supports luxuriant vegetation. Areas where there is well developed gullies like Okigwe in the northeast, Urualla and Isiekenesi in the northwest and parts of Nkwerre and Amucha in the south show low NDVI values indicating intense washing away of top soils whose nutrients rich nature would have supported luxuriant vegetative growth. The NDVI image aids in interpretation of other transformed and enhanced images.
The composite image revealed a dendritic drainage pattern which trends in the NE-SW, NW-SW and N-S directions (fig 19). The dendritic pattern reveals a lithological, structural and topographical inhomogeneity of the study area.
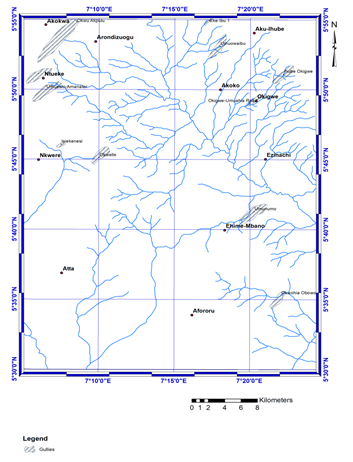
Fig 19: Drainage Map of the study area generated from Landsat ETM+ Data.
Color composites were generated for the purpose of enhancing spectral signatures of the image for the study area thus enhancing the observation of the different patterns which can be attributed to the different stratigraphic units existing in the study area. Generated composites include one natural color composite (RGB 321) and three false color composites 432, 532, 753. Figs 20 to 23 show typical composite maps generated in the study area. The NDVI map (fig 18) was used to establish a relationship between structure, drainage and vegetation within the study area. This study revealed a direct relationship between structures /lineaments and NDVI composite maps especially in erosion prone areas. Areas of intense structural deformation with high lineament density were observed to be associated with lower NDVI values indicating high potentials for surface washout. Unsupervised classification was carried out using the cluster module in ILWIS 3.0 academic. The Unsupervised Classification map of the study area is shown on figure 24 and all the erosion prone regions were adequately classed, and color coded in Magenta.
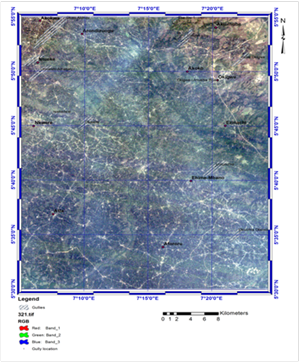
Fig 20: Natural Colour Composite (RGB 321) of the study area.
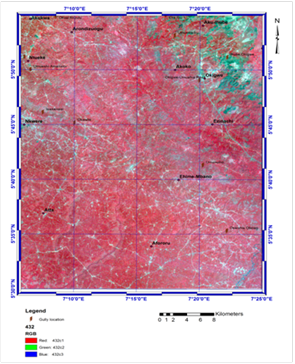
Fig 21: False Coloured Composite (432) of the study area.
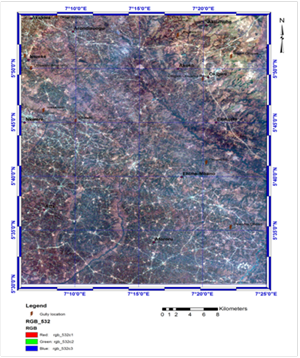
Fig 22: False Coloured Composite (532) of the study area.
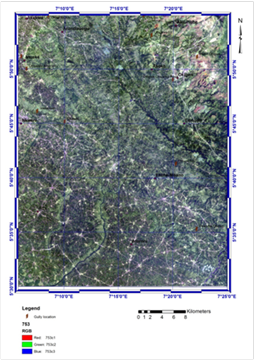
Fig 23: False Coloured Composite (753) of the study area.
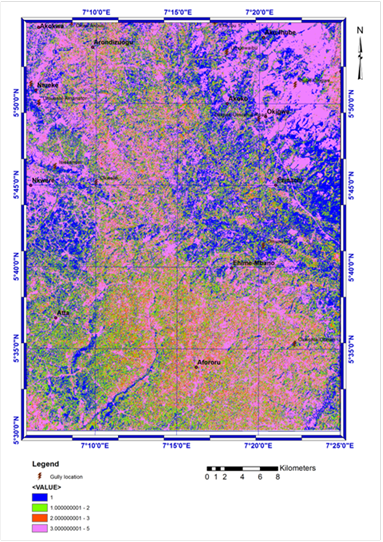
Fig 24: Unsupervised Classification map of the study area.
The average length, width and depth of the studied gullies range from 138.4 to 1997m, 9.7 to 42m and 12.4 to 62m respectively. Their approximate cross sectional area ranges from 63.05 to 1197m2 with the average soil volume loss ranging from 0.13 x10⁵ to 8.47x10⁵m3 (Table 2). The gully erosion at Ezumezu Urualla in Ideato North Local Government Area was observed to have the highest volume of soil loss (8.47x10⁵ m3) and highest Drainage Slope (DS) of 0.03. This could be as a result of the intense scouring effect of surface run off occasioned by the enhanced topography of the gully axis. The end of the Ezumezu Urualla gully site terminated at a straight course path of the flowing Orashi River which is at its youthful stage with pronounced vibrancy thereby acting as a quick sediment receptacle. This condition permits quick transportation of washed out/detached soils to the river which moves same downstream instantly. The major rivers flow in the NW-SE direction (with their tributaries flowing majorly in the NE/SW direction) which are perpendicular to the trend of the gullies showing that the direction of flow of major rivers in the area follows axis of recent structural failures whereas the gullies trend along the axis of ancient structural failures.
Soils in the area are predominantly sand with no observable adhesive material which increases their rate of dispersion. This is dependent on the type of the geologic formations underlying the area. This research has found out that there is a direct relationship between the trend of the observed major lineaments and the trend of the gullies in the area. It equally reveals that all gullies end at a flowing river and the rate of a gully’s development and advancement through scouring depends on the stage of the river course where sediments from the gully are emptied into. Thus the likely cause of the gullies in the study area is not only just the well known surface phenomenon of washing away of loose top soils by moving water but also due to both near surface and deep seated structural weaknesses along the axis of these gullies. The occurrence and rapid growth of these gullies have caused a great deal of discomfort to the entire ecosystem of plants and organisms as well as the inhabitants of the area. The present situation calls for emergency response by several authorities especially the key players in environmental monitoring to save a large segment of the community residential area from being completely engulfed by the advancing gullies within a couple of years.
Akpokodje , E.G., T S C, A C. and Ekeocha, N. 2010. Gully erosion geoharzards in southeastern Nigeria and management implications. Scientia Africana, Vol. 9 (1), 20 -36.
Durugbo E. U. 2013. Palynostratigraphy, Age Determination and Depositional Environments of the Imo Shale Exposures at the Okigwe/Port Harcourt Express Road Junction Okigwe, Southeastern Nigeria. Greener Journal of Physical Sciences. Vol. 3 (7). pp. 255-272
Egboka , B.C and okpoko , E. 1984. Gully erosion in the Agulu- Nanka region of Anambra state , Nigeria . challenges in African hydrology and water resources (proceeding of the laree symposium ). Iaitspubl .no 144. http :// iahs .infolredbools /a144/iahs -144- 0335.
Ezemanye, M. N. and Emeribe , C. N. 2012. Rainfall erasing in southeastern Nigeria: elhiopian journal of environmental studies and management (EJESM), Vol. 5 (2), 112-122.
View ArticleEzezika, O.C. and Adetoria , O. 2011. Resolving the gully erosion problem in southeastern Nigeria : innovation through public awareness and community based approaches Journal of soil science and environmental management, 2(10), 286 - 291.
Herngreen G. F. W. and Chlonova A. F. 1981. Cretaceous Microfloral Provinces. Pollen Et Spores. Vol. 23. Pp. 441-555.
Herngreen G. F. W., Kedves M., Rovinina L. V. and Smirnova, S.B. 1996. Cretaceous Palynofloral Provinces: a Review. In: Jansonius, J. and Mcgregor. D. C. (Eds.), Palynology: Principles and Applications. Dallas: American Association of Stratigraphic Palynologists Foundation. pp 1157 -1188.
Kogbe C. A. (Ed.) 1975. Geology of Nigeria. University of Ile-Ife; Elizabethan Publishing Co. Lagos
Onu, N.N. 2011. Training in Geophysics: The Challenges of oil exploration, Gully Erosion and Water resources Development. 18th Inaugural Lecture of the Federal University of Technology, FUTO, Owerri.
Reyment, R. A. 1965. Aspects of the Geology of Nigeria. Ibadan University Press. p. 133
Uzoegbu U. M., Uchebo U. A. and Okafor I. 2013. Lithostratigraphy of the Maastrichtian Nsukka Formation in the Anambra Basin, S.E Nigeria. IOSR Journal of Environmental Science, Toxicology and Food Technology. Vol. 5. Pp. 2319-2402
View ArticleWilson, R. C. 1925. The Geology of the Eastern Railways. Bull. Geology. Survey Nigeria. 19: 95-102.