Amit Basu
Email: ab59@drexel.edu
© 2019 Sift Desk Journals. All Rights Reserved
VOLUME: 4 ISSUE: 1
Page No: 516-533
Amit Basu
Email: ab59@drexel.edu
Amit Basu,†‡* Louise Showe,§ Harold W. Avery, † Kimberly D. Magrini, † Barbara A. Bell,† Shankar Addya, || Richard B. Huneke, # and James R. Spotila¶
†Department of Biology, Drexel University, 3245 Chestnut St., Philadelphia, PA 19104, USA
‡High School of Engineering & Science, School District of Philadelphia, 1600 W. Norris St, Philadelphia, PA 19121, USA,
§The Wistar Intitute, 3601 Spruce St., Philadelphia, PA 19104,USA
||Kimmel Cancer Center., Cancer Genomic Lab., Thomas Jefferson University, 233 South 10th St., Philadelphia, PA 19107, USA
#Department of Microbiology & Immunology, Drexel University College of Medicine, 245N 15th St., Philadelphia, PA 19102, USA.
¶Department of Biodiversity, Earth and Environmental Science, Drexel University, 3245 Chestnut St., Philadelphia, PA 19104, USA
Amit Basu, Identification of ‘stress and Ca++ metabolism related gene expression’ in wild Peromyscus exposed to environmental lead using combinatorial data from Mus cDNA microarrays and blood metabolites(2018)SDRP Journal of Earth Sciences & Environmental Studies 4(1)
We studied feasibility of using cDNA microarray to identify the biomarkers for toxicity of environmental lead (Pb) mixed with multiple effectors (mixed toxicants) in Peromyscus maniculatus, a rodent common in the North American continent. We used Mus muculus cDNA microarrays to identify a gene expression profile indicating toxicology of environmental lead, since the Peromyscus cDNA were not widely sequenced. We measured the effect of lead on differential gene expression in a laboratory strain of deer mice, Peromyscus maniculatus, and compared it to gene expression in wild deer mice (P. maniculatus) collected from a field site contaminated with lead, and an uncontaminated control field site. As expected, total blood hemoglobin (Hb) dropped with an increase in blood lead concentrations. The cDNA microarrays demonstrated similar differential expression of genes in livers of lead contaminated mice in the laboratory and mice in the field. Genes affected included nuclear subunits of mitochondrial cytochrome oxidases and NADH dehydrogenases, transcripts of Hsp 90aa1, protein phosphatase 2, calmodulin 1, Annexin A7 and Sparc. Identification of ‘putative stress related biomarker genes’ of liver proteins/enzymes and pathways that are known to be affected by lead intoxication confirms robustness of this method to detect biological effects of environmental lead on P. maniculatus. The gene expression profile suggested that the expression of multiple Ca++ binding and mitochondrial electron transport proteins underlie biological effects of chronic low-level lead toxicity in wild Peromyscus.
Key words: Lead toxicity, metabolic profiling, gene expression, liver, field study.
Successful remediation of contaminated environments begins and ends with effective assessment of potential human and ecological health risk associated with exposure to contaminants in a specific area or ecosystem. The promise of environmental decontamination to improve human and ecological health would be facilitated by identification of biomarkers for specific environmental toxicants. In recent years, molecular-based approaches, such as molecular pharmacokinetics (time dependent uptake, metabolism and degradation) of contaminating chemicals and the resultant transcriptomics (differential gene expression) and metabolomics (molecular pharmacodynamics), have been used to study toxicant specific molecular changes in human and wildlife populations (Sansone, et al. 2004; Cristiani, 2007) . These molecular data based or toxicogenomic approaches theoretically can be used to develop a signature of exposure to environmental chemicals in different life-forms (Christiani, 2007) . In this research, we successfully applied toxicogenomic techniques to develop a ‘putative gene expression profile’ resulting from environmental lead exposure in wild deer mice, Peromyscus maniculatus.
Health Related Effects of Environment Lead Exposure
Lead (Pb) and other heavy metals are known to cause a variety of health effects in humans and other animals residing in a contaminated environment. It is relatively simple to follow the toxicity of Pb and identify its biomarkers (Sakai, 2000), since a living body absorbs only biologically available Pb from a contaminated environment and upon absorption the Pb either causes toxic reactions or is rendered nontoxic through excretion or sequestration. Therefore, we selected Pb as a representative toxic metal to determine if cDNA microarrays could reveal a gene expression signature that would predict its toxicological effects in the environment.
Lead disrupts multiple essential physiological pathways in tissues, such as blood, liver, spleen, kidney, muscle and brain (Sipos, et al. 2003; Teijo’n, et al. 2003; Corpas, et al., 2002; Hacker, et al. 1990). Chronic exposure to Pb causes primary anemia in mice, rats and humans (Mudipalli, 2007). Lead is stored in liver and bones following chronic exposure, interferes with gastrointestinal absorption of calcium (Ca), iron (Fe) and zinc (Zn) and thereby reduces availability of these three essential minerals in cellular processes (Corpas, et al. 2002). Lead interferes with many biochemical and gene expression processes in mammalian systems, usually without any minimum threshold concentration.
Lead affects carbohydrate metabolism, inhibits heme biosynthesis and superoxide dismutase activity and reduces glutathione level in the liver (Corpas, et al. 2002; Verma, et al. 2005). Inhibition of the heme synthesis enzyme δ-aminolevulinic acid (ALA) dehydrase, with concurrent stimulation of δ-aminolevulinic acid synthetase activity, occurs in erythrocytes containing Pb (Trevisan, et al. 1983; Campagna, et al. 1999). Thus, blood Pb and blood hemoglobin (heme) concentrations are common measures of Pb uptake and Pb induced anemia. Lead exposure to rat liver mitochondria, both in vitro and in vivo, causes ultra-structural damage, reduced protein content, inhibited ATPase activity and increased oxygen consumption (Wielgus-Serafinska, et al. 1980).
Peromyscus maniculatus liver genes as indicators for environmental lead contamination
Many gene expression studies use livers of laboratory mice (Mus musculus) (Jochheim, et al. 2003). In order to develop genetic markers of environmental lead contamination, we studied effects of Pb in the deer mouse (Peromyscus maniculatus), a wild mouse common in contaminated natural sites. Deer mice are some of the most abundant native North American mammals, occur in many natural habitats, and range from Alaska to Central America (Butt and Grossenheider, 1964). Peromyscus belongs to the Order Rodentia. Despite Peromyscus being distantly related to the laboratory mouse, we were able to use mouse (M. musculus) genetic tools to study gene expression in P. maniculatus (Glenn, et al. 2008).
We first measured gene expression of P. maniculatus exposed to Pb in their food in the laboratory. Then we collected wild P. maniculatus from an area contaminated with Pb on the Radford Army Ammunition Plant, Radford, VA. This plant produced ammunition for the U. S. Army, Navy and Air Force since World War II and several sites were contaminated with Pb. We measured gene expression in these wild deer mice and compared it to that of Peromyscus exposed to Pb in the laboratory. By combining differential gene expression (transcriptomics) data from laboratory and field mice to metabolic (metabolomics) data from well-known patho-physiological and biochemical processes affected by Pb toxicity, we identified a ‘putative gene expression profile’ associated with exposure to Pb in the wild mice.
Experimental design
We compared the gene expression of a laboratory strain of P. maniculatus exposed to lead in their diet to the gene expression of P. maniculatus collected from a contaminated site and a control site in the field. The contaminated site was on the Radford Army Ammunition Plant in Southwestern Virginia. The control site was on Kentland Farm (KF), an agricultural station of the Virginia Technical Institute and State University across the New River from the Radford Ammunition Plant.
Collection of samples and animals from contaminated and uncontaminated sites
The humane capture and use of animals was approved by the Institutional Animal Care and Use Committee (IACUC) of the Drexel University and the Institutional Review Board approved the animal handling and research protocols. An analysis of data from soil samples from a Bag Loading Area (BLA) of the Radford Ammunition Plant indicated that the site was contaminated with heavy metals and other contaminants (Table I). The Bag Loading Area (BLA) consisted of concrete buildings with walls and floors lined with conductive Pb -Cu that prevented static induced explosion of the black powder bags packed there. The buildings were used to load propellant charges into bags for use in naval guns during and after World War II. Due to a lack of maintenance the buildings lost their roofs and the Pb -Cu wall and floor covers, weathered, leaching materials into the ground around the buildings and contaminating the soil. The EPA estimates that major risk drivers in the soil around the BLA are Cu, Pb , and Mn from the decaying flooring materials and Aroclor-1254 and PCBs (LOEL/USEPA) from building materials. In general, concentrations of metals decreased rapidly within 2 meters of the building perimeter, although a detailed survey detected wide variations of metal concentrations due to micro-channeling (EPA report, personal communication).
We collected contaminated soil and P. maniculatus from around BLA 2 on the Radford Ammunition Plant and P. maniculatus and soil from a control site on KF. Separation of these two locations by New River reduced cross contamination of samples from contaminated versus control sites located in a similar environment (37oN 80oW elevation 520m). We collected three soil samples from BLA2 area and three samples from an agricultural field on KF. Each sample consisted of approximately 10 kg of soil collected from the surface down to a depth of approximately 0.5 m. We collected 6 female P. maniculatus from BLA2 and 13 female P. maniculatus from the KF. Ten of the KF deer mice were from an apple orchard, 2 from the area of an agricultural barn and 1 from the area next to an historic barn. We collected mice with Sherman small mammal traps baited with peanut butter-rolled oat balls and cotton balls for warmth.
One of major concerns of developing lead induced gene expression profile in wild P. maniculatus was the dynamic nature of gene expression based on age, sex, genetics, lead concentration and length of exposure (Peterson, et al. 2011). It was not possible to determine the genetic makeup of the wild mice or their length of exposure to contaminants. Therefore, we collected adult female P. maniculatus, since they have smaller home ranges and wander less than males, and were similar in size (length and mass) to our female laboratory P. maniculatus.
In the laboratory, we housed adult female P. maniculatus (University of South Carolina Peromyscus Genetic Stock Center) individually in the Drexel University animal facility with a 12 h light/dark cycle and fed them a custom made rodent diet (ad libitum) laced with 0, 0.5% and 1% lead-acetate (®Bioserve, NJ) for an indicated period of time (Lamb, et al. 1985). We euthanized animals, cut soft liver tissues into small pieces (4-6mm2), washed them thoroughly in ice cold saline and then preserved them in RNALater (®Ambion) at -20oC for RNA isolation, and froze blood samples with EDTA as anticoagulant in LN2 for biochemical analyses.
Microarray analyses
We prepared total RNA from 30 mg liver tissue following the manufacturer’s directions (Sigma-Aldrich), and assessed RNA quality by 1% agarose gel electrophoresis using SYBR Green II post staining (Cambrex). We amplified RNA (aRNA) samples with a modified T7 Eberwine procedure (Van Gelder, et al. 1990), and labeled 2 microgram of the aRNA with 60 microCi of [33P]dCTP as previously described (Kari, et al. 2003). We hybridized labeled aRNA with a pair of nylon microarrays (MA07 and MA10) printed with PCR-amplified mouse (M. musculus) cDNAs obtained from the Wistar Genomics Facility (http://www.wistar.upenn.edu/ genomics/) containing a total of ~19,200 clones (9,600 on each array). The gene sources, lists, including GenBank accession numbers and Unigene build 134 cluster assignments, are available at http://showelab.wistar.upenn.edu/Wistar_Showe_Lab_Gene_Lists.htm. Phylogenetically, Peromyscus shared a common ancestor with Mus about 25 million years ago so they are somewhat distantly related (http://www.hgsc.bcm.tmc.edu/sites/default/files/images/PeromyscusWhitePaper.pdf). However, we were able to successfully use Mus cDNA microarrays in absence of suitable Peromyscus genetic tools. Previously, these microarrays were successfully used in gene expression studies in an even more remotely related rodent, the arctic ground squirrel (Yan, et al. 2006). Following hybridization (16 h at 42°C in 5 ml of MicroHyb buffer from ®Research Genetics), filters were batch washed in a large container for consistency. We rinsed filters at room temperature with 2X SSC-1% SDS to remove residual probe and MicroHyb solution and then transferred them to preheated wash solutions in a temperature controlled shaking water bath. We washed the filters twice for 30 min in 2XSSC-1% SDS at 50°C, followed by a 30 min in 0.5X SSC-1% SDS at 55°C wash and for a 30 min in 0.1X SSC-1% SDS at 55°C wash. Finally, the filters were washed with 0.1X SSC at room temperature to remove SDS before exposing them to Storm Phosphorimager (®GE-Amersham) screens for 10 days. We adopted this stringent washing protocol to reduce spurious hybridization between nucleic acids from heterologous species. We scanned images of washed filters at 50-mm resolution in a Storm Phosphorimager and converted the scanned images into raw data (Imagene software ®Biodiscovery).
Microarray data analysis
Of the data obtained from Imagene software, we only used those spots with signal median higher than background median. We normalized and analyzed raw signal and background data with GeneSpring software (®Agilent Tech). The p-value (<0.05) of the two tailed student t-test versus log2 fold difference (>2 at least in one instance) between control and each Pb exposed group identified differentially expressed genes in a Volcano plot. We reanalyzed these genes using one way ANOVA while assuming variances equal (>50 background subtracted raw value cut-off) to identify potential differentially expressed genes from lead exposure. We did not apply false discovery rate (FDR) post-hoc analyses to the ANOVA data, which might have invalidated significant gene expression data from a species whose detailed genetics was unknown. We used Gene Ontogeny (GO) classification and clustering analysis of the ANOVA data from the GeneSpring© only as reference for further analyses of the data in DAVID and IPA. We annotated and clustered the ANOVA derived gene sets in relational maps (Pearson correlation) to detect potential biomarker genes in DAVID (NIH) (Dennis, et al. 2003) with high stringency Bejamini option to reduce probability of false discovery (FDR) and ranked gene expression by significance of association (p <0.05) with specific and relevant biological pathways.
Lastly, we used Ingenuity Pathway Analyses (IPA), Ingenuity® Systems (www.ingenuity.com) to reconfirm and identify new biochemical or toxicological pathways and networks of ANOVA selected genes with +1.5 fold or more of normalized expression values compared to no Pb control that were annotated and ranked by DAVID. We presented the 21Pb-induced genes expression data validated by both DAVID and IPA analyses.
Measurement of total blood lead concentration
We analyzed whole blood Pb concentrations in a ®Varion Atomic Absorption Spectrophotometer attached with a graphite furnace (GFAAS) using a method slightly modified from Buck Scientific Application note #AA3004 and ®Varion AA technical manual. In short, we collected the blood samples with K-EDTA as anticoagulant and homogenized 50microl of it with 200microl. matrix modifier (3.5g NH4NO3, 2g NH4H2PO4 and 2.5ml Triton X-100 in 50ml water). We analyzed 20microl of homogenized blood at 283.3nm in a Varion GFAAS using a modified GTA95 command structure and argon as carrier gas.
Measurement of Blood-Heme concentrations
We determined hemoglobin (Hb) concentration by the cyanmethemoglobin method, which produced a stable color pigment with a peak absorbance at 540 nm (HG BPROC Doc, 2007, methods note from hemoglobin standard maker). We incubated 0.02ml of EDTA-blood with 5ml of Drabkin’s reagent for 5 minutes at room temperature and measured its heme concentration against a pre-generated cyanmethemoglobin standard curve.
Soil Analysis
We analyzed lead content of soil samples from BLA 2 and KF using the Flame Spectrometry (FLAA) protocol 7.5-7.6.1 in a ®Varian Atomic Absorption Spectrophotometer following EPA Acid Digestion Protocol Method #3050B (http://www.epa.gov/sw-846/pdfs/3050b.pdf).
Deer mice fed Pb in the laboratory had an increase in Pb concentration in the blood with exposure time and concentration of Pb in their food (Fig 1). There was a strong negative correlation (r = -0.98) between blood lead concentration and heme concentration (Fig 2). Deer mice from the BLA2 site had 0.22 (+/- 0.069) ug/ml of Pb in their blood, but deer mice from the agricultural field at KF had no Pb in their blood (below detection limit). Deer mice caught near the active barn had detectable Pb in their blood (0.08 and 0.11 ug/ml) and the deer mouse caught next to the historic barn had a similar amount of Pb in its blood (0.24) as the mice from BLA2 (Table I).
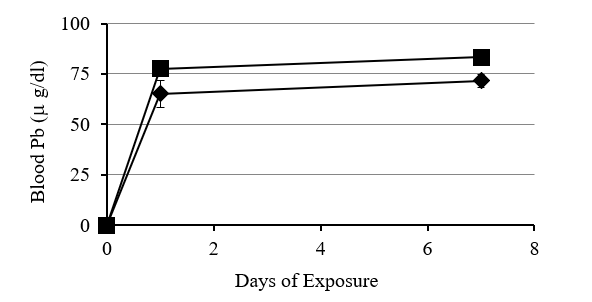
Figure 1: Relationship between increase in blood Pb, length of exposure and concentration of Pb in food of the laboratory deer mice. Blood Pb concentration increased faster following 24 hr exposure to food containing either 0.5% or 1% Pb-acetate and then leveled off in 7days. Blood Pb levels were higher in mice exposed to food with 1% Pb compared to 0.5%Pb.
Table I: Comparison between soil lead (source) and blood lead (sink) concentrations from the field and in the laboratory. Field data set is composed of the lead levels in the soil samples collected from indicated area and blood lead from the Peromyscus collected from the same places. Lead concentrations in BLA soil samples were higher than that of the low intensity sustainable agriculture (LISA) of the Kentland Farms (control areas), and similarly, Peromyscus collected from Kentland Farms grounds (KFG) and laboratory control exhibited similar blood lead concentrations. Laboratory Peromyscus fed with 0.5-1% lead in the food exhibited highest blood lead concentrations. (Abbreviations: SD = Standard deviation, Flame AAS = Flame atomic absorption spectrometer, GFAAS = Atomic Absorption Spectrophotometer attached with a graphite furnace)
|
Field Data: |
Soil lead (mg/g) (SD) (Flame AAS) |
Blood lead (mg/dl) (SD) from Wild Peromyscus (GFAAS) |
|
BLA 2, Radford Army Ammunition Plant (contaminated Field) |
0.425 (+ 0.0005) (n =3) [425mg/kg (dw)] |
Average 21.9 (+6.9) (n =4) |
|
Kentland Farms, VA Tech. (KF, Control Field)
|
< 0 detection limit (n =3) |
< 0 detection limit (n = 10) |
|
Agricultural Bldg. (KF) |
Unknown |
7.8–11.3 (n = 2) |
|
Historic Farm Bldg. (KF) |
Unknown |
23.6 (n = 1) |
|
Laboratory Data: |
Food lead (mg/g) conc. (Vendor supplied data) |
Blood lead (mg/ml) from lab. Peromyscus following |
|
|
|
7 days of exposure |
|
Rodent Feed with 1% Pb-acetate |
10 |
83.4 (+ 3.7) (n = 5) |
|
Rodent Feed with 0.5% Pb-acetate |
5 |
71.7 (+ 3.2) (n = 6) |
|
Control Feed |
<0.01 |
< 0 detection limit (n = 6) |
(dw: dry weight)
A scatter plot of blood samples from the field specimens showed a significant difference of heme concentrations (p = 0.02) between blood samples containing lower (0mg/ml) and higher (~0.22mg/ml) blood lead (p = 4.3x10⁻⁶ for blood Pb values) (Fig 2). The difference of heme concentrations between lead exposed and unexposed specimens were significant (p = 0.02), with no significant difference in the body mass.
There was a moderately high level of lead in the soil near BLA2 0.425 +/- 0.0005 mg/g (425mg/kg) dry mass but no detectable Pb in the soil in the agricultural field at KF (Table I). We did not obtain soil samples near the agricultural buildings at KF. EPA analysis of the soil from the BLA site detected >4 fold Pb contamination in addition to other metals, such as Ba, Cu and Fe, 6 different PAHs and 2 of the PCBs (Table II).
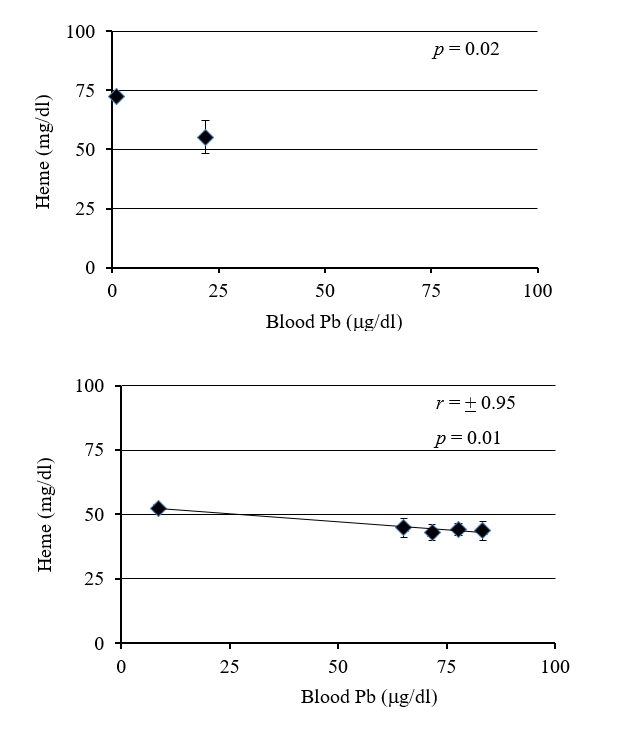
Figure 2: Relationship between increase in blood Pb and decrease in hemoglobin (Hb) concentrations. Decrease in Hb concentration with increase in blood Pb was evident in both wild (A) and laboratory (B) Peromyscus.
Table II: A list of 17 different heavy metals and soil contaminants, such as polyaromatic hydrocarbons (PAHs), found in the Bag Loading Areas (BLAs) of the Radford Ammunition Plant (Courtesy of Biology division of RAP, VA). Lead was the fourth highest concentration of all of the 9 metals detected in the BLA soil samples (n = 23). In order to keep parity with previous table the data were presented in mg/g (instead of mg/kg) dry mass of soil
|
Contaminants in Bag Loading Areas (BLAs) |
concentration/g dry weight of soil
|
|
Metals |
|
|
Barium (Ba) |
10.2 mg |
|
Copper (Cu) |
13.6 mg |
|
Iron (Fe) |
51.5 mg |
|
Lead (Pb) |
1.7-8.79 mg |
|
Manganese (Mn) |
3.08 mg |
|
Chromium (Cr) |
0.074 mg |
|
Cadmium (Cd) |
0.012 mg |
|
Mercury (Hg) |
0.005 mg |
|
Zinc (Zn) |
0.25-0.59 mg |
|
|
|
|
Polyaromatic Hydrocarbons (PAHs) |
|
|
Benzo(a)anthracene |
39mg |
|
Benzo(a)pyrene |
0.17-36mg |
|
Benzo(b)fluoranthene |
6.8-68mg |
|
Benzo(k)fluoranthene |
14mg |
|
Dibenz(a,h)anthracene |
0.53-5.9mg |
|
Indeno(1,2,3-cd)pyrene |
23mg |
|
|
|
|
PCB and Others |
|
|
Aroclor-1254 |
3.23-5.69mg |
|
2-4 DNT |
120mg |
Gene expression in liver of deer mice:
Our microarray data analysis for laboratory deer mice identified differentially expressed liver genes belonging to metabolic categories recognized for lead toxicity in mammals. In laboratory deer mice, of all the genes identified in the t-test derived volcano plot, 742 genes exhibited significant differential expression in one way ANOVA. All 742 expressed genes were annotated and identified with 297 overlapping relevant cellular and/or metabolic processes (DAVID). Of these genes, 58 genes (from one way ANOVA) could not be associated with known cellular processes and were not included in the DAVID classification. We identified 160 genes associated with mitochondrial metabolism, calcium and other metal ion binding, cellular transport, and heat shock (stress) related processes. Some of these genes were common in both laboratory and field mice liver specimens (Table III) while others were different. A complete table containing all identified genes and pathways is found in electronic supplement I.
Table III: A list of selected genes differentially expressed (ANOVA) in the liver samples collected from laboratory and wild P. maniculatus. The Pb exposed mice up- or down regulated these genes compared to control mice.
|
Gene Symbol |
Gene Bank Accession No |
Gene Function |
|
Common genes from field and laboratory mice: |
||
|
Sparc |
AA517111 |
Secreted acidic cysteine rich glycoprotein: a major Ca++ binding glycoprotein in Extra-Cellular Matrix (ECM) |
|
Ndufa13 |
AI839986 |
NADH Dehydrogenase (ubiquinone)1 alpha subcomplex, 13
|
|
Psph |
AI841354 |
Phosphoserine phosphatase |
|
Dst |
AI843343 |
Dystonin: loss of function results in hereditary sensory neuropathy |
|
Slc39a9 |
AU015666 |
Solute carrier family 39 (zinc transporter), member 9 |
|
Aldh6a1 |
AW537342 |
Aldehyde Dehydrogenase Family 6, subfamily A1 |
|
Cyb5 |
BG065259 |
Cytochrome b-5: electron transport hemeprotein |
|
Acadm |
BG065314 |
Acetyl-coenzyme A Dehydrogenase, medium chain |
|
Cox7a2l |
BG065832 |
Cytochrome C-oxidase subunit VIIA polypeptide 2-like |
|
Slc7a8 |
BG067524 |
Solute carrier family 7 (cationic acid transporter Y+ system), member 8 |
|
Adam8 |
BG069799 |
A Disintegrin and Metallopeptidase domain 8 |
|
Asph |
BG070767 |
Aspartate-Beta-Hydrolase: important for Ca++-homeostasis |
|
Tcea3 |
BG071507 |
Transcription elongation factor A (SII), 3 |
|
Cdh22 |
BG071796 |
Cadherin 22: a putative Ca++ dependent cell adhesion protein expressed predominantly in brain |
|
Calm1 |
BG072244 |
Calmodulin 1: Ca++ binding multifunctional intermediate messenger and transcription factor |
|
Atp5c1 |
BG072870 |
ATP synthase, H+ transporting, mitochondrial F1 complex, gamma polypeptide1 |
|
Atp5c1 |
BG072870 |
ATP synthase, H+ transporting, mitochondrial F1 complex, gamma polypeptide1 |
|
Tkt |
BG075311 |
Transketolase: enzyme connects pentose phosphate pathway to glycolysis |
|
Ppp1cc |
BG075782 |
Protein Phosphatase 1, catalytic subunit , gamma isoform |
|
Ppp1cc |
BG075782 |
Protein Phosphatase 1, catalytic subunit , gamma isoform |
|
Calm2 |
BG076848 |
Calmodulin 1: Ca++ binding multifunctional intermediate messenger and transcription factor |
|
Ppp2ca |
BG076862 |
Protein phosphatase 2 (formerly 2A), catalytic subunit, alpha isoform |
|
Ndufc2 |
BG078565 |
NADH Dehydrogenase (ubiquinone) 1, subcomplex unknown, 2 |
|
Anxa7 |
BG079480 |
Annexin A7: Ca++ dependent phospholipid binding protein |
|
Ppp2ca |
BG082298 |
Protein phosphatase 2 (formerly 2A), catalytic subunit, alpha isoform |
|
Acadl |
C79809 |
Acetyl-coenzyme A Dehydrogenase long-chain |
|
Genes from field mice: |
||
|
Foxn2 |
BG063321 |
Forkhead box N2: transcription factor binds to T-cell leukemia virus LTR |
|
Anxa11 |
BG066718 |
Annexin A11: Ca++ dependent phospholipid binding protein |
|
B4galt1 |
BG072304 |
UDP-Gal:betaGlcNAc beta 1,4- galactosyltransferase, polypeptide 1: enzyme participates both in glycoconjugate and lactose biosynthesis |
|
Hbb-b1 |
BG073043 |
Hemoglobin, beta adult major chain |
|
Hbb-b1 |
BG073044 |
Hemoglobin, beta adult major chain |
|
Atp2a2 |
BG085195 |
ATPase, Ca++ transporting, cardiac muscle, slow twitch 2: controls Ca++ concentrations inside cells |
|
Fn1 |
BG085662 |
Fibronectin 1: necessary cell adhesion and migration |
|
Foxm1 |
BG087468 |
Forkhead box M1: transcriptional activator of cyclin B1 and D1
|
|
Alas2 |
BG088378 |
Aminolevulinic acid synthase 2, erythroid: synthesizes delta- aminolevulenic acid, a heme precursor |
|
Cox6a1 |
NM_007748 |
Cytochrome c oxidase, subunit VI a, polypeptide 1: mitochondrial electron transport |
|
Genes from laboratory mice: |
||
|
Cyp11b1 |
AI414740 |
Cytochrome P450, family 11, subfamily b, polypeptide 1: a 11beta-hydroxylase that converts 11-deoxycortisol to cortisol in adrenal cortex |
|
Hsp90aa1 |
AI841344 |
Heat shock protein 90kDa alpha (cytosolic), class A member 1 |
|
Gstm4 |
AW555156 |
Glutathione S-transferase, mu 4 detoxifies environmental toxins |
|
Fth1 |
BG063515 |
Ferritin heavy chain 1; part of major intracellular iron storage protein |
|
Hsp110 |
BG066973 |
Heat shock protein 110: molecular chaperone |
|
Atp2a2 |
BG074044 |
ATPase, Ca++ transporting, cardiac muscle, slow twitch 2: controls Ca++ concentrations inside cells |
|
Sod1 |
BG074045 |
Superoxide dismutase 1, soluble: breaks down oxygen free radicals |
|
B4galt3 |
BG075137 |
UDP-Gal:betaGlcNAc beta 1,4-galactosyltransferase, polypeptide 3: beta-galactose transporter |
|
Foxp1 |
BG076288 |
Forkhead box P1: tumor suppressor transcription factor |
|
Cox7c |
BG080036 |
Cytochrome c oxidase, subunit VIIc: mitochondrial electron transport |
|
Gata4 |
BG088871 |
GATA binding protein 4: transcription factor with GATA motif |
We identified 29 enriched genes (GO) in laboratory Peromyscus belonging to the mitochondrial cluster (median p = 0.033 and enrichment score = 1.47), of which we found eight transcripts of Acyl-CoA and NADH dehydrogenases, F1-ATP synthase g peptide, Cytochrome c oxidase (Cox VII c and VIIa-2 like), among others. There were 95 enriched metal ion binding genes (GO)(median p = 0.0011 and enrichment score = 2.35). The cluster contained genes of Ca binding proteins like 3 Calmodulin 1s (CAM1) and Fe binding protein like Ferritin heavy chain, 5 protein phosphatases, 2 cytochrome p450s, GATA binding protein and Hephaestin. There was downregulation of all three calmodulin (CAM1) transcripts and reduction in ferritin heavy chain 1(Fth1) expression over seven days (Table IV). Two heat shock protein transcripts, 90 KDa heat shock protein alpha A1 and heat shock protein 110, and one DnaJ (hsp40) homolog B11 exhibited significant modulation of expression. (Table IV).
Table IV: A comparative summary of analyses of the differentially expressed Pb induced genes (ANOVA) in the liver of wild P. maniculatus and laboratory raised P. maniculatus. The following list consists of mitochondrial, metal and ion binding and transportation, and stress-related genes (classified in DAVID), showing fold changes in expression with respect to control (ANOVA).
|
|
Organism |
Wild P. maniculatus |
P. maniculatus |
||
|
Process- Category Accession No. |
Diet lead (%) |
Environmental |
0.5 |
0.5 |
1 |
|
Exposure time (day) |
|
1 |
7 |
7 |
|
|
Process/Pathway: Gene name |
Fold Change |
|
|
|
|
|
Subcellular organelle: Mitochondrion |
|||||
|
|
Acyl-CoA Dehydrogenase |
||||
|
C79809 |
long chain |
2.61 |
|
|
|
|
BG065314 |
medium chain |
2.43 |
|
|
|
|
AI839605 |
very long chain |
|
-1.34 |
-2.56 |
1.13 |
|
BG065033 |
short chain |
|
-1.21 |
2.28 |
-1.65 |
|
|
Cytochrome Oxidase (nuclear subunit) |
||||
|
NM_007748 |
Cox VIa1 |
-2.6 |
|
|
|
|
BG065832 |
CoxVIIa-2l |
-1.56 |
|
|
|
|
BG080036 |
CoxVIIc |
|
-2.02 |
1.18 |
-2.17 |
|
BG063843 |
CoxVIIa-2l |
|
1.21 |
-1.89 |
-1.1 |
|
|
NADH dehydrogenase 1 (Ubiquinone) |
||||
|
AI839986 |
a subcomplex, 13 |
-2.39 |
|
|
|
|
BG078565 |
subcomplex unknown, 2 |
2.23 |
|
|
|
|
AI894290 |
a-subcomplex, 9 |
|
1.38 |
1.67 |
1.05 |
|
AI840263 |
subcomplex unknown, 1 |
|
-1.3 |
-2.04 |
-1.2 |
|
BG075903 |
subcomplex unknown, 1 |
|
-1.32 |
-1.92 |
-1.13 |
|
Metal ion binding: |
|||||
|
BG063515 |
Ferritin heavy chain 1 |
|
1.55 |
-3.17 |
-1.44 |
|
BG076848 |
Calmodulin (Calm1) |
2.23 |
|
|
|
|
BG072244 |
Calmodulin (Calm1) |
1.55 |
|
|
|
|
AI836609 |
Calmodulin (Calm1) |
|
-2.54 |
-4.56 |
-3.77 |
|
BG072244 |
Calmodulin (Calm1) |
|
-2.59 |
-3.04 |
-3.31 |
|
BG076617 |
Calmodulin (Calm1) |
|
-2.06 |
-2.17 |
-1.98 |
|
BG075782 |
Protein phosphatase 1cc |
1.66 |
|
|
|
|
BG076862 |
Protein phosphatase 2ca |
1.8 |
|
|
|
|
BG082298 |
Protein phosphatase 2ca |
2.2 |
|
|
|
|
BG071790 |
Protein phosphatase 1cc |
|
1.52 |
-1.62 |
-1.18 |
|
BG087694 |
Protein phosphatase 2cb |
|
1.09 |
-2.81 |
-1.35 |
|
BG088871 |
GATA binding protein 4 |
|
|
|
-1.96 |
|
BG076749 |
Hephaestin |
|
-1.84 |
-1.9 |
-2.41 |
|
AA517111 |
Sparc |
-1.91 |
|
|
|
|
AI845741 |
Sparc |
|
1.03 |
-1.83 |
-1.49 |
|
AI840025 |
Sparc |
|
-2.69 |
-1.84 |
-1.94 |
|
Stress related genes: |
|||||
|
AI841344 |
Heat shock protein 90aa1 |
|
-2.13 |
-1.29 |
-1.31 |
|
BG066973 |
Heat shock protein 90aa1 |
|
1.33 |
-2.42 |
-1.63 |
|
|
Hsc70 co-chaperon |
||||
|
AI846572 |
DnaJ (Hsp40) homolog, B11 |
|
-1.21 |
-3.58 |
-1.13 |
The IPA of the one way ANOVA selected genes identified pathways such as hypoxia-inducible factor signaling, NRF2-mediated oxidative stress response, and mitochondrial dysfunction on canonical and toxicological lists (Table V). These pathways contained diagnostic genes such as SOD1, heat shock protein 90kda alpha (cytosolic) A1 (HSP90AA1), DnaJ (hsp40) homolog C21, cytochome oxidase VIIA (Cox7A2L) and NADH dehydrogenase Fe-S protein 2 (NDUFS2) among others.
In the field study we compared the pattern of differential expression of genes in the liver tissues of deer mice collected from BLA2 and KF based on their blood lead concentrations, rather than the location of collection. In livers of wild deer mice, 851 genes exhibited significant differential expression (ANOVA) in mice that were exposed to lead. Mice that were not exposed to lead did not show differential gene expression. We identified the 851 genes with 417 overlapping relevant cellular and/or metabolic processes (DAVID). Of these, 91 genes (ANOVA) could not be associated with known cellular processes and were not analyzed further. A complete table containing all identified genes and pathways is found in electronic supplement II.
In the deer mice exposed to lead in the field, 28 genes belonged to the mitochondrial cluster (enrichment score = 1.47). These included transcripts of Acyl-CoA dehydrogenase, Cytochrome c oxidase, and NADH dehydrogenase, etc (Table III and IV). Transcripts of d-aminolevulinic acid synthase-2, an erythroid specific gene associated with heme synthesis and/or degradation pathways were upregulated in liver of deer mice with higher blood lead (Table III). We identified 192 metal ion binding and ion transport genes, (enrichment score = 1.78), such as Calmodulin 1 (CAM1), protein phosphatases, and SPARC. Six heat shock related transcripts exhibited significant differential expression, including a 90KDa heat shock protein 1, alpha.
The IPA of the ANOVA selected genes from livers of the wild deer mice exposed to lead in the environment identified metabolic pathways identical to those found in the laboratory experiments, which were hypoxia-inducible factor signaling, NRF2-mediated oxidative stress response, and mitochondrial dysfunction on either canonical or toxicological lists (Table V).
Table V: A comparative summary of the IPA of ANOVA selected genes, from liver, with +1.5 fold or more differential expression compared to control. We listed well-known lead modulated pathways common in both species. Some of these pathways belong to metabolic clusters recognized for lead intoxication. A pathway without p-value was not significant (<0.05) at the parameter.
|
Pathway Type |
Organism |
|
Wild P. maniculatus |
P. maniculatus |
||
|
Diet lead (%) |
Environmental |
|
0.5 |
0.5 |
1 |
|
|
|
Exposure Time (days) |
|
1 |
7 |
7 |
|
|
Pathway name (IPA): |
|
|||||
|
Toxicity |
Hypoxia inducible factor signaling (stress) |
|||||
|
|
p-values |
|
5.9E-3 |
3.1E-2 |
4.1E-3 |
4.0E-3 |
|
Note: |
No canonical pathway detected |
|||||
|
Canonical |
NRF2-mediated oxidative stress response |
|||||
|
|
p-values |
|
2.0E-4 |
1.4E-3 |
|
|
|
Toxicity |
Oxidative stress response mediated by NRF2 |
|||||
|
|
p-values |
|
1.0E-4 |
8.9E-4 |
2E-1 |
|
|
Canonical |
Oxidative phosphorylation |
|||||
|
|
p-values |
|
|
|
2.7E-2 |
|
|
|
Citrate cycle |
|||||
|
|
p-values |
|
3.2E-2 |
|
|
|
|
|
Pyruvate metabolism |
|||||
|
|
p-values |
|
|
|
|
|
|
|
Calcium signaling |
|||||
|
|
p-values |
|
|
6.7E-3 |
|
|
|
|
Mitochondrial dysfunction |
|||||
|
|
p-values |
|
3.4E-2 |
|
|
|
|
Toxicity |
Mitochondrial dysfunction |
|||||
|
|
p-values |
|
|
2.9E-1 |
1.1E-1 |
|
Putative signature genes for lead exposure in the field
In order to identify the ‘signature genes’ from wild deer mice that were regulated by lead (heavy metals), we compared the pattern of differential expression of individual genes from three major related physiological pathways, mitochondrial metabolism, metal binding and transport, in the livers of wild and laboratory mice. We identified 6 mitochondrial (median p-value = 0.00001), 7 metal binding (median p-value = 0.0059) and one heat shock (median p-value = 0.014) pathway genes that were either identical or nearly similar in the liver of lead-exposed wild and laboratory deer mice (Table IV).
Exposure to lead affected the differential expression of several genes of major mitochondrial electron transport proteins, such as Acyl coA dehydrogenase (Acad_s-l types), cytochrome oxidase, and NADH dehydrogenase. The genes of nuclear subunits VI and VII (Cox 6a, Cox7a like and Cox 7c) of Cytochrome oxidase were mostly down-regulated in both wild and laboratory deer mice exposed to lead (Table VI). Genes of NADH dehydrogenase (multiple Nduf_a-c types) were differentially regulated without any specific pattern or trend..
We detected Calmodulin genes (Calm1 and 2), which produce Ca binding proteins (CAM1), among the metal binding genes of both groups of deer mice. Calm transcripts were upregulated in the wild deer mice and downregulated in the laboratory deer mice. Protein phosphatases (Ppp2c types) exhibited differential expression in both groups of deer mice. Two other Ca binding proteins, Annexin 7 (Anxa7) and SPARC (Sparc) exhibited similar differential regulation in both groups of deer mice, In wild deer mice, we were unable to identify the transcripts of ferritin heavy chain (Fth1) and GATA binding protein 4 (Gata4) and hephaestin (Rpl17) (DAVID) that were upregulated in laboratory deer mice exposed to lead (Table IV). We identified transcripts of the 90KDa but no 110KDa heat shock protein (Hsp 90aa1) in both wild and laboratory deer mice.
The IPA of the ANOVA selected genes identified the following metabolic pathways, Nrf2-mediated oxidative stress response, hypoxia-inducible factor signaling, and mitochondrial dysfunction/oxidative energy metabolism (Table V). These pathways contain a few common diagnostic genes such as heat shock protein 90kda alpha (cytosolic) A1 (Hsp90aa1), DnaJ (hsp40) homolog C21, protein kinase B/AKT1, ATF4/CREB2, and cytochome oxidase VIA (Cox6a1), VIIA (Cox7a2l), NADH dehydrogenase Fe-S proteins (NDUFS-), respectively.
Deer mice exposed to lead in their food in the laboratory took up that lead and the resulting elevated lead in their blood was associated with a decline in Hb. We identified specific up and down regulation of genes associated with metabolic pathways in those mice. We then collected deer mice in the field at a site contaminated with lead and at another site that was uncontaminated. Exposure to lead in the field is most likely through ingestion of seeds grown in contaminated soil and injection of contaminated soil and dust while grooming. Deer mice from the contaminated site showed the same or similar up and down regulation of genes as the lead exposed mice in the laboratory. Whereas deer mice from the control site, in general, did not show those gene regulation patterns.
We discovered that straight forward comparison of gene expression (ANOVA) between deer mice collected from ‘contaminated and clean sites’ without accounting for the blood-Pb data failed to yield significant differential expression of Pb associated stress genes. We detected two deer mice from the contaminated (BLA2) site with blood-Pb concentration identical to that of the control laboratory mice and three deer mice from the control site (KF) with elevated levels of blood-Pb. Variations in levels of lead in the blood of individual Peromyscus probably resulted from variations in levels of lead in their environment. The two mice from BLA2 with undetectable level of blood lead were caught a few meters away from the lead contaminated building. Microchanneling of runoff from the building created variable lead concentrations in the soil near the building, with metal concentrations decreasing rapidly at and beyond two meters of the building (EPA report, individual communication). So there was microvariation in the contamination at that site. The two “clean” mice apparently lived on an area of soil that was not contaminated with lead. The mice from the control site that had elevated blood-Pb level were actually contaminated with lead. Those mice came from areas with agricultural buildings on KF. Two mice collected next to a modern building had low levels of lead in their blood and the third animal had a level of lead in its blood similar to that of the mice from the contaminated site. In retrospect we collected that mouse from the area of an historic barn that had been painted with lead based paint for over 100 years. In order to identify significant differential expression of putatively Pb induced stress related genes (ANOVA) in the liver samples of field specimens, we grouped ‘raw’ (ImaGene) data from individual mice on the basis of their blood-Pb versus heme concentration, with one group having high blood lead combined with lower heme content and the other with zero blood lead combined with higher heme content.
Our molecular approach successfully identified areas with lead contamination in the field through the blood lead versus heme concentration and gene expression of deer mice that lived in those areas. Our research resolved two important toxicogenomic aspects of lead exposure: one, identification of association between gene expression and several known lead induced physiologic, metabolic, or functional pathways and two, detection of that gene expression in rodents readily available in both laboratory and field. Deer mice proved to be a desirable species for testing the lead exposure in the field, even when used with Mus genomic tool.
Development of an analytical technique applicable to environmental toxicogenomics of lead
We identified several sets of genes regulated differentially between two sets of wild deer mice, Differentially expressed genes from wild deer mice and laboratory deer mice, following volcano plot and ANOVA (GeneSpring) (Table III), were classified according to their numbers and significance of association with specific biochemical and biological pathways in the liver using DAVID and IPA. That provided us a global view of the plausible gene clusters (biological pathways and processes) modulated in the liver lead exposed mice and enabled us to identify genes belonged to mitochondrial metabolism, metal binding and transport and stress associated pathways (Table IV and V).
Exposure to lead (heavy metals) caused anomalous expression of mitochondrial energy metabolism genes (dysfunction) in the liver
Lead affects mitochondrial energy metabolism through the inhibition of cytochrome oxidase and NADH dehydrogenases activities (Verma, et al. 2005; Goyer and Rhyne, 1973) . Transcripts of the two nuclear subunits of cytochrome oxidase, VI and VII, were consistently down regulated both in wild and laboratory rodent livers (Table IV and V). These two subunits bind to cardiolipin, a mitochondrial inner-membrane lipid (Sedla´k, et al. 2006), which is required for the maintenance of structural and functional integrity of the enzyme (Sedla´k, et al. 1999; Robinson, 1993). Verma et al. (2005) also attributed lead induced inhibition of cytochrome oxidase activity to the altered lipid environment in the mitochondrial inner membrane resulting from increased oxidative stress . Here we present direct mechanistic data that lead alone suppressed the transcription of two nuclear subunits, VIa and VII a and c, required for the maintenance of structural and function integrity of cytochrome oxidase through cardiolipin binding. The expression of genes of NADH dehydrogenase complex, the first enzyme of the mitochondrial electron transport chain, also exhibited consistent differential regulation from lead exposure to deer mice in the wild and in the laboratory (Table IV and V), although identical transcripts were not downregulated in both groups. In wild deer mice, down regulation of NADH dehydrogenase (ubiquinone) 1 alpha subcomplex 13 (Table IV and V) (Nadufa13/Grim19) transcript might result in the reduction of properly assembled NADH dehydrogenase enzyme in the inner mitochondrial membrane (Huang, et al. 2004). In addition, simultaneous up and down regulation of two or more subunits (Table IV and V) (Naduf a, b, c) of a multi-subunit enzyme like NADH dehydrogenase 1 (Friedrich, et al. 1995)would result in loss of integrity of enzyme structure and function. These data on gene expression of cytochrome oxidase and NADH dehydrogenase provided a second mechanistic explanation, beyond the functional inhibition of the enzymes, for the lead induced inhibition of two gateway enzymes of the mitochondrial electron transport chain (oxidative phosphorylation).
Expression of multiple stress inducible pathways in the liver
The Hsp1 is a well known molecular chaperone required for protein folding, and its expression is associated with stress, such as increase in temperature, induction of various cancers, multi-drug resistance, etc. (Chen, et al. 2005; Csermely, et al. 1998). Its inhibition provides an important pharmacological platform for cancer therapy (Sreedhar, et al. 2004). Among all the heat shock protein genes exhibiting differential expression, the transcript Hsp90aa1 (Hsp1) was detected in both groups of deer mice (Table IV and V). However, Hsp90aa1 was upregulated in wild deer mice but downregulated in laboratory deer mice (Table IV).
Protein Phosphatase 2C (PP2C) is a monomeric divalent cation binding enzyme that is involved in regulation of stress induced protein kinase (SAPK pathway) cascades that respond to external stimuli (Meskiene, et al. 2003). Among all PP2C transcripts, PP2CA was differentially regulated in both groups. However, the mode of regulation differed among wild deer mice (up, Table IV) and laboratory deer mice (down, Table IV).
In support of above analysis, IPA of ANOVA selected genes also identified significant expression of hypoxia inducible genes and Nrf2 mediated oxidative stress response genes in the livers of both laboratory and wild deer mice (Table V). Lead, heavy metals and other toxicants are known to induce these pathways in the liver (Lamsa, et al. 2010; Osburn and Kensler, 2008).
Regulation of metal ion homeostasis related genes in liver
There was differential regulation of multiple metal binding genes, including Cox, Hsp, PP2C and Acyl CoA dehydrogenases (Table IV) (Sipos, et al. 2003). Calmodulin 1 (calm) transcripts were differentially regulated in both groups of mice (Table IV). Lead is known to replace calcium in the Ca-binding cellular proteins, such as Calmodulin-1 (CaM1) (Osburn and Kensler, 2008; Wilson and Brunger, 2003), but this is first time that lead has been shown to affect the expression of Calm genes. In mammals, three independent calmodulin genes (calm) produce an identical protein (CaM1), which underscores the importance of this protein in cellular function that requires this level of genetic redundancy (Kern, et al. 2000). The Ca-CaM-1 complex maintains Ca homeostasis in all cells as well as functions as a secondary activator for multiple signal transduction pathways (Friedberg and Rhoads, 2001).
We found that expression of several genes of metal binding and stress pathways, such as ferritin heavy chain (fth1), heat shock protein transcript 110KDa and most of DnaJ (Hsp40) homologs modified in the liver of laboratory deer mice but not in the liver of wild deer mice (Table IV).
The reason for these differences in expression between laboratory exposed mice and field deer mice was probably because field mice were exposed to multiple stressors, both contaminants and environmental conditions, whereas laboratory mice were in a constant, moderated environment and only exposed to one contaminant. Mice were exposed to a complex mixture of heavy metals and organics at BLA2. In addition to lead, those mice were also exposed to soil containing high concentrations of barium, copper, iron, manganese and small amounts of chromium, cadmium, mercury and zinc. Of these metals we would expect that the elevated copper might be the likely cause for the differential effects seen in the field deer mice. The high level of barium would be most likely to affect the kidneys and heart (EPA reports) and manganese the nervous system, although Mn can also cause general oxidative stress (Zheng, et al. 2011). The level of chromium would not be expected to have health effects in humans (Paustenbach, et al. 1991). It is possible that the overall synergistic effects of all of these contaminants played some role in the overall gene expression of the mice from BLA2 (Chmielnicka, et al. 1994; Wang, et al. 2008). Concurrent exposure to several toxic metals may cause additive or synergistic, or even new effects [40].
However, the case for a direct effect of Pb exposure to the genetic response that we measured was strengthened by the response of three mice. Two mice from BLA2 did not show the Pb specific gene response. They also had no Pb in their blood. The KF mice in from the field with no Pb in the soil also did not show any gene response. The one mouse that did show the same gene response as the BLA2 Pb contaminated mice was captured near an old historic barn. That barn was painted with the classic “oxblood” Pb containing paint for over 100 years giving it a classic red color. We expect that a sample of the soil taken next to the barn would show that it was contaminated with Pb.
A robust analytical model
We successfully detected the presence of at least 13 genetic biomarkers in the liver of wild deer mice exposed to lead and other heavy metal mixed with other toxicants that are either identical or closely similar to that of those expressed in lead exposed laboratory deer mice We were able to go beyond the detection of a set of genes and identify specific transcripts of three common physiological processes and pathways:
We identified modulation of gene expression of five proteins in three pathways that were historically known to be affected by lead or heavy metal exposure or as response to stress (Table I, IV & V) and detected strong Nrf2 mediated stress response in all lead exposed deer mice (Table V), which vindicated the robustness of the analyses.
In this research, we discovered that at the level of gene transcription
Considering the variability of blood lead concentrations in the wild deer mice collected from both contaminated (BLA2) and ‘uncontaminated control’ (KF) areas, our approach reflected the value and robustness of combinatorial analysis in evaluating the biological toxicity of one (or a few similar) environmental toxicants, such as lead, mixed with multiple toxic materials. The metabolic profiling, although kept very simple and limited to the measurement of total blood lead and heme concentrations combined with differential gene expression data yielded exceptionally clear and comparable ‘genetic signatures’ of lead exposure in both wild and laboratory deer mice. Combinatorial analysis of the two metabolic parameters, blood lead and heme, made the cDNA microarray technique useful for identification of the genetic signatures of lead toxicity in a widely available rodent, the deer mouse, P. maniculatus. In future, the importance of each genetic pathway (signature) can be confirmed and/or refuted by additional metabolic analyses. Our approach also indicated the necessity of an adequate sample size collected over an extended period of time for assessing the extent of biological toxicity of heavy metals at any location or environment.
In this research, we developed a putative ‘genetic signature’ by comparing differential gene expression in wild deer mice contaminated with lead to differential gene expression in deer mice exposed to lead in the laboratory. We developed the genetic signature for lead exposure in the laboratory through combinatorial analyses of variations in multiple parameters, such as blood lead and heme concentrations and differential expression of relevant genes. We applied this experimental approach to deer mice exposed to lead in the environment and despite the expected complication of exposure to a combination of toxic metals at the field site we found a similar response in field deer mice as observed in the laboratory.
This analytical technique eliminated the need for the lengthy positive identification processes routinely used in medical toxicogenomics, such as quantitative RT-PCR (qPCR) and sequencing of cloned cDNAs of the differentially expressed genes. Confirmation of the differentially expressed genes by qPCR and cDNA sequencing cannot be accurately applied to wild deer mice collected from a natural population because the genomics of this species is not yet known. Likewise, the use of other wild animals as sentinel species is limited by the same problem. However, if the genetic response of a wild animal can be determined in the laboratory by using gene arrays developed for related species (such as Mus vs Peromyscus) as in this study, then wild animals may become more useful in combination toxicogenomic and metabolomics studies of environmental contamination. More detailed studies are needed to take into effect interactions among combinations of toxicants in the field, but the concept is sound and with improved genetic techniques in the future may soon be practical for environmental biomarker studies.
Authors thank L. Strickland, D. Provance, J. Wooge, and especially L. DiIoia at the Radford Army Ammunition Plant. Amit Basu conveys special thanks to J. Suss, C. Chang, C. Nicholes, and all the members of Showe and Spotila labs, and the University Laboratory Animal Resources staff. Kevin Owens directed the analytical chemistry measurements. The Environmental Information Technology Management Office of the U.S. Assistant Secretary of the Army for Installation and Environment through the Concurrent Technologies Corporation and Betz Chair of Environmental Science, Drexel University, funded this project.
Butt WH, Grossenheider RP. 1964. In: A field Guide to the Mammals, 2nd ed. Boston, MA: Houghton Mifflin Co 284.
Campagna D, Huel G, Girard F, Sahuquillo J, Blot P. 1999. Environmental lead exposure and activity of delta-aminolevulinic acid dehydratase (ALA-D) in maternal and cord blood. Toxicology 134: 143-152. 00031-1
View ArticleChen B, Piel WH, Gui L, Bruford E, Monteiro A. 2005. The HSP90 family of genes in the human genome: Insights into their divergence and evolution. Genomics 86: 627 – 637. PMid:16269234
View Article PubMed/NCBIChmielnicka J, Zareba G, Nasiadek M. 1994. Combined effect of tin and lead on heme biosynthesis in rats. Ecotoxicol Environ Saf 29: 165-173. 90017-5
View ArticleChristiani D. 2007. Applications of Toxicogenomic Technologies to Predictive Toxicology. National Academy Press, Washington, D.C. www.nap.edu National Academy of Sciences, National Research Council, Committee on Applications of Toxicogenomic Technologies to Predictive Toxicology, Board on Environmental Studies and Toxicology (BEST), Board on Life Sciences (BLS), Division on Earth and Life Studies.
Corpas I, Benito MJ, Marquina D, Castillo M, Lopez N, Antonio MT. 2002. Gestational and Lactational Lead Intoxication Produces Alterations in the Hepatic System of Rat Pups. Ecotox Environ Saf 51: 35-43. PMid:11800548
View Article PubMed/NCBICsermely P, Schnaider T, So˜ ti C, Proha’szka Z, Nardai G. 1998. The 90-kDa molecular chaperone family: Structure, function, and clinical applications. A comprehensive review, Pharmacol Ther 79: 129-168. 00013-8
View ArticleDennis G, Sherman BT, Hosack DA, Yang J, Gao W, lane, HC, Lempicki RA. 2003. DAVID: Database for annotation, visualization and integrated discovery. Genome Biol 4: R60. (modified and updated version was published on 2007).
View ArticleFriedberg F, Rhoads AR. 2001. Evolutionary aspects of calmodulin. IUBMB Life 51: 215-221. PMid:11569915
View Article PubMed/NCBIFriedrich T, Steinmuller K, Weiss H. 1995. The proton-pumping respiratory complex I of bacteria and mitochondria and is homologue of chloroplasts. FEBS Lett (Minireview) 367: 107-111. 00548-N
View ArticleGlenn JL, Chen CF, Lewandowski A, Cheng CH, Ramsdell CM, Bullard-Dillard R, Chen J, Dewey MJ, Glenn TC. 2008. Expressed sequence tags from Peromyscus testis and placenta tissue: analysis, annotation, and utility for mapping. BMC Genomics. 9:300 PMid:18577228
View Article PubMed/NCBIGoyer RA, Rhyne BC. 1973. Pathological effects of lead. Int Rev Expt Pathol 12: 1-77. PMid:4349348
PubMed/NCBIHacker JH, Bannasch P, Columbano A. 1990. Effect of lead nitrate on liver carbohydrate enzymes and glycogen content in the rat. Carcinogenesis 11: 2199-2204. PMid:2176137
View Article PubMed/NCBIHuang G, Lu H, Hao A, Ng DCH., Ponniah S, Guo K, Lufei C, Zeng Q, Cao X. 2004. GRIM-19, a Cell death regulatory protein, is essential for assembly and function of mitochondrial complex I. Molc Cell Biol 24: 8447–8456. PMid:15367666
View Article PubMed/NCBIJochheim A, Cieslak A, Hillemann T, Cantz T, Scharf J, Manns MP, Ott M. 2003. Multi-stage analysis of differential gene expression in BALB/C mouse liver development by high-density microarrays. Differentiation. 71:62-72. PMid:12558604
View Article PubMed/NCBIKari, L, Loboda A, Nebozhyn M, Rook AH, Vonderheid EC, Nichols C, Virok D, Chang C, Horng WH, Johnston J, Wysocka M, Showe MK, Showe LC. 2003. Classification and prediction of survival in patients with the leukemic phase of cutaneous T-cell lymphoma. J Exp Med 197: 1477–1488. PMid:12782714
View Article PubMed/NCBIKern M, Wisniewski M, Cabell L, Audesirk G. 2000. Inorganic lead and calcium interact positively in activation of calmodulin. Neurotoxicology 21: 353-363. PMid:10894125
PubMed/NCBILamb JC. 4th, Gulati D, Choudhury H, Chambers R, and Poonacha KB. 1985. CAS #301-04-2: Swiss CD-1 mice, at 0.0, 0.5, 1.0, and 2.0% in water. Started 8/24/82; Completed 3/11/85. In: Environmental Health Research and Testing NTIS #PB85203032/AS.
Lamsa V, Levonen AL, Leinonen H, Yla-Herttuala S, Yamamoto M and Hakkola J. 2010. Cytochrome P450 2A5 Constitutive expression and induction by heavy metals is dependent on redox-sensitive transcription factor Nrf2 in liver. Chem Res Toxicol 23: 977–985. PMid:20402460
View Article PubMed/NCBIMeskiene I, Baudouin E, Schweighofer A, Liwosz A, Jonak C, Rodriguez PL, Jelinek H, Hirt H. 2003. Stress-induced protein phosphatase 2C is a negative regulator of a mitogen-activated protein kinase. J Biol Chem 278: 18945–18952. PMid:12646559
View Article PubMed/NCBIMudipalli A. 2007. Lead hepatotoxicity & potential health effects. Indian J Med Res 126:518-527. PMid:18219078
PubMed/NCBIOsburn WO, Kensler TW. 2008. Nrf2 signaling: An adaptive response pathway for protection against environmental toxic insults. Mutat Res 659: 31–39. PMid:18164232
View Article PubMed/NCBIPeterson SM, Zhang J, Weber G, Freeman JL. 2011. Global Gene Expression Analysis Reveals Dynamic and Developmental Stage–Dependent Enrichment of Lead-Induced Neurological Gene Alterations. Environ Health Perspect. 119:615-621. PMid:21147602 PMCid:PMC3094410
View Article PubMed/NCBIPaustenbach DJ, Rinehart WE, Sheehan PJ. 1991. The health hazards posed by chromium-contaminated soils in residential and industrial areas: conclusions of an expert panel. Regul Toxicol Pharmacol. 13: 195-222. 90022-N
View ArticleRobinson NC. 1993. Functional binding of cardiolipin to cytochromec oxidase. J Bioenerg Biomembr 25: 153-163. PMid:8389748
View Article PubMed/NCBISansone SA, Morrison N, Rocca-Serra P, Fostel J. 2004. Standardization initatives in the (eco) toxicogenomics domain: a review. Comp Funct Genom 5: 633–641. PMid:18629184 PMCid:PMC2447477
View Article PubMed/NCBISakai T. 2000. Biomarkers of lead exposure. Industrial Health 38: 127-142. PMid:10812836
View Article PubMed/NCBISedla’k E, Panda M, Dale MP, Weintraub ST, Robinson NC.2006. Photolabeling of cardiolipin binding subunits within bovine Heart cytochrome c oxidase. Biochemistry 45: 746-754. PMid:16411750 PMCid:PMC2561917
View Article PubMed/NCBISedla’k E, Robinson NC. 1999. Phospholipase A2 digestion of cardiolipin bound to bovine cytochrome c oxidase alters both activity and quaternary structure. Biochemistry 38: 14966-14972.
View ArticleSipos P, Szentmihályi K, Fehér E, Abaza M, Szilágyi M, Blázovics A. 2003. Some effects of lead contamination on liver and gallbladder bile. Acta Biologica Szegediensis 47: 139-142.
Sreedhar AS, Kalmar E, Csermely P, Shen YF. 2004. Hsp90 isoforms: Functions, expression and clinical importance. FEBS Lett 562: 11– 15. 00229-7
View ArticleTrevisan A, Chiesura P, Sabbatucci M, Raimondi M, Buzzo A. 1983. In vivo interaction of lead with aminolevulinic acid dehydratase and induction of a thermolabile factor: an experimental model. Toxicol Lett 18:77-81. 90074-7
View ArticleTeijo'n C, Olmo R, Blanco MD, Romero A, Teijon JM. 2003. Effects of lead administration at low doses by different routes on rat spleens. Study of response of splenic lymphocytes and tissue lysozyme. Toxicology 191: 245-258. 00209-9
View ArticleVan Gelder RN, von Zastrow ME, Yool A, Dement WC, Barchas JD, Eberwine JH. 1990. Amplified RNA synthesized from limited quantities of heterogeneous DNA. Proc Nat Acad Sci USA 87: 1663 -1667. PMid:1689846
View Article PubMed/NCBIVerma SK, Dua R, Gill KD. 2005. Impaired Energy Metabolism after Co-Exposure to Lead and Ethanol. Basic & Clinical Pharmacol Toxicol 96: 475 -479. PMid:15910412
View Article PubMed/NCBIWang G, Fowler BA. 2008. Roles of biomarkers in evaluating interactions among mixtures of lead, cadmium and arsenic. Toxicol Appl Pharmacol 233: 92 -99. PMid:18325558
View Article PubMed/NCBIWielgus-Serafinska E, Zawadzka A, Falkus B. 1980. The effect of lead acetate on rat liver mitochondria. Acta Physiol. Pol. 31: 659-668. PMid:6454328
PubMed/NCBIWilson MA, Brunger AT. 2003. Domain flexibility in the 1.75A resolution structure of Pb++- Calmodulin. Acta Cyrstallographica, section D, Biological Crystallography 59: 1782-1793. PMid:14501118
View Article PubMed/NCBIYan J, Burman A, Nichols C, Alila L, Showe L C, Showe M K, Boyer B B, Barnes B M, Marr T G. 2006. Detection of differential gene expression in brown adipose tissue of hibernating arctic ground squirrels with mouse microarrays. Physiol. Genomics 25:346-353. PMid:16464973
View Article PubMed/NCBIZheng W, Fu SX, Dydak U, Cowan DM. 2011. Biomarkers of manganese intoxication. Neurotoxicology 32:1-8. PMid:20946915 PMCid:PMC3030659
View Article PubMed/NCBI