Eugène Megnassan,
University of Abobo Adjamé (now University Nangui Abrogoua), UFR SFA, Laboratoire de Physique Fondamentale et Appliquée, 02 BP 801, Abidjan 02, Cote D’Ivoire,
E-mail: megnase@yahoo.com
© 2019 Sift Desk Journals. All Rights Reserved
VOLUME: 2 ISSUE: 1
Page No: 103-124
Eugène Megnassan,
University of Abobo Adjamé (now University Nangui Abrogoua), UFR SFA, Laboratoire de Physique Fondamentale et Appliquée, 02 BP 801, Abidjan 02, Cote D’Ivoire,
E-mail: megnase@yahoo.com
Akori Esmel, [a] Melalie Keita, [a, c] Eugene Megnassan, [a, b, c]* Beguemsi Toï, [b] Vladimir Frecer, [c, d, e] and Stanislav Miertus[c, e, f]
Yong-Qiang Zhang(zyqiang@swu.edu.cn)
Wen Li(liwen@zzu.edu.cn)
Giuseppina Gini(gini@elet.polimi.it)
Karel Diéguez Santana(karel.dieguez.santana@gmail.com)
Akori Esmel, Melalie Keita, Eugene Megnassan, Beguemsi To
We have carried out computational optimization of antiparasitic azadipeptide nitrile inhibitors (AZN) of falcipain-3 (FP3) of Plasmodium falciparum (Pf), a cysteine protease of the papain superfamily, using structure-based drug design and computer-assisted combinatorial chemistry. Three-dimensional (3D) models of complexes of inhibitor - FP3 for a training sets of published AZN analogs with experimentally determined inhibitory potencies were prepared by in situ modification of the crystal structure of PfFP3 inhibited by K11017 (Protein Data Bank entry 3BWK). We have used molecular mechanics, conformational searching and implicit solvation model to compute Gibbs free energies of inhibitor - FP3 receptor complex formation and built quantitative structure-activity relationships (QSAR) model by correlating the experimental inhibitory potencies with the computed binding affinities. The model was able to explain 97% of the FP3 inhibition data variation and was further validated with help of 3D-QSAR pharmacophore model generation (PH4). Structural information obtained from the 3D models of the AZN - FP3 complexes and the PH4 guided us in designing virtual combinatorial libraries of novel AZN analogs. Comparative analysis of the active site interactions directed us in the selection of building blocks used in the libraries. The initial virtual library was focused by means of computationally predicted oral bioavailability and subsequently in silico screened with the PH4 pharmacophore models to identify new AZN inhibitor candidates. Their inhibitory activities predicted by the QSAR model fall into the low nanomolar concentration range.
Keywords: Azadipeptide nitrile, FP3 inhibitors, in silico screening, Malaria, Molecular Modeling, Pharmacophore, QSAR model, Virtual Combinatorial Library.
According to the World Health Organization (WHO) the year 2000 6th Millennium Development Goals (MDGs) to improve the state of the world by 2015, namely by reducing the number of malaria cases by 50% by 2015 [1] has been achieved. This “job half-done” picture is much more a statistical success than a great achievement. The other 50%, the one in the need of “malaria resistance overcoming” treatment, remains poised on a knife-edge. Indeed as resistance occurring against artemisinin combined therapy (ACT) has been reported [2],[3], our world is kept in a crucial need of efficient and resistance overcoming treatment. This picture is worsened in sub-Saharan Africa where the most defeating and resistant parasite, P. falciparum (Pf) strains are prevalent.
The development of new orally bioavailable, resistance overcoming and low cost antimalarial is subordinated to deep constrain. First, address attractive new target; second, proceed through a rational drug design approach; third, screen large, diverse library of compounds and finally come out with an almost perfect pharmacokinetic profile and multi-target compound.
Proteases have been identified as eligible and interesting targets and gathered global funding to address HIV/AIDS, opening the gate to the same family enzymes for malaria and tuberculosis [4]. Further, comparative studies initiative has been carried out to get insight into S2’ pocket fitting at Pf and HIV aspartic proteases’ active sites for inhibition with compounds such as KNI-10006 containing a norstatine core [5]. Several Pf proteases: Aspartyl Proteases (plasmepsins I, II, IV-X and HAP), zinc metallopeptidases (Falcilysin), dipeptidylaminopeptidase 1 (DPAP1), aminopeptidases and Cysteine Proteases (falcipains: FP1, FP2A, FP2B, FP3), have been reported in enzyme inhibition studies [6],[7]. Falcipains have drawn great interest due to their central role in the life cycle of Pf through hemoglobin degradation [8]. FP3, differently from FP2 looks more attractive since its inhibition is lethal to Pf [9],[10]. Importantly, due to the difference in nature of Pf cysteine proteases and their human orthologues, PfFP2-3 inhibitors will be selective over hFP making in this way PfFP of great interest for antimalarial development [11].
This research study focuses on falcipain 3 (FP3) inhibition since no approved drug against FP-3 is available. Reversible and irreversible inhibitors of falcipains have been reported. Among them, reversible inhibitors, namely azadipeptides nitrile (AZN) [12] are of interest. AZNs structurally helped in FP2/3 pockets filling despite their poor ADME profile, are really potent against both Plasmodium chloroquine-sensitive (3D7), and chloroquine-resistant (Dd2) strains.
The availability of crystal structure of FP2/3 alone or FP2/3:Inhibitor complexes [13],[14],[15],[16] opened the gate for knowledge and structure based approaches to widen the candidate population taking benefit from the large number of combinatorial libraries built in anti HIV design projects.
Very high FP3 inhibition increase is obtained from preferred interaction between the cyano group (electrophile) with the active site cysteine residue, precisely the thiol and the nitrogen atom in the P1 position of dipeptide nitriles [17],[18],[19]. For this reason we retain the peptidic AZN with the goal to identify best candidates through Quantitative Structure-Activity Relationship (QSAR) process and derive the FP3 inhibition pharmacophore which will further orientate the design of more potent non peptidic FP3 inhibitors.
In this work, we have built Hansch-type 'complexation' QSAR FP3 inhibition models in order to explain the biological activity variation versus the relative Gibbs free energy upon FP3: AZN complex formation’s respectively according to Molecular Mechanics – Poisson-Boltzmann (MM-PB) in silico approach. The robustness of the built one descriptor QSAR models was confirmed by a five features 3D-QSAR pharmacophore models (PH4) [20], which were prepared with help of bound conformations of the training sets of AZNs. In the next step virtual combinatorial libraries of AZN analogues respectively have been built with the aim to virtually design more potent orally bioavailable PfFP3 inhibitors. Starting from initial diversity libraries, computed ADME-related properties helped to identify subsets of predicted orally bioavailable AZN analogues to undergo screening by the PH4 pharmacophore models to yield best fit analogues. Based on the in silico complexation QSAR models we were able to predict the activities and select the best analogues with the highest predicted inhibitory potencies. Finally, computed ADME profiles of the best designed analogues were compared with those of the antiamalarials currently in use.
The workflow describing the steps of the whole process of virtual design of novel AZN analogues is presented in scheme 1.
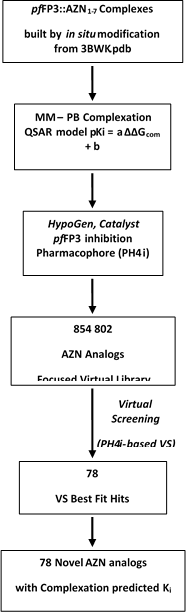
Scheme 1: workflow describing the multistep approach to virtually design novel AZN analogues with higher predicted potency against FP-3.
2.11 ADME-based library focusing
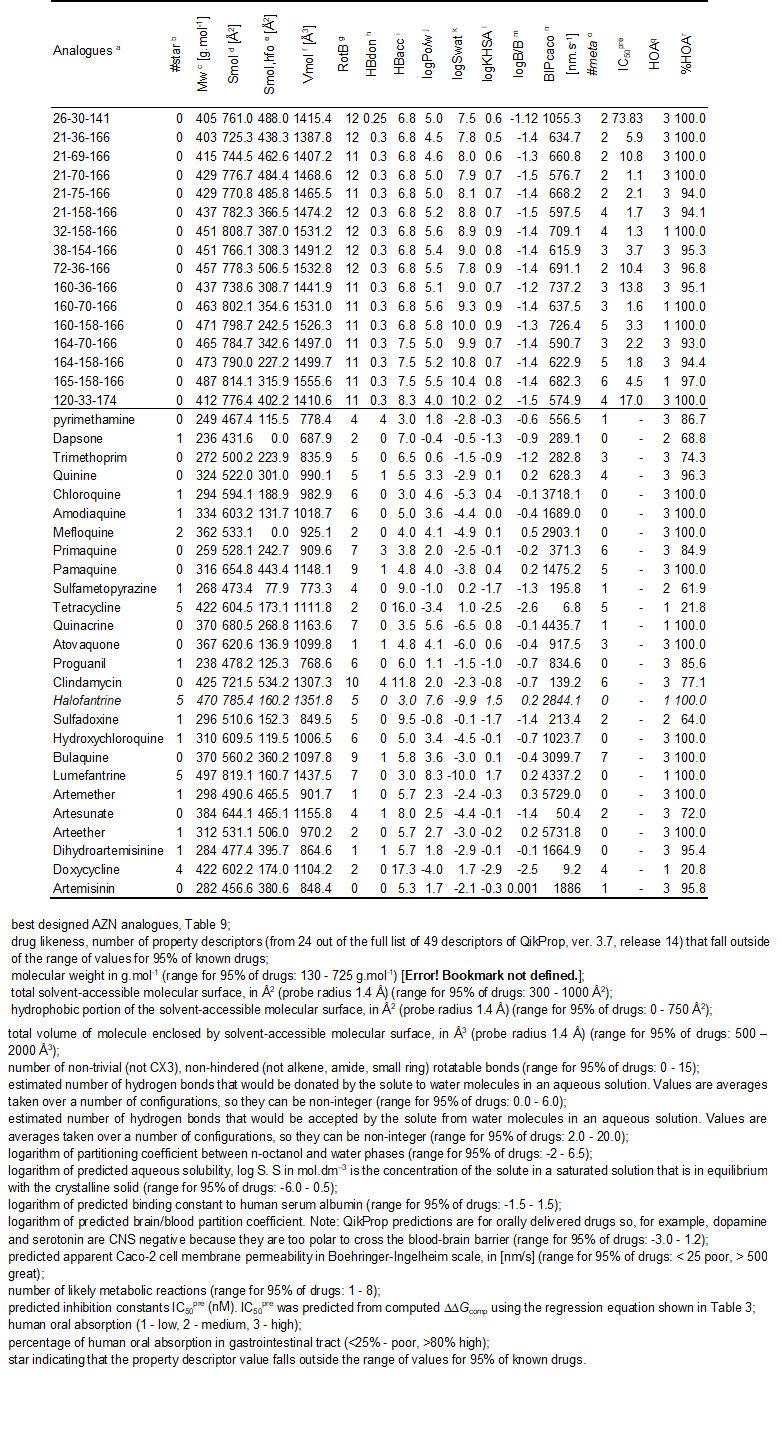
Twenty four pharmacokinetic molecular descriptors available in QikProp [42], which characterize a wide spectrum of molecular properties as described in section 2.9. such as molecular mass, total solvent-accessible molecular surface, hydrophobic portion of the solvent-accessible molecular surface, total volume of molecule enclosed by solvent-accessible molecular surface, number of non-trivial non-hindered rotatable bonds, estimated number of hydrogen bonds that would be donated by the solute to water molecules in an aqueous solution, estimated number of hydrogen bonds that would be accepted by the solute from water molecules, logarithm of partitioning coefficient between n-octanol and water phases, logarithm of predicted aqueous solubility, logarithm of predicted binding constant to human serum albumin, logarithm of predicted brain/blood partition coefficient, apparent Caco-2 cell membrane permeability in Boehringer-Ingelheim scale, number of likely metabolic reactions, percentage of human oral absorption in gastrointestinal tract, etc. Optimum ranges of the 24 descriptors were defined in terms of upper and lower bounds, and average values according to QikProp [42]. Drug likeness was used as ADME-related compound selection criterion. Only compounds with predicted drug likeness #stars equal to zero were selected for the focused library of drug like analogues.
2.12 Pharmacophore-based library focusing
The pharmacophore models (PH4) described in section 2.8. was derived from the bound conformations of AZNs at the active site of FP3. The enumerated and ADME-focused virtual library was further focused by using the ligand pharmacophore mapping protocol available of Discovery Studio [33]. Within this protocol, each generated conformer of the analogues was geometry optimized by means of the CFF forcefield for a maximum of 500 energy minimization steps and subsequently aligned and mapped to the PH4 model in order to select the top ranking overlaps. Twenty best-fitting conformers were saved and clustered into ten conformational families according to their mutual r.m.s. deviations by means of Jarvis-Patrick complete linkage clustering method [48]. The best representative of each cluster was considered in the virtual screening of analogues.
2.13 In silico screening
The conformer with the best mapping on the PH4 pharmacophore in each cluster of the focused library subset was selected for virtual screening by the complexation QSAR model. The GFE of E:I complex formation in a water DDGcomp was computed for each selected new analogue and then used for prediction of FP3 inhibitory potencies (IC50pred) of the focused virtual library of AZN and AZN analogues by inserting this parameter into the target-specific scoring function, eq. (9). The scoring function, which is specific for the FP3 receptor of Pf: pIC50pred[FP3] = a×DDGcomp + b, was parameterized using the QSAR model described above, section 2.6
2.1 Training sets
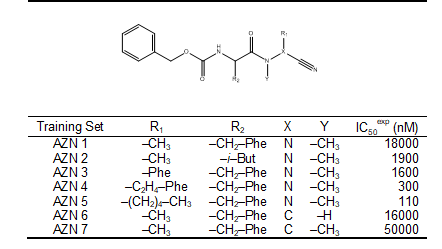
Chemical structures and biological activities (IC50exp) of training and validation sets of azadipeptide nitrile (AZN) inhibitors of pfFP3 studied here were taken from literature [12]. The potencies of these compounds cover a broad range of half-maximal inhibitory concentrations (110 ≤ IC50exp ≤ 50000 nM), in order to allow construction of QSAR models. The training sets of AZN contained 7 inhibitors taken from the reference [12].
2.2 Model building by in situ modification
Three dimensional (3D) molecular models of enzyme-inhibitor complexes FP3-AZNx, free enzyme FP3 and free inhibitors AZNx were constructed from high-resolution (2.42 Å) X-rays crystal structure of the inhibitor K11017 (Mu-Leu-Hph-VSPh where VSPh: phenyl vinyl sulfone; Hph: homophenylalanyl; Mu: morpholino urea:) bound to the plasmodial FP3 (Protein Data Bank (PDB) [20] entry code 3BWK [20] ) using Insight-II molecular modeling program [21].
The structures of FP-3 and enzyme-inhibitor (E:I) complexes were considered in the computations to be at the pH of 7 with neutral N- and C-terminal residues. All protonizable and ionizable residues were charged. All crystallographic water molecules were removed from the model. The inhibitors were built from the reference structure 3BWK [20] by in situ modification of derivatized groups in the molecular scaffold of the co-crystallized inhibitor K11017. An exhaustive conformational search was carried out over all rotatable bonds of the replacing function groups coupled with a careful gradual energy-minimization of the modified inhibitor and active site residues of the FP3 located in the close vicinity of the inhibitor (≤ 5 Å). This process helped to identify low-energy bound conformations of the modified inhibitor leading to various low-energy structures of the E:I complexes which were then carefully refined by minimization of the whole complex. This procedure has been successfully used to build viral, bacterial and protozoal enzyme-inhibitor complexes models and design of peptidomimetic, hydroxynaphthoic, thymidine, triclosan and pyrrolidine-based enzyme inhibitors [23,24,25,26,27,28,29,30,31].
2.3 Molecular mechanics
Modeling of inhibitors, FP3 and E:I complexes was carried out in all-atom representation using CFF91 force field [32] atomic and charge parameters. In the enzyme a dielectric constant of 4 was retained for all molecular mechanics (MM) calculations in order to take into account the dielectric shielding effect in proteins. Energy Minimizations of the E:I complexes, free E and I were carried out by relaxing the structures gradually, starting with the added hydrogen atoms, further with inhibitor heavy atoms, followed by residue side chains and concluded with protein backbone relaxation and alpha carbons. In all the geometry optimization process, a sufficient number of steepest descent followed by conjugate gradient iterative cycles were used while the convergence criterion for the average gradient was set to 0.01 kcal×mol-1×Å-1.
2.4 Conformational search
Free inhibitor’s conformations were obtained from their bound conformations in the E:I complexes by gradual relaxation to the nearest local energy minimum. Then a Monte Carlo (≤ 50000 iterations) low-energy conformations search over all rotatable bonds except those in the rings was performed using Discovery Studio 2.5 (DS 2.5) molecular modeling program [32]. Two hundred inhibitor unique conformations were generated after randomly varying torsion angles of the last accepted conformer by ±15 ° at 5000 K followed by subsequent energy minimization. During the minimization a dielectric constant e = 80 was used to approximately take account of for the dielectric screening effect of hydration. The conformer with the lowest total energy was selected and re-minimized at e = 4.
2.5 Solvation Gibbs free energies
The electrostatic component of solvation Gibbs free energy that includes also the effects of ionic strength via solving nonlinear Poisson-Boltzmann equation [29,30] was computed by the DelPhi module in Discovery Studio [33]. The program treats the solvent as a continuous medium of high dielectric constant (eo = 80) and the solute as a cavity of low dielectric (ei = 4) with boundaries linked to the solute’s molecular surface, which encloses the solute’s atomic charges. The program uses a finite difference method to numerically solve for the molecular electrostatic potential and reaction field around the solute. DelPhi calculations were carried out on a (235 × 235 × 235) cubic lattice grid for the E:I complexes and free E and (65 × 65 × 65) grid for the free I with full coulombic boundary conditions. Two subsequent focusing steps (starting at 50% and reaching 70%) led in both cases to a similar final resolution of about 0.3 Å per grid unit at 70 % filling of the grid by the solute. Physiological ionic strength of 0.145 mol×dm-3, atomic partial charges and radii defined in the CFF force field parameter set [33] and a probe sphere radius of 1.4 Å were used. The electrostatic component of the Poisson Boltzmann solvation Gibbs free energy was calculated as the reaction field energy [34], [35], [36], [37], [38].
2.6 Calculation of binding affinity and QSAR model
Inhibition constant (Ki) of a reversible inhibitor I is related to the standard Gibbs free energy (GFE) change upon formation of the enzyme-inhibitor (E:I) complexes (DGcomp) in a solvent. Thus prediction of Ki value from the complexation GFE as lnKi = -DGcomp/RT, is achievable assuming the following equilibrium:
{E}aq + {I}aq ↔ {E:I}aq (1)
where {}aq indicates solvated species. Half-maximal inhibitory concentration IC50 is for tight binding competitive inhibitors proportional to Ki:
IC50 = Ki×(S/Km + 1) + E/2 (2)
where S is the substrate concentration, Km represents the Michaelis constant and E means the free enzyme concentration [[i]]. The standard GFE change of the reaction (1) can be derived by molecular simulations of the complex and the free reactants:
DGcomp = G{E:I} - G{E} - G{I} (3)
In this work we approximate the exact values of standard GFE for larger systems such as enzyme-inhibitor complexes by the expression [23, 24, 25]:
G{E:I} ≈ EMM{E:I} + RT - TStrv{E:I} + Gsolv{E:I} (4)
where EMM{E:I} stands for MM total energy of the complex (including bonding and non-bonding contributions), Gsolv{E:I} is the solvation GFE and TStrv{E:I} is the entropic term:
TStrv{E:I} = TStran{E:I} + TSrot{E:I} + TSvib{E:I} (5)
composed of the sum of contributions arising from translational, rotational and vibrational motions of E:I. Assuming that the tran and rot terms for the complex E:I and free enzyme E are approximately equal, we obtain:
DGcomp ≈ [EMM{E:I} - EMM{E} - EMM{I}] + [Gsolv{E:I} - Gsolv {E} - Gsolv {I}] +
+ TStran{I} + TSrot{I} - [TSvib{E:I} - TSvib{E} - TSvib{I}] =
= DHMM + TStran{I} + TSrot{I} - DTSvib + DGsolv (6)
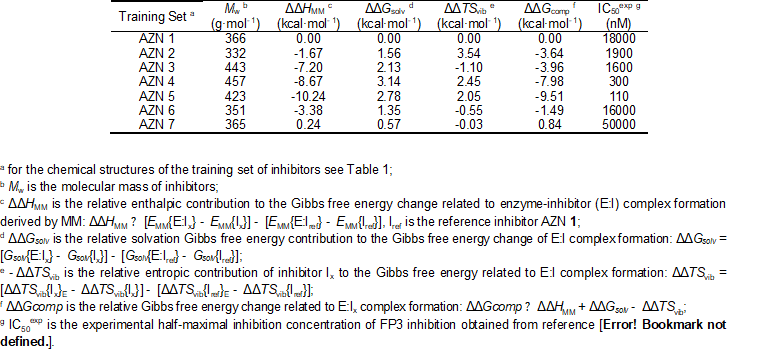
where TStran{I} and TSrot{I} describe the translational and rotational entropy terms of the free inhibitor and DTSvib represents a simplified vibrational entropy change upon the complex formation: DTSvib = TSvib{I}E - TSvib{I} [40], [41]. In the same way DDHMM is the relative enthalpic contribution to the GFE change related to the intermolecular interactions in the enzyme-inhibitor complex derived by MM.
Relative changes in the complexation GFE of different inhibitors with respect to a reference inhibitor, Iref, were computed assuming ideal gas behavior for the rotational and translational motions of the inhibitors:
DDGcomp = DGcomp (I) - DGcomp (Iref) = DDHMM - DDTSvib + DDGsolv (7)
This evaluation of relative changes is preferable as a way to partial cancellation of errors originated from the approximate nature of the MM method, solvent and entropic effects description as well.
Quantitative structure-activity relationships (QSAR) model, in which a linear relationship between the computed relative GFE of the FP3-AZN complex formation DDGcomp for the receptor structure and observed inhibitory potencies IC50exp specific to pf, is assumed according to eqs. (1) and (2):
pIC50exp = -log10IC50exp = a×DDGcomp + b (8)
was prepared by linear regression for both training set using DDGcomp quantities calculated via eq. (7), a and b are regression coefficients. These QSAR models (a target-specific scoring function) was then employed for prediction of inhibitory potencies (IC50pred) of newly designed and modeled AZN analogues (section 2.1).
2.7 Interaction energy
The MM interaction energy (Eint) protocol available in DS 2.5 [33] computes the non-bonded interactions (van der Waals and electrostatic terms) between enzyme residues and the inhibitor. The calculations were performed using CFF force field [32] with a dielectric constant of 4. The breakdown of Eint into active site residue contributions reveals the significance of individual interactions and allows a comparative analysis, which leads to identification of affinity enhancing and unfavorable AZN substitutions.
2.8 Pharmacophore generation
Pharmacophore modeling assumes that a set of structural features in a molecule is recognized at the receptor site and is responsible for biological activity of the compound. Bound conformations of inhibitors taken from E:I complexes were considered for constructing 3D-QSAR pharmacophore based on Catalyst HypoGen algorithm implemented in DS 2.5 [33]. The top scoring pharmacophore hypothesis was built up in three stages (constructive, subtractive and optimization step) from a set of the most active inhibitors while inactive ones served for definition of the excluded volume. During the pharmacophore generation, maximum number of five features allowed by the HypoGen algorithm was selected according to the AZN scaffold and substituents, namely: hydrophobic aromatic (HYdAr), hydrophobic aliphatic (HYd), hydrogen-bond donor, (HBD), hydrogen-bond acceptor (HBA) and ring aromatic (Ar) feature. Default values of adjustable parameters of the protocol were kept except the uncertainty on the activity and the minimum inter-feature distance, which were set to 1.25 and 0.5 Ǻ (for small ligand). This parameter choice was intended to bring the uncertainty interval of experimental activity from a wide span áIC50/3, 3×IC50ñ to a relatively narrow one á4×IC50/5, 5×IC50/4ñ, taking thus account of the accuracy and homogeneity of the measured inhibitory activities since they are coming from the same laboratory [12]. During generation of 10 pharmacophores the number of missing features was set to 0. The best pharmacophore models were selected.
2.9 ADME properties
Properties that determine the pharmacokinetics profile of a compound, besides octanol/water partitioning coefficient, aqueous solubility, blood/brain partition coefficient, Caco-2 cell permeability, serum protein binding, number of likely metabolic reactions and eighteen more descriptors related to adsorption, distribution, metabolism and excretion (ADME properties) of the inhibitors were computed by the QikProp program [[i]] based on the methods of Jorgensen [43], [44], [45]. According to those methods, experimental results of more than 710 compounds among which about 500 drugs and related heterocycles were correlated with computed physicochemical descriptors resulting in an accurate prediction of molecule’s pharmacokinetic profile. Drug likeness (#stars) - the number of property descriptors that fall outside the range of values determined for 95 % of known drugs out of 24 selected descriptors computed by the QikProp [42], was used as an additional ADME-related compound selection criterion.
2.10 Virtual Combinatorial library generation
The analogue model building was performed with Molecular Operating Environment (MOE) program [[i]]. The library of analogues was enumerated by attaching R-groups (fragments, building blocks) onto AZN scaffold using the Quasar CombiDesign module of MOE [46]. Chemical reagents considered in this study were taken from the directories of chemicals available from the commercial suppliers of chemicals [47]. Each analogue was built as a neutral molecule in the MOE program [46] and its molecular geometry was refined by MM optimization using smart minimizer of Discovery Studio [33] with high convergence criteria (energy difference of 10-4 kcal×mol-1, R.M.S. displacement of 10-5 Å) and a dielectric constant of 4 using class II consistent force field CFF [32] as described in the Molecular mechanics section 2.3.
In this study, a training set was selected from two homogeneous series of pfFP-3 inhibitors. The training set is composed of 7 Azadipeptide Nitrile (AZN), Table 1. Their chemical structures and experimental inhibitory concentrations IC50exp reported respectively by Reik Löser et al. [12], cover a concentration range sufficiently wide to serve well for building two reliable QSAR models of pfFP-3 inhibition.
Table 1. Training set (AZNx) of FP-3 inhibitors [12] used in the preparation of quantitative structure-activity relationships (QSAR) model of inhibitor binding
See table 1 in figures and tables below
3.1 Quantitative Structure-Activity Relationships (QSAR) Model
The relative Gibbs free energy of the non-covalent enzyme-inhibitor (E:I) complex formation was computed for the FP3-AZNx complexes prepared by in situ modification of the inhibitor K11017 within the binding site of FP-3 of the refined crystal structure (PDB entry code 3BWK [16]), as described in the section 2.6. Table 3 and 4 lists computed values of complex formation Gibbs free energies (ΔΔGcomp) and its components, Equation (7) for the training sets AZNs.
Table 2. Complexation Gibbs free energy (binding affinity) and its components for the training set of FP3 inhibitors AZN1-7
See table in figures and tables below
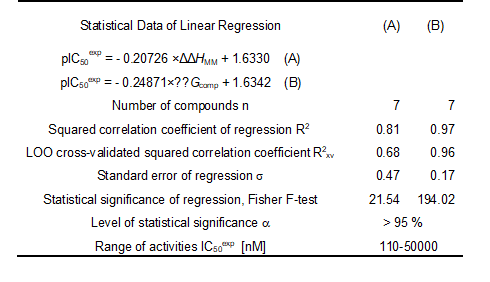
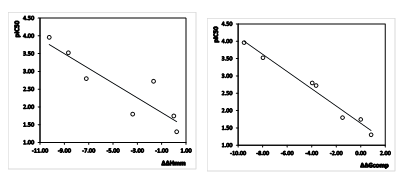
Since the ∆∆Gcomp was computed in an approximate way, the relevance of the binding model is evaluated through a correlation with the experimental activity data (IC50exp, [12]) by linear regression, eq. (8). For this training set, a correlation equation obtained for the Gibbs free energy (GFE) of enzyme-inhibitor complex formation ∆∆Gcomp is shown in Table 3 together with the relevant statistical data (see Figure 1 for the correlations plots). Relatively high values of the regression coefficient and the statistical significance Fischer F-test of the correlations involving ∆∆Gcomp, eq. (A), indicate that there is a strong relationship between the binding mode and the observed inhibitory potencies of the training set.
The robustness of this one descriptor QSAR model is assessed through the components of GFE namely the enthalpic HMM, solvation Gsolv and the loss of vibrational entropy upon the AZN binding TSvib. The relevance of the enthalpic contribution to GFE is well confirmed by the quality of the regression coefficient 0.81, the cross validated R2xv of 0.68 and the F-test of 21.54, indicating that in gas phase a large part (some 80%) of the variation of the IC50 is explained by that of HMM. Adding to HMM the solvation contribution in order to come closer to the biological medium, kept the level of strong relationship between the experimental data and the simulation results. Finally the likeliness of the model is increased by the loss of the vibrational entropy TSvib to explain some 97% of the variation of IC50 by that of GFE. This last contribution is one of the most reliable indicators of the predictive power of the QSAR model as reported by Freire et al. [49]. For this reason the lack of validation set (VS), due to the small number of provided AZNs experimental values is not detrimental, because the validation of the QSAR model is much more performed through the high predictive quality of the PH4 model derived from it than the VS, provided that it is based on the bound conformation of the AZNs (see figure 5 and table 6).
Therefore, the correlation equation (B) and computed ∆∆Gcomp quantities can be used for prediction of inhibitory potencies IC50pred against pfFP-3 for novel AZN analogues (AZNA) respectively, provided that they share the same binding mode as their corresponding training set.
Table 3. Regression analysis of computed binding affinities ∆∆Gcomp, its component ∆∆HMM, and experimental half-maximal inhibitory concentrations pIC50exp = -log10(IC50exp/106) [12] of AZNs towards pfFP3.
See table in figures and tables below
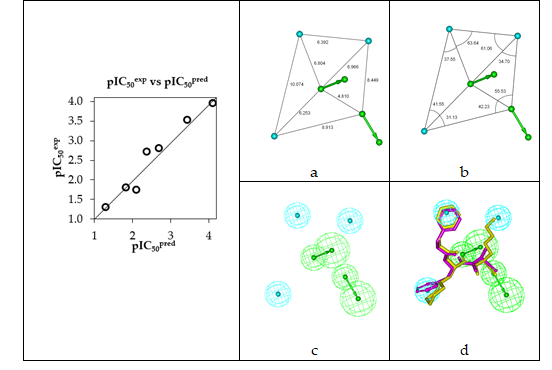
Figure 1. (Left) Plot of correlation equation between pIC50exp and the relative enthalpic contribution to the Gibbs free energy of PfFP3-AZNx complex formation ΔΔHMM (Eq. 6); (Right) Similar plot for relative complexation Gibbs free energies of the PfFP3-AZNx complex formation ΔΔGcomp of the training set, all in kcal.mol-1.
See Figure in figures and tables below
3.2 Binding mode of inhibitors
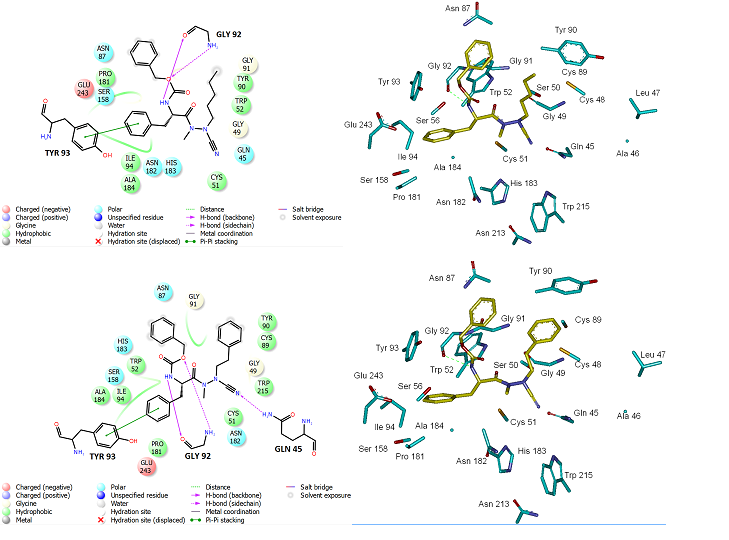
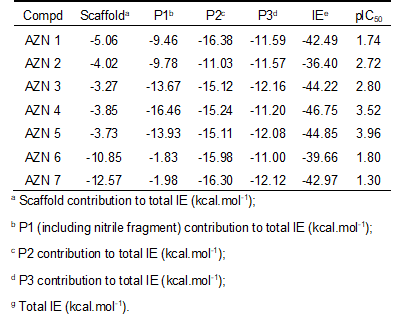
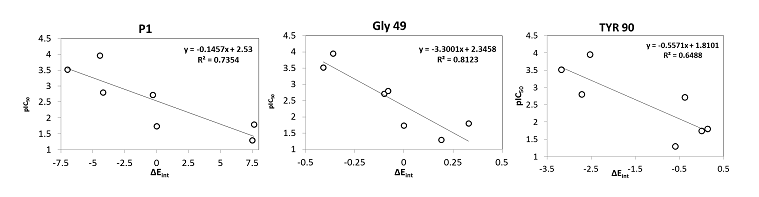
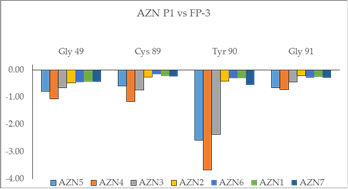
Beside the robustness of the QSAR model, the analysis of the interactions between AZNs and FP3 is expected to reveal key interactions justifying AZN::FP3 affinity such as hydrogen bonds (HBs), van der Waals (vdW), hydrophobic contacts, etc. As displayed in Figure 2, the binding mode of AZNs at FP3 active site of the best active AZN 5, and AZN 4 in 2D and 3D is supported by the following interactions: π-π stacking with Tyr 93, HB with Trp 52, Gly 92 and hydrophobic contacts. All interactions involving the catalytic and other key residues particularly Gly 92 are conserved. In order to verify whether other interesting interactions not displayed have to be taken into account in the description of AZN binding mode at FP3 active site for the design of new analogues, interaction energy (IE) between each active site residue and AZNx is computed. The peptidic structure of AZN shed light on the structural features for binding affinity and opened the gate to the design of non peptidic FP3 inhibitors taking benefit from S1 to S3 pockets filling. As displayed in Figure 4 the breakdown of IE diagram into each FP3 S1-3 pocket residue contribution for AZNs indicated a particular behavior of P1 comparatively to P2-3. The focus on S1 pocket comes from the fact that substitutions were mainly performed at P1 position of the AZNs during the SAR performed by Reik Löser et al. [12] (see table 1). This is also confirmed by the good correlation between P1 interaction energy with the FP3 and AZNs IC50 noticed in Figure 3. The major role of S1 pocket in the inhibition of FP3 is also confirmed by Falgun Shah et al. [50]. Unfortunately the lack in the training set of detailed SAR information involving other FP3 pockets justifies the low correlation between S2 and S3 contribution to IE with pIC50. In such case the unique IE diagram analysis cannot guide precisely in the choice of the R-groups in S1, S2 and S3 pockets as we were able to do for designing thymine-like inhibitors of thymidine monophosphate kinase [47]. Usually in such case, a large and diverse combinatorial virtual library (VL) of AZNs has to be built with the purpose to screen it with our 3D pharmacophore (PH4) of FP3 inhibition, based on the complexation one descriptor QSAR model. This approach successfully has been used to design pyrrolidine carboxamide inhibitors of Mycobaterium tuberculosis InhA [31].
Figure 2. (Top) Left: 2D schematic interaction diagram of the most potent inhibitor AZN 5 at the active site of PfFP3. Right. 3D structure of the active site with bound inhibitor AZN 5. (Bottom) Left: 2D schematic interaction diagram of the most potent inhibitor AZN 4 at the active site of PfFP3. Right. 3D structure of the active site with bound inhibitor AZN 4.
See Figure in figures and tables below
Figure 3. Plot of correlation between pIC50exp and P1, Gly 49 and Tyr 90 contribution to the intermolecular interaction energy of PfFP3-AZNx
See Figure in figures and tables below
Figure 4. Breakdown of FP3-AZN interaction energy into each active site residue contribution at S1 pocket.
See Figure in figures and tables below
3.3 Ligand-Based 3D-QSAR Pharmacophore Model of Inhibitory Activity
The 3D-QSAR pharmacophore generation process followed three main steps: (i) the constructive step, (ii) the subtractive step, and (iii) the optimization step. The constructive phase of HypoGen automatically selected the most active compounds for which IC50exp ≤ 1.25 × 110 nM as leads. Thus, the most active AZN 5 (IC50exp = 110 nM) alone was used to generate the starting PH4 features. Only those features were retained which matched this lead. Next, in the subtractive phase inactive compounds with are used to remove those pharmacophoric features that were present in more than 50 % of these compounds, while pharmacophores which contained all features were retained. None of the training set compounds was found to be inactive (IC50exp > 110 × 103.5 nM = 347 850.5 nM). During the final optimization phase, the score of the pharmacophoric hypotheses was improved. Hypotheses are scored according to errors in activity estimates from regression and complexity via a simulated annealing approach. At the end of the optimization the top scoring 10 unique pharmacophoric hypotheses (see Table 5) were kept, all displaying four features.
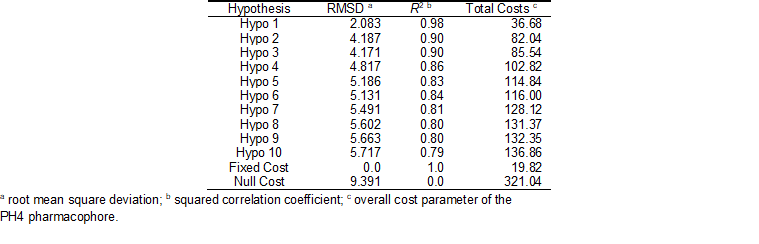
The generated pharmacophore models were then assessed for their reliability based on the calculated cost parameters. The overall costs ranged from 36.7 (Hypo 1) to 136.9 (Hypo 10). The relatively small gap between the highest and lowest cost parameter corresponds well with the homogeneity of the generated hypotheses and the consistency of the training set. For this PH4 model the fixed cost (19.8) is lower than the null cost (321.0) by a difference ∆ = 301.2. This difference is a major quality indicator of the PH4 predictability (∆ > 70 corresponds to an excellent chance or a probability higher than 90% that the model represents a true correlation) [33]. To be statistically significant the hypotheses have to be as close as possible to the fixed cost and as far as possible from the null cost. For the set of 10 hypotheses, the difference ∆ ≥ 184.2 attests the high quality of the pharmacophore model. The standard indicators such as the root-mean-square deviations (RMSD) between the hypotheses ranged from 2.083 to 5.717 and the squared correlation coefficient (R2) falls to an interval from 0.98 to 0.79. The first PH4 hypothesis with the best RMSD and R2 was retained for further analysis. The statistical data for the set of hypotheses (costs, RMSD, R2) are listed in Table 6.
Table 5. Output parameters of 10 generated PH4 pharmacophoric hypotheses for FP-3 inhibitors after CatScramble validation procedure.
See table in figures and tables below
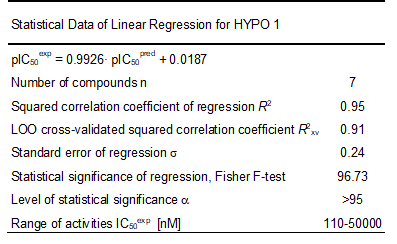
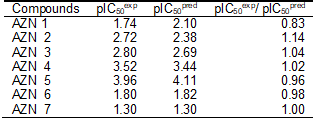
The geometry of the Hypo 1 pharmacophore of FP3 inhibition is displayed on Figure 5. The regression equation for pIC50exp vs. pIC50pred estimated from Hypo 1: pIC50exp = 0.9926× pIC50pred + 0.0187 (see Table 6 for its statistical data) is also plotted in Figure 5. The regression equation coefficient is close to one and the intercept close to zero indicating that the ratio of predicted and observed activities (pIC50pred/pIC50exp) for the training is relatively close to one (table 7) except for AZN1. Moreover, the statistical data in table 6 such as R2 and R2xv greater than 0.9 and a significance F-test of 96.73 document substantial predictive power of this regression for the best PH4 model.
Table 6. Regression analysis of experimental half-maximal inhibitory concentrations pIC50exp [12] and computed half-maximal inhibitory concentrations pIC50pred of AZNs towards pfFP-3.
See table in figures and tables below
Table 7. Computed the ratio of predicted and observed activities (pIC50pred/pIC50exp) for the training set
Figure 5. (a,b) Coordinates of the Hypo 1 pharmacophore of PfFP3 inhibiton, (c) features of the pharmacophore of PfFP3 inhibition and (d) pharmacophore mapping with AZN 1 (IC50exp=18000 nM) (purple) and the best fit hit 21-70-166 (IC50pred=1.1 nM) (yellow). The correlation plot of experimental vs. predicted inhibitory activity is displayed at the left. The features are colored blue for hydrophobic aliphatic (HYd), green for hydrogen-bond acceptor (HBA) and purple for hydrogen-bond donor (HBD). The arrows represent the projection for donor and acceptor features.
The randomization validation of the PH4 model was carried out by the CatScramble algorithm of the Catalyst for 49 random runs corresponding to a 98 % confidence level. This procedure created 10 valid hypotheses for each run. However, none of them was as predictive as the Hypo 10, the hypothesis with the highest cost of the ten best hypotheses generated and shown in Table 5. Thus there is a 98% probability that the best selected hypothesis Hypo 1 represents a pharmacophore model for inhibitory activity of AZNs with a similar level of predictive power as the complexation QSAR model, which relies on the 3D structures of the FP3-AZNx complexes and computed Gibbs free energies of enzyme-inhibitor binding DDGcomp. The main information provided by the PH4 is the relative coordinates of the three hydrophobic features (Figure 5 a, b) for an accurate filling of the active site pockets. Since it has been built from the active conformation of AZNs, this PH4 is suitable for an efficient screening of AZN analogues virtual library.
Therefore we have performed computational design and selection of new AZN analogues with increased inhibition potencies against FP3 of Pf. The design strategy relied on the mapping to the hydrophobic features included in the best PH4 pharmacophore model at the position of P1, P2 and P3 substitutions (PH4 hypothesis Hypo 1 in Figure 5).
3.3. Library design and ADME focusing
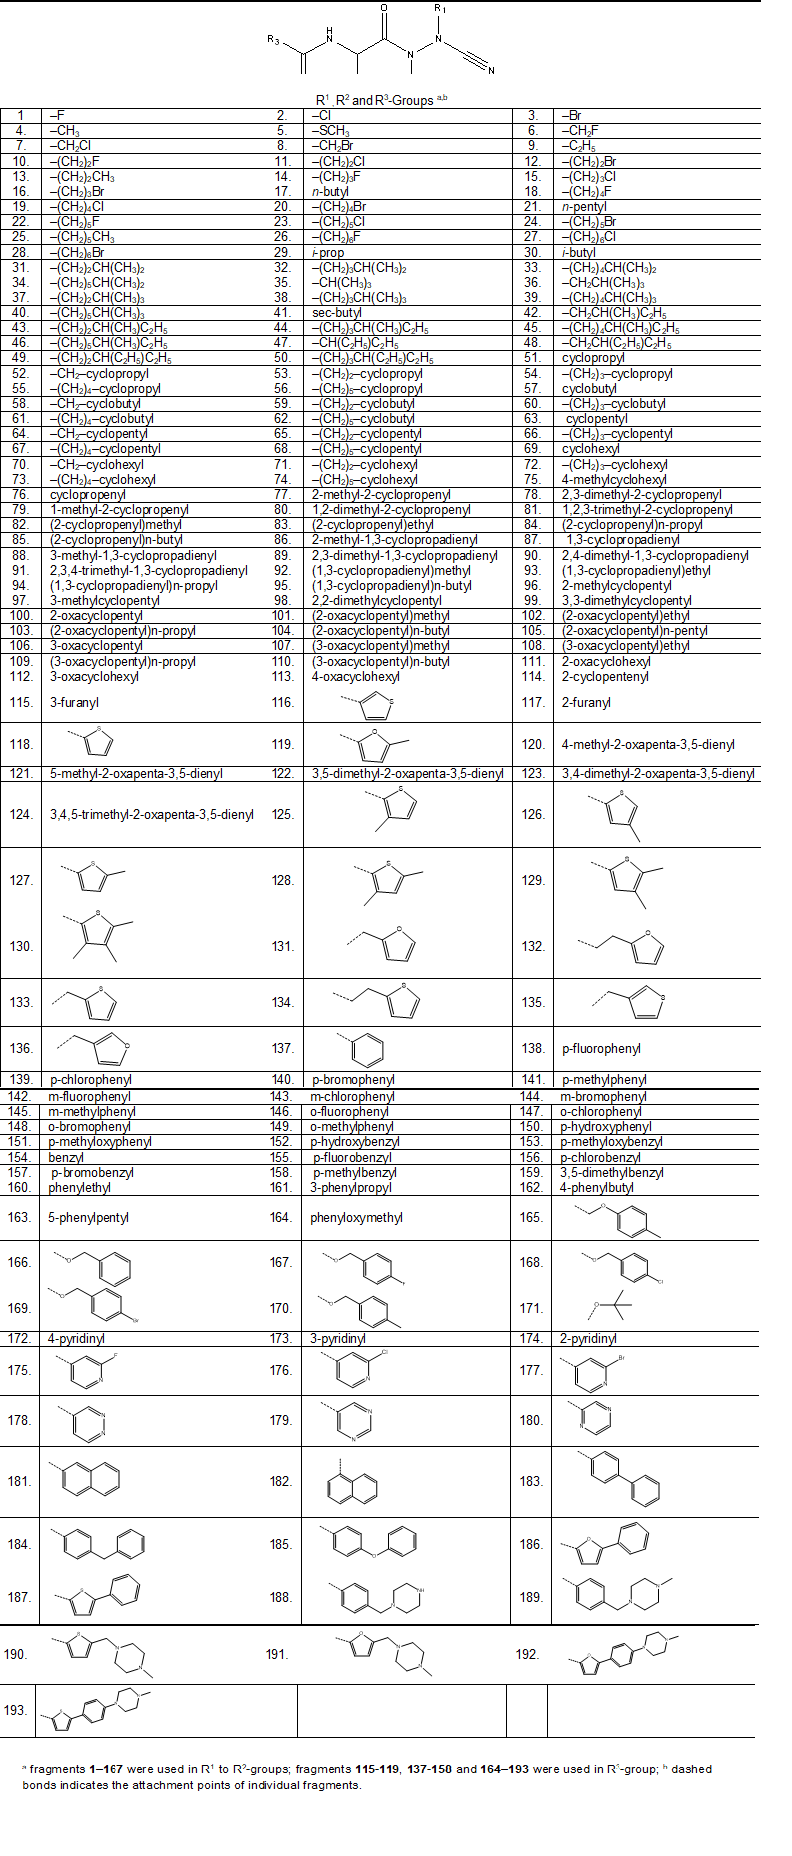
We have built a virtual libraries of new azadipeptide nitriles compounds with a variety of substitutions in free positions (P1, P2 and P3) with the goal to identify more potent orally bioavailable inhibitors of the pfFP3. During the virtual library enumeration the R-groups listed in Table 8 were attached in positions R1 to R3 of the AZN scaffold to form a combinatorial library of the size: R1 × R2 × R3 = 167 × 167 × 52 = 1,450,228 AZNA.
To design a more focused library of a reduced size and increased content of drug-like and orally bioavailable molecules, we have introduced a set of filters and penalties, which can help to select smaller number of suitable AZNs which can undergo in silico screening. The initial virtual library was then filtered in an ADME-based focusing step to remove compounds with expected poor oral bioavailability and low drug-like character. Only analogues with high predicted percentage of human oral absorption in the gastrointestinal tract HOA larger than 80% [43, 44] and compounds satisfying the Lipinski's rule of five [51] computed for the entire virtual library using QikProp software [42], were kept. This focusing has reduced the size of the initial library to 819,642 AZNA less than 60% its original number size.
Table 8. R-groups (fragments, building blocks, substituents) used in the design of the initial diversity library of azadipeptide nitriles analogues (AZNA).
The selected libraries subset then underwent virtual screening by means of their corresponding PH4 pharmacophore models of AZN inhibitory activity towards pfFP3.
3.4. In silico screening of AZNs virtual library
The library of AZN analogues was further screened for molecular structures matching to the 3D-QSAR PH4 pharmacophore model Hypo 1 of FP3 inhibition. From the reduced libraries few thousands of AZNA mapped to at least 2 features, 150 AZNA of which mapped to 5 features of the pharmacophore. Out of then, only 78 AZNA best fitting analogues (PH4 hits) have been retained and submitted to virtual evaluation with the help of the complexation QSAR model: their Gibbs free energy (GFE) upon complex formation with pfFP3 was computed along with its component and their predicted half-maximal inhibitory concentration IC50pred was estimated with the correlation equation (B) (Table 3). All the results are given in Table 9.
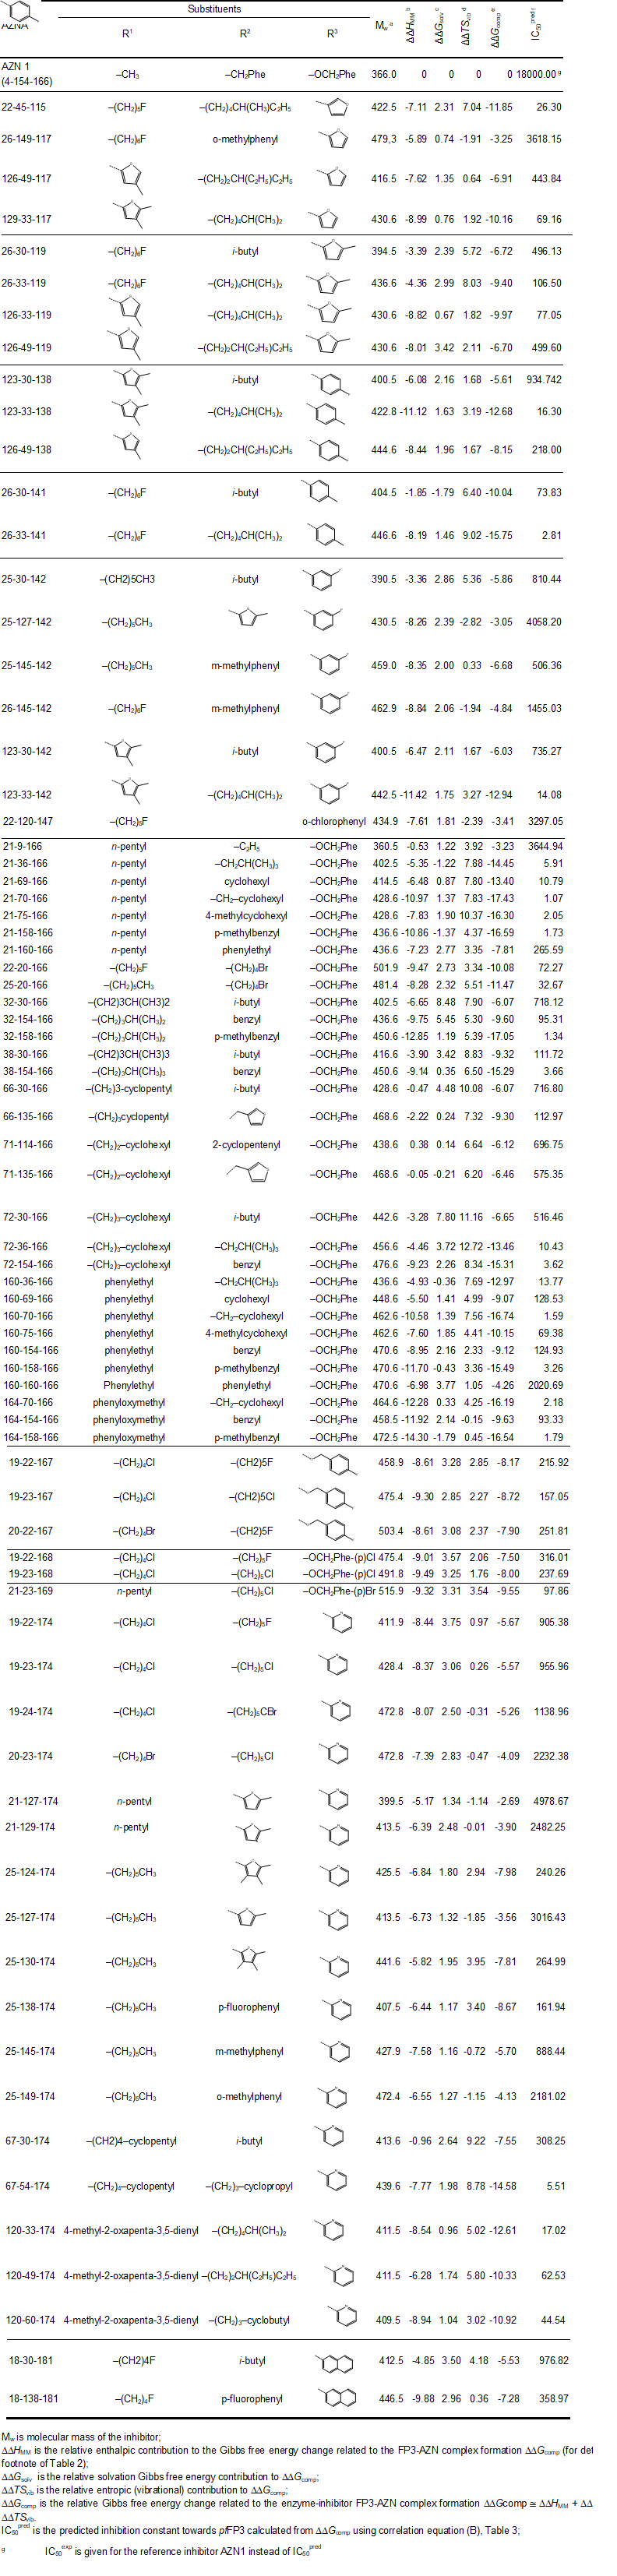
Table 9. Complexation Gibbs free energies and their components for the top 78 scoring virtually designed analogue AZNA. The analogue numbering concatenates the index of each substituent R1 to R3 with the substituent numbers taken from Table 8.
For 33 AZNA out of the 78, the estimated inhibitory potency shown in Table 9 is better than that for the most active training set compound AZN 5 (IC50exp = 110 nM [12]). In fact, the best designed AZN analogues 21-70-166 (1.1 nM) display predicted inhibitory potency about 100 times higher than the AZN 5 (21-154-166).
3.5. Analysis of new inhibitors
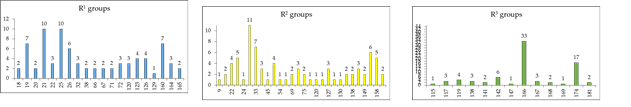
To identify which substituents on R-positions of AZN scaffold (Table 8) lead to new inhibitor candidates with the highest predicted potencies towards the FP-3 of Pf, we have prepared histograms of the absolute frequency of occurrence of R1 to R3 groups in the 78 PH4 best fit hits AZNAs selected from the focused virtual library shown in Table 9 (Figures 6).
Figure 6. Histograms of absolute frequency of occurrence of individual R1, R2, R3-groups in the 78 best-selected analogues mapping to the five features of the PH4 pharmacophore hypothesis Hypo 1 (for fragment’s structure and number see Table 8).
From the histograms in Figure 6 it comes out that R1 groups numbered 19 (7[1]), 21 (10), 25 (10), 26 (6), and 160 (7) are almost equally represented with the highest occurrence in the AZNs subset. The R2 groups contain preferentially 22 (4), 23 (5), 30 (11), 33 (7), 36 (3), 49 (4), 70 (3), 127 (3), 145 (3), 154 (6) and 158 (5) while the R3 groups include chiefly fragments 142 (6), 166 (33), and 174 (17). The top scoring virtual hits are AZN analogues: 21-70-166 (1.1 nM), 32-158-166 (1.3 nM), 160-70-166 (1.6 nM), 21-158-166 (1.7 nM) 164-158-166 (1.8 nM).
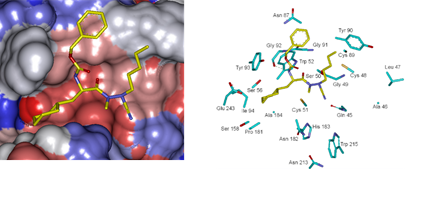
Figure 7 displays the 3D interaction depiction of the best designed AZNA 21-70-166 at FP3 active site (right). The Connolly surface of the active site (left) shows the conserved pentyl (P1) and the P3 benzyloxy of the AZN 5. The cyclohexyl substituted to the benzene ring in P2 resulted in a high increase of potency due to a better filling of the lipophilic S2 pocket and a stabilizing subsequent hydrophobic contact. This structural information is confirmed by the reported experimental results on FP2 and FP3 pyrimidinecarbonitrile inhibitors [52] attesting the quality of the FP3 inhibition PH4 and its ability identify novel FP3 inhibitors.
Figure 7. (Left): Connolly surface of the active site of Pf FP-3 with bound predicted most active AZN inhibitor 21-70-166. The binding site surface is colored according to residue hydrophobicity: red - hydrophobic, blue - hydrophilic and white - intermediate. (Right): Close up of the best virtual hit 21-70-166 at the active site of FP-3. Carbon atoms of interacting residues’s side chains are colored light green and those of ligand are shown in yellow color.
See figure in figures and tables below
Table 10. Predicted ADME-related properties of the best designed AZN analogues and known anti-malaria agents either in clinical use or currently undergoing clinical testing, as computed by QikProp [42].
Structural information from the crystal structure of FP3-K11017 complex guided us during elaboration of reliable QSAR models of non-covalent inhibition of the FP3 of P. falciparum by azadipeptide nitrile (AZN) inhibitors, which correlated computed Gibbs free energies of complex formation with observed inhibitory potencies [12]. In addition to this QSAR model, we have derived a 3D QSAR pharmacophore models for AZN inhibitors. Analysis of interactions between the FP3 and AZNs in the enzyme active site directed us in our effort to design an initial diversity virtual combinatorial library of new AZN analogues with multiple substitutions. The design strategy was based predominantly on the presence of the hydrophobic features included in the best PH4 pharmacophore models at the P1 to P3 positions of AZNs. The focused library filtered by a set of ADME-related descriptors and screened by matching of the analogues to the PH4 pharmacophore permitted selection of a library subset of orally bioavailable AZN. The subset of 78 best virtual hits was submitted to GFE computation of predicted inhibitory potencies by the complexation QSAR model derived from the training set. The best analogues reached predicted activities in the low nanomolar concentration range. The best designed AZN analogues, 21-70-166 (1.1 nM), 32-158-166 (1.3 nM), 160-70-166 (1.6 nM), 21-158-166 (1.7 nM) 164-158-166 (1.8 nM), Table 10, are recommended for synthesis and subsequent activity evaluation in FP3 inhibition assays and may lead to a discovery of novel potent orally bioavailable antimalarial. Usually the investigations of the active site of an enzyme start with the analysis its interactions with peptides inhibitors for identification of the best pharmacophore features which will guide the subsequent design and synthesis of peptidomimetic and non peptidic inhibitors [53]. The same approach, initiated by the reported AZN potencies [12], successfully provided in this work helpful information particularly for P1 and P2 position despite the small level of diversity of the training set. On the whole for FP3, the structural information provided by the PH4 especially the coordinates of the “pocket centered” hydrophobic features will be of crucial help for the design of non-peptide inhibitors. The report of a FP3-AZN complex crystal structure for one of the AZN best analogues we suggested for synthesis or three more AZN experimental evaluation with substitutions at P3 will help in the assessment to valuable additional structural information at the level of the one we obtained here from P2 with our model. In this way we’ll afford better orientation to the design of non peptidic falcipains inhibitors. Moreover our PH4 is in improvement in order to reach the selectivity over human cysteine proteases; we’ll report the results in due course.
This work was also supported by the Slovak Research and Development Agency grants APVV-14-0294 and APVV-14-0113"
Fischer, S., Smith, J. C., & Verma, C. S. (2001). Dissecting the Vibrational Entropy Change on Protein/Ligand Binding:? Burial of a Water Molecule in Bovine Pancreatic Trypsin Inhibitor. The Journal of Physical Chemistry B, 105(33), 8050-8055. doi: 10.1021/jp0120920.
View ArticleCopeland, R. A., Lombardo, D., Giannaras, J., & Decicco, C. P. (1995). Estimating KI values for tight binding inhibitors from dose-response plots. Bioorganic & Medicinal Chemistry Letters, 5(17), 1947-1952. doi: 00330-V. https://doi.org/10.1016/0960-894X(95)00330-V
View ArticleFrecer, V., & Miertu?, S. (1992). Polarizable continuum model of solvation for biopolymers. International Journal of Quantum Chemistry, 42(5), 1449-1468. doi: 10.1002/qua.560420520.
View ArticleMiertu?, S., Scrocco, E., & Tomasi, J. (1981). Electrostatic interaction of a solute with a continuum. A direct utilizaion of AB initio molecular potentials for the prevision of solvent effects. Chemical Physics, 55(1), 117-129. doi: 85090-2. https://doi.org/10.1016/0301-0104(81)85090-2
View ArticleB?ttcher, C. J. F. (1973). HISTORICAL INTRODUCTION Theory of Electric Polarization (Second Edition) (pp. 1-8). Amsterdam: Elsevier.
Gilson, M. K., & Honig, B. (1991). The inclusion of electrostatic hydration energies in molecular mechanics calculations. J Comput Aided Mol Des, 5(1), 5-20. PMid:2072125
View Article PubMed/NCBIRocchia, W., Sridharan, S., Nicholls, A., Alexov, E., Chiabrera, A., & Honig, B. (2002). Rapid grid-based construction of the molecular surface and the use of induced surface charge to calculate reaction field energies: applications to the molecular systems and geometric objects. J Comput Chem, 23(1), 128-137. doi: 10.1002/jcc.1161.
View ArticleAccelrys. (2009). Discovery Studio Modeling Environment (Version 2.5).
Maple, J. R., Hwang, M. J., Stockfisch, T. P., Dinur, U., Waldman, M., Ewig, C. S., & Hagler, A. T. (1994). Derivation of class II force fields. I. Methodology and quantum force field for the alkyl functional group and alkane molecules. Journal of Computational Chemistry, 15(2), 162-182. doi: 10.1002/jcc.540150207.
View ArticleKouassi, A. F., Kone, M., Keita, M., Esmel, A., Megnassan, E., N'Guessan, Y. T., Miertus, S. (2015). Computer-Aided Design of Orally Bioavailable Pyrrolidine Carboxamide Inhibitors of Enoyl-Acyl Carrier Protein Reductase of Mycobacterium tuberculosis with Favorable Pharmacokinetic Profiles. Int J Mol Sci, 16(12), 29744-29771. doi: 10.3390/ijms161226196.
View ArticleOwono?Owono, L. C., Ntie-Kang, F., Keita, M., Megnassan, E., Frecer, V., & Miertus, S. (2015). Virtually Designed Triclosan-Based Inhibitors of Enoyl-Acyl Carrier Protein Reductase of Mycobacterium tuberculosis and of Plasmodium falciparum. Molecular Informatics, 34(5), 292-307. doi: 10.1002/minf.201400141.
View ArticleKeita, M., Kumar, A., Dali, B., Megnassan, E., Siddiqi, M. I., Frecer, V., & Miertus, S. (2014). Quantitative structure-activity relationships and design of thymine-like inhibitors of thymidine monophosphate kinase of Mycobacterium tuberculosis with favourable pharmacokinetic profiles. RSC Advances, 4(99), 55853-55866. doi: 10.1039/C4RA06917J.
View ArticleMegnassan, E., Keita, M., Bieri, C., Esmel, A., Frecer, V., & Miertus, S. (2012). Design of novel dihydroxynaphthoic acid inhibitors of Plasmodium falciparum lactate dehydrogenase. Med Chem, 8(5), 970-984. PMid:22741776
View Article PubMed/NCBIDali, B., Keita, M., Megnassan, E., Frecer, V., & Miertus, S. (2012). Insight into selectivity of peptidomimetic inhibitors with modified statine core for plasmepsin II of Plasmodium falciparum over human cathepsin D. Chem Biol Drug Des, 79(4), 411-430. doi: 10.1111/j.1747-0285.2011.01276.x.
View ArticleFrecer, V., Berti, F., Benedetti, F., & Miertus, S. (2008). Design of peptidomimetic inhibitors of aspartic protease of HIV-1 containing -Phe Psi Pro- core and displaying favourable ADME-related properties. J Mol Graph Model, 27(3), 376-387. doi: 10.1016/j.jmgm.2008.06.006.
View ArticleFrecer, V., & Miertus, S. (2002). Interactions of ligands with macromolecules: Rational design of specific inhibitors of aspartic protease of HIV-1. Macromolecular Chemistry and Physics, 203(10-11), 1650-1657. doi: 10.1002/1521-3935(200207)203:10/11<1650::AID-MACP1650>3.0.CO;2-E 203:10/11<1650::AID-MACP1650>3.0.CO;2-E
View ArticleFrecer, V., Miertus, S., Tossi, A., & Romeo, D. (1998). Rational design of inhibitors for drug-resistant HIV-1 aspartic protease mutants. Drug Des Discov, 15(4), 211-231. PMid:10546067
PubMed/NCBIOwono Owono, L. C., Keita, M., Megnassan, E., Frecer, V., & Miertus, S. (2013). Design of Thymidine Analogues Targeting Thymidilate Kinase of Mycobacterium tuberculosis. Tuberculosis Research and Treatment, 2013, 670836. doi: 10.1155/2013/670836.
View ArticleAccelrys. (2005). Insight-II and discover molecular modeling and simulation package (Version 2005). New York: Accelrys.
Lin, S.-K. (2000). Pharmacophore Perception, Development and Use in Drug Design. Edited by Osman F. G?ner. Molecules, 5(7). doi: 10.3390/50700987.
View ArticleBerman, H. M., Westbrook, J., Feng, Z., Gilliland, G., Bhat, T. N., Weissig, H., Bourne, P. E. (2000). The Protein Data Bank. Nucleic Acids Res, 28(1), 235-242. PMid:10592235
View Article PubMed/NCBIL?ser, R.; Schilling, K.; Dimmig, E.; G?tschow, M. J. Med. Chem. 2005, 48, 7688. PMid:16302809
View Article PubMed/NCBIWard, Y. D.; Thomson, D. S.; Frye, L. L.; Cywin, C. L.; Morwick, T.; Emmanuel, M. J.; Zindell, R.; McNeil, D.; Bekkali, Y.; Girardot, M.; Hrapchak, M.; DeTuri, M.; Crane, K.; White, D.; Pav, S.; Wang, Y.; Hao, M.-H.; Grygon, C. A.; Labadia, M. E.; Freeman, D. M.; Davidson, W.; Hopkins, J. L.; Brown, M. L.; Spero, D. M. J. Med. Chem. 2002, 45, 5471. PMid:12459015
View Article PubMed/NCBIMoon, J. B.; Coleman, R. S.; Hanzlik, R.-P. J. Am. Chem. Soc. 1986, 108, 1350.
View ArticleWang, S. X., Pandey, K. C., Somoza, J. R., Sijwali, P. S., Kortemme, T., Brinen, L. S., McKerrow, J. H. (2006). Structural basis for unique mechanisms of folding and hemoglobin binding by a malarial protease. Proc Natl Acad Sci U S A, 103(31), 11503-11508. doi: 10.1073/pnas.0600489103.
View ArticleKerr, I. D., Lee, J. H., Farady, C. J., Marion, R., Rickert, M., Sajid, M., Brinen, L. S. (2009). Vinyl Sulfones as Antiparasitic Agents and a Structural Basis for Drug Design. Journal of Biological Chemistry, 284(38), 25697-25703. PMid:19620707
View Article PubMed/NCBIHansen, G., Heitmann, A., Witt, T., Li, H., Jiang, H., Shen, X., Hilgenfeld, R. (2011). Structural Basis for the Regulation of Cysteine-Protease Activity by a New Class of Protease Inhibitors in Plasmodium. Structure, 19(7), 919-929.
View ArticleHogg, T., Nagarajan, K., Herzberg, S., Chen, L., Shen, X., Jiang, H., Schmidt, C. L. (2006). Structural and functional characterization of Falcipain-2, a hemoglobinase from the malarial parasite Plasmodium falciparum. J Biol Chem, 281(35), 25425-25437. doi: 10.1074/jbc.M603776200.
View ArticleL?ser, R., Gut, J., Rosenthal, P. J., Frizler, M., G?tschow, M., & Andrews, K. T. (2010). Antimalarial activity of azadipeptide nitriles. Bioorganic & Medicinal Chemistry Letters, 20(1), 252-255. doi: . https://doi.org/10.1016/j.bmcl.2009.10.122
View ArticleVerissimo, E., Berry, N., Gibbons, P., Cristiano, M. L. S., Rosenthal, P. J., Gut, J., O'Neill, P. M. (2008). Design and synthesis of novel 2-pyridone peptidomimetic falcipain 2/3 inhibitors. Bioorganic & Medicinal Chemistry Letters, 18(14), 4210-4214. .
View ArticleTeixeira, C., Gomes, J. R., & Gomes, P. (2011). Falcipains, Plasmodium falciparum cysteine proteases as key drug targets against malaria. Curr Med Chem, 18(10), 1555-1572. PMid:21428877
View Article PubMed/NCBIKesharwani, R. K., Singh, D. V., & Misra, K. (2013). Computation-based virtual screening for designing novel antimalarial drugs by targeting falcipain-III: a structure-based drug designing approach. J Vector Borne Dis, 50(2), 93-102. PMid:23995310
PubMed/NCBIBoris, D. B., Fidele, N.-K., Luc, C. O. O., & Eugene, M. (2016). Targeting Cysteine Proteases from Plasmodium falciparum: A General Overview, Rational Drug Design and Computational Approaches for Drug Discovery. Current Drug Targets, 17, 1-26. doi: .
View ArticleKolla, V. K., Prasad, R., Sayyad, Z., Atul, Shah, A. Y., Allanki, A. D., Sijwali, P. S. (2015). Independent amino acid residues in the S2 pocket of falcipain-3 determine its specificity for P2 residues in substrates. Molecular and Biochemical Parasitology, 202(2), 11-22. doi: .
View ArticlePerez, B., Teixeira, C., Gomes, J. R. B., & Gomes, P. (2013). Development of Plasmodium falciparum Protease Inhibitors in the Past Decade (2002?2012). Current Medicinal Chemistry, 20(25), 3049-3068. doi: . https://doi.org/10.2174/0929867311320250003
View ArticleKiso, A., Hidaka, K., Kimura, T., Hayashi, Y., Nezami, A., Freire, E., & Kiso, Y. (2004). Search for substrate-based inhibitors fitting the S2? space of malarial aspartic protease plasmepsin II. Journal of Peptide Science, 10(11), 641-647. doi: 10.1002/psc.609.
View ArticleO'Neill, H. G., Mzilahowa, T., de Deus, N., Njenga, S. M., Mmbaga, E. J., & Kariuki, T. M. (2013). Evaluation of the European Foundation Initiative into African Research in Neglected Tropical Diseases by the African Fellows. PLOS Neglected Tropical Diseases, 7(3), e2019. doi: 10.1371/journal.pntd.0002019.
View ArticleO'Brien, C., Henrich, P.P., Passi, N., and Fidock, D.A. (2011). Recent clinical and molecular insights into emerging artemisinin resistance in Plasmodium falciparum. Curr Opin Infect Dis. 24, 570-577. DOI: 10.1097/QCO.0b013e32834cd3ed.
View ArticleMillennium development Goals,
View ArticleWongsrichanalai, C., & Meshnick, S. R. (2008). Declining Artesunate-Mefloquine Efficacy against Falciparum Malaria on the Cambodia?Thailand Border. Emerging Infectious Diseases, 14(5), 716-719. doi: 10.3201/eid1405.071601.
View ArticleSchwarzl, S. M., Tschopp, T. B., Smith, J. C., & Fischer, S. (2002). Can the calculation of ligand binding free energies be improved with continuum solvent electrostatics and an ideal-gas entropy correction? J Comput Chem, 23(12), 1143-1149. doi: 10.1002/jcc.10112.
View ArticleSchrodinger. (2014). QikProp (Version 3.7, release 14). New York: Schrodinger.
Duffy, E. M., & Jorgensen, W. L. (2000). Prediction of Properties from Simulations:? Free Energies of Solvation in Hexadecane, Octanol, and Water. Journal of the American Chemical Society, 122(12), 2878-2888. doi: 10.1021/ja993663t.
View ArticleJorgensen, W. L., & Duffy, E. M. (2000). Prediction of drug solubility from Monte Carlo simulations. Bioorg Med Chem Lett, 10(11), 1155-1158. 00172-4
View ArticleJorgensen, W. L., & Duffy, E. M. (2002). Prediction of drug solubility from structure. Adv Drug Deliv Rev, 54(3), 355-366. 00008-X
View ArticleChemical Computing Group. (2014). Molecular Operating Environment (MOE) (Version 2014). Available Chemicals Directory, Version 95.1, MDL Information Systems, San Leandro, CA.
Dean, P. M. (1994). Molecular simylarity in drug Design: Springer.
Freire E (2008) Do enthalpy and entropy distinguish first in class from best in class? Drug discovery today. 13(19-20):869-874. PMid:18703160
View Article PubMed/NCBIShah, F., Gut, J., Legac, J., Shivakumar, D., Sherman, W., Rosenthal, P. J., & Avery, M. A. (2012). Computer-Aided Drug Design of Falcipain Inhibitors: Virtual Screening, Structure?Activity Relationships, Hydration Site Thermodynamics, and Reactivity Analysis. Journal of Chemical Information and Modeling, 52(3), 696-710. doi: 10.1021/ci2005516.
View ArticleLipinski, C. A., Lombardo, F., Dominy, B. W., & Feeney, P. J. (2001). Experimental and computational approaches to estimate solubility and permeability in drug discovery and development settings. Advanced Drug Delivery Reviews, 46(1?3), 3-26. doi: 00129-0. https://doi.org/10.1016/S0169-409X(00)00129-0
View ArticleCotereon JM, Catterick D, Castro J, et al. (2010), Falcipain Inhibitors: Optimization Studies of the 2-Pyrimidinecarbonitrile Lead Series. J Med Chem. 53, 6129?6152. PMid:20672841
View Article PubMed/NCBIFrecer V, Kabelac M, De Nardi P, et al. (2004), Structure-based design of inhibitors of NS3 serine protease of hepatitis C virus. J Mol Graph Mod. 22(3):209-220. 00161-X
View Article