Fidelis Ankwo Abija
Email: fidelabija@yahoo.co.uk
© 2019 Sift Desk Journals. All Rights Reserved
VOLUME: 4 ISSUE: 6
Page No: 774-788
Fidelis Ankwo Abija
Email: fidelabija@yahoo.co.uk
Fidelis A. Abija1,3, Joseph I. Nwosu2, Abimbola I. Ifedotun1,3 and Chuka C. Osadebe4
1.Centre for Geomechanics, Energy and Environmental Sustainability, Port Harcourt, Nigeria.
2.Department of Geology, University of Port Harcourt, Nigeria.
3.Institute of Geosciences and Space Technology, Rivers State University, Port Harcourt, Nigeria.
4.Nigerian Building and Roads Research Institute, Ota, Nigeria.
Heping Shu(shuhp15@lzu.edu.cn)
Wuwei Mao(maowuwei@tongji.edu.cn)
Tao Zhang(zhangtao_seu@163.com)
Jinzhong Liu(jzliu89@hhu.edu.cn)
Fidelis Ankwo Abija, Landslide susceptibility assessment of Calabar, Nigeria using Geotechnical, Remote Sensing and Multi-Criteria Decision Analysis: Implications for urban planning and development(2019)Journal of Earth Sciences & Environmental Studies 4(6)
This research was carried out to delineate zones of high likelihood of landslide occurrence in view of the fatal incidence of September 2013 that buried a building and 9 occupants in the city area of Edim Otop. Method involved field geotechnical boring and laboratory analysis; remote sensing analysis of SRTM-(DEM) and Landsat ETM imageries to extract slope and aspect; land use land cover, drainage and normalized vegetation index. The zonation of landslide susceptible areas was implemented using analytic hierarchy process (AHP) in a multi criteria decision analysis of factors important in landslide occurrence. Results of the AHP depicts that the ground slope contributes 32% to the likelihood of landslide occurrence, while the orientation of the slope (aspect), soil type, cohesion, friction angle, hydraulic conductivity, drainage, land use land cover and normalized vegetation index’s causative abilities to slope instability, failure and landslide susceptibility were 22%, 16%, 9%, 7%, 6%, 3%, 3%, and 2% respectively. Three landslide susceptibility zones of low, high and very high landslide susceptibility have been delineated. The ten deep gully sites sampled during the field studies all fall under the zone of very high land slide susceptibility including Edim Otop, the site of the September 2013 fatal rainfall induced incidence. Recommendations for management include risk and hazard quantification considering human occupation on very high landslide susceptibility areas, slope protection methods including excavated sections, use of sites of previous landslide such as Edim Otop as pilot projects to characterize the mechanism of slope instability and back analysis of slope failure as reference.
Keywords: Soil cohesion, friction, soil slope and slope direction, remote sensing, landslide, Calabar.
Landslide is sudden and rapid mass movement of geological materials downslope of an area under the gravitational pull of the earth. It is often a result of the earth’s instability and failure along a clearly defined surface or plane (Montgomery; 2006). The tendency of slope instability, failure and movement can vary in magnitude and origin and may range from near surface disturbances of weathered zones to deep seated displacements of large rock and or soil masses (Blyth and de Freitas; 1984).
Slope instability and or failure; and the attendant sliding occur when the frictional resistance of the earth’s materials (soils and rocks) is overcome by the disturbing forces or moments (shear stress) which attain magnitudes exceeding the shear strength of the materials (Murthy, 2014 ; ). Failure and sliding occurs when the stress exceeds the mobilized shear strength reducing the factor of safety to less than unity (Oborie and Abija; 2019).
In the prognosis for landslide and its risks, it is very important to determine the causal factors of landslide as recognized by (Reddy; 2007). These include (1) shear failure on existing geological structure (2) strength reduction and shear failure of soil and or rock (3) creep, and (4) detachment of soil and or rock and their combination is such that all the factors that tend to increase the shear stress, decrease the resisting forces (shear strength) thus increasing the likelihood of failure and sliding.
The sliding tendency is influenced by groundwater and its effects on shear strength reduction, porewater pressure, and the magnitude of the effective in situ stresses (Blyth and de Freitas; 1984). The rapid addition of moisture and the degree of saturation of the earth materials trigger landslide occurrence. The rate of rainfall infiltration varies directly with the hydraulic conductivity and water infiltration has been identified to reduce suction and strength, weakening the slope (Crosta and Frattini; 2008, Igwe and Fukuoka; 2014).
Most mass wasting in Nigeria are triggered after heavy precipitation (Igwe; 2015) and also facilitated by erosion of the ground surface above the slope. Ige et al; (2016) maintains that landslide remains one the most ravaging natural disasters in Nigeria that constitute a major threat to life and the environment and requires risk assessment. Susceptibility assessment of landslide identifies and categorizes the region into zones of different susceptibility tendencies in order to guide management of the risk (Nsengiyumva et al; 2017).
Landslide susceptibility studies often employ geotechnical and hydrogeological approaches relying on static test conducted in situ or on results of laboratory analysis on geological materials sampled from the affected areas through back analysis. Nilsen et al. (1979) attempted characterizing and zoning landslide susceptible zones based on qualitative overlaying of geological and morphological slope attributes in a map format.
The use of remotely sensed imagery data has been widely applied due its synoptic coverage of regions under assessment. Abija et al; (2019) noted that the engineering geologic applications of remote sensing include landslide risk prediction and excavation stability design which are very well entrenched. Other geological applications are in tectonics, morphometric analysis of geomorphology, groundwater and natural resources exploration (Koopmans; 1986; Kar; 1994; Philip; 1996).
The use of maps in decision making process was introduced by McHarg; (1969) and developed in GIS by Charlton and Ellis; (1991). When integrated with GIS, decision support systems provide better solutions to not well defined spatial problems. Remote sensing and GIS provide an ideal environment for integrated studies due to its ability to manage large volumes of spatial data from a variety of sources. It efficiently stores, retrieves, analyzes and displays information according to user defined specifications. Researchers such as Reddy; (2006), Khan et al.; (2019), Hong et al.;(2015), He et al; (2019) and Nsengiyumva et al; (2017) adopted remote sensing methods in landslide hazard and terrain evaluation and produced maps of landslide risk areas implementing methods such as frequency ratio, analytic hierarchy process and multi criteria analysis in different parts of the world.
Most parts of the study area have been ravaged by erosion with deep gullies as wide as 10m and as deep as 8m in places. Research has shown that the gully sites are made of soils which are mostly sands and silts lacking in cohesion and facilitating erosion (Ohon et al; 2011). Amah et al; (2008) adopted hydrogeological and geotechnical approach and submitted that erosion and landslide pose a serious threat to humans, agriculture, infrastructure and socio-economic activities in the study area.
On the 4th of September 2013, a rainfall induced landslide occurred in Edim Otop area of Calabar burying a building and nine (9) occupants. Local slope instabilities are also visible in different locations across the city.
This study integrates geotechnical and remote sensing derived geospatial data into a multicriteria decision support system analysis. It evaluates the dependence relationships and relative importance of the factors responsible for slope failure and landslide in the area with the aim of producing a map of landslide susceptible zones and their relative likelihoods for use as a tool for urban planning and development.
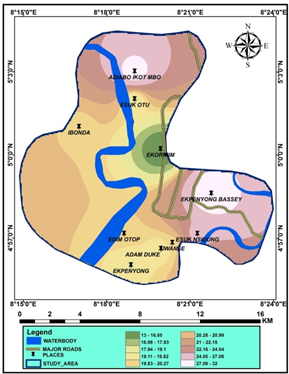
Calabar was Nigeria’s first Federal capital and is very well developed with a population projection exceeding 580,000 based on 2006 census figures (Figure 1). It has an area of 406km2 and located between latitudes 040 56’’N and 050 4’’N and longitudes 080 15’’E and 080 24’’E. The climate is tropical equatorial with sunshine being high throughout the year and maximum between January and May while minimum occurs in July and September. Temperatures range, on average, between 26 and 27 ℃ during the dry months of February to March; and about 24 ℃ during wet months of June and September. Daily temperatures oscillate between 31. 7 ℃ and 23 ℃ in dry season highest average values of humidity reach 90 in August as against an average minimum of 74 % in February. Rainfall is most intense (>3500 mm) between April and October, the values being 5 - 7 times higher than in November to March (500 mm) (Abija, 2019; Adefolalu; 1981). The heavy rainfall tends to accelerate runoff volume and rate thereby resulting in flooding and environmental degradation in the city. The study area is adjacent to the Great Kwa and Calabar Rivers and creeks of the Cross River.
2. STUDY AREA
2.1. Geologic and Geotectonic Setting
The geology of and geotectonic setting of the study area is same as that of the Niger Delta and Benue trough, Nigeria. The Calabar flank is a hinge line bordering the East-South-East limit of the Niger Delta basin. Tectonically, Cretaceous fracture zones during the triple junction rifting and opening of the south Atlantic controlled basin evolution and the palaeo-indicators include trenches and ridges in the deep Atlantic (Abija, 2019). These fracture zone ridges subdivide the margin into individual basins and forms the boundary faults of the Cretaceous Benue - Abakaliki trough that cuts far into the West African shield. The Benue trough, an aulacogen of the triple junction rift system started opening in the Late Jurassic and persisted into the Middle Cretaceous (Lehner and De Ruiter, 1977) and diminished in the Niger delta in the Late Cretaceous. According to Abija et al; (2018), the Niger Delta basin evolved through triple junction rifting, opening of the continent and extension of the fracture zones into the Gulf of Guinea during the Cretaceous. The development of the Niger Delta resulted from the formation of the Benue trough as a failed arm of a rift triple junction associated with the separation of the African and South American continent and subsequent opening of the South Atlantic (Evamy et al., 1978).
Most parts of Calabar are overlain by a veneer of consolidated and unconsolidated coastal plain sands of the Benin Formation which overlies the Nkporo shale (Edet and Nyong; 1993). These Pleistocene continental sands, sandstones and gravels are friable and of fresh water origin forming excellent aquifer properties with occasional intercalation of shales. The Benin Formation forms the regional aquifer of the Niger Delta basin and it grade into various types of quaternary alluvial deposits comprising mainly of recent deltaic sands on the surface (Etu-Efeotor and Akpokodje; 1990; Abam; 2016; Abija and Abam; 2018)
Adjoining Calabar to the north, are the Calabar Flank, a Cretaceous sedimentary unit and the Precambrian basement complex of the Oban massif.
The coastal pain sands of the Benin Formation are overlain by Quaternary deposits of about 40-50 m thick. Hydrogeologically, the main water-bearing unit in the area is the coastal plain sand aquifer of the Benin Formation. It is composed of unconsolidated and loose sediments; predominantly gravel, sand, silt and clay of Tertiary to recent age. The sands comprising of medium - coarse grained, moderately sorted, subangular to subrounded grains constitute more than 80% of the aquifer materials. The Benin Formation in Calabar area has been divided into two major water bearing units: the upper gravelly and the lower sandy groundwater aquifers. The upper aquifer has mean thickness of 52.7m and average static water level of about 35.0m. The static water level varies from as low as 22.10 to 68.80 m during the wet season. Groundwater table elevation varies from 10m to 50m in the central part. The regional groundwater flow is in the north/south with divide at central parts of Calabar area (Edet and Okereke; 2002). Present day tectonic activities are dominated by the NE – SW Ifewara – Zungeru complex fault system that cuts across the metamorphic basement complex and the younger sedimentary rocks of Nigeria.
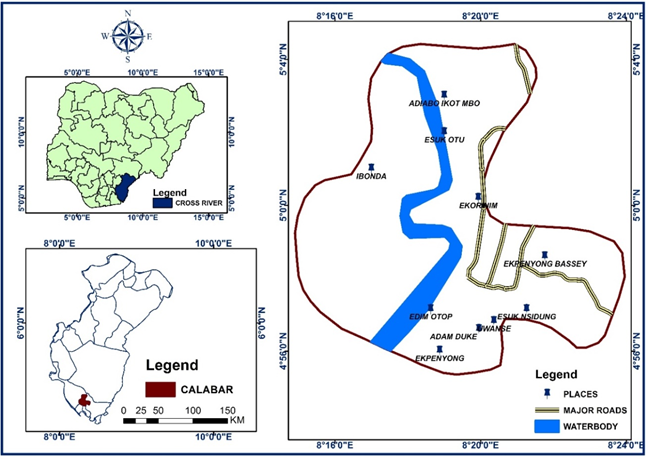
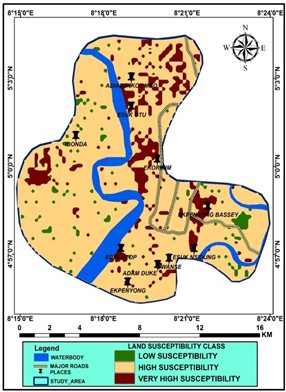
Figure 1: Map of the study area showing deep gully locations (places)
3.1. Field Geotechnical and laboratory Methods
Field methods involved site reconnaissance, identification of erosion channels and geotechnical boring of ten numbers boreholes and sampling. Soils samples were analyzed for identification, classification and strength properties and laboratory analysis was carried out in accordance with the BS 1377 (1990) and ASTM standards. Summary of results are presented in table 1 and details interpolated to produce spatial distribution maps of the study area.
3.2. Remote Sensing
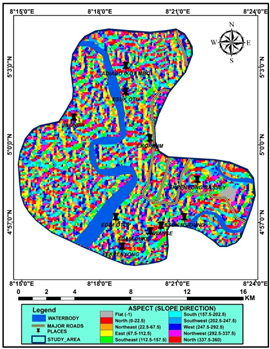
Remote sensing methods involved acquisition of LANDSAT-7 Enhanced Thematic Mapper imageries from the earth explorer website and digital elevation model raster maps from the Shuttle Radar Topographic Mission (SRTM). Image processing of Landsat-7 ETM evaluating the false colour composites was carried combining bands 4,3, and 2 in the analysis to produce land use land cover map of the area. The drainage pattern of the area was extracted from the digital elevation model raster map while the normalized vegetation index was determined by measuring the difference between near-infrared (band 4) which vegetation strongly reflects and red light (band 3) which vegetation absorbs. Analysis and results were done in ArcGIS software producing thematic maps of the parameters. The processing of the SRTM digital elevation model raster map to extract the slope angles was done with ARCGIS and Rockworks software. Slope refers to the measure of the rate of change of elevation at a surface location and normally expressed in percent or degree slope. The slope map was generated from the digital elevation model (DEM) dataset. Surface topography is a major and one of the most important factors in site selection, structural integrity and flow of water. The aspect map of the area was extracted from the projected digital elevation model of the study area with a resolution of 3m using spatial analyst geo-processing operation in ArcGIS 10.5.
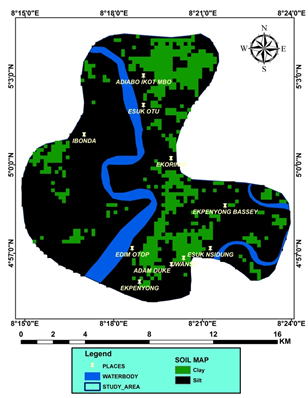
Material composition was ranked next in its contribution to failure and slide tendency. Information on soil types was obtained from the Nigeria Geological Survey Agency’s soil map. The map was overlaid on the Cross River State Administrative map to clip out Cross River state soil map. The soil’s map was further digitized to obtain the soil layers of the study area in a vector format. All the results were interpolated as spatial maps of the study area.
3.3. Multi-criteria Decision Analysis
Multicriteria decision analysis method combines and transforms input geographical data into an output spatial format as a decision support tool. It involves the definition of the problem, objectives and the selection of attributes for the evaluation. The method, analysis takes advantage of geographic information system’s capability to manage and process large volumes of spatial data. GIS was used to evaluate the entire study area based on the selected attributes according to the local characteristics of the area. Imageries were processed and classified following the methodology outlined in the workflow (Figure 2).
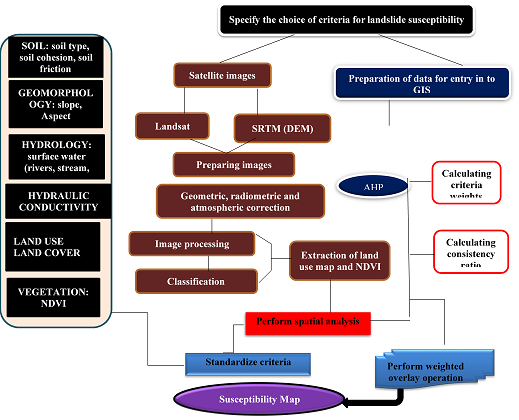
Figure 2: Methodology flow chart for Analytic Hierarchy Process analysis
Analytic hierarchy process (AHP) method of multicriteria decision analysis was adopted because of its wide applicability in urban planning, architectural, environmental, geotechnical and strategic policies fields (De Montis et al; 2000; Altuzarra et al.; 2007; Cheng et al; 2005; De Felice et al; 2015; and Saaty, 1980). Method involved a review of the causal factors of slope instability and landslide triggering mechanisms in engineering and environmental geoscience, civil and mining engineering; establishment of their relative importance through a pairwise comparison scale.
In pairwise comparisons, a ratio scale of 1–9 is used to compare any two factors. The relative importance of each causal factor with respect to the others is identified in order to find the level of contribution of each attribute to the achievement of its related weight assessment. Relative judgments are then made on pairs of the criteria. The smaller factor is used as the unit while the larger one becomes a multiple of that unit. The soil type, its cohesive strength, friction angle and hydraulic conductivity (geotechnical parameters) as well as terrain properties (ground slope and slope aspect) obtained from analysis of remote sensing digital elevation models; drainage (hydrometeorological factor), land use land cover representing anthropogenic influence and normalized vegetation index (NDVI) of the study area were used as criteria for the analysis.
Slope angle is a major factor in slope instability and landslide as higher slope angle equate to higher shear stress and greater tendency for failure. Whether cohesionless or cohesive soils, if the topography is flat lying at zero degree slope angle, failure and slide cannot be initiated except in the presence of deep seated rock joints (fractures or faults). The influence of rock joints and the attendant mechanism of kinematic instability were not evaluated because no rocks were exposed on the ground surface. The slope direction (depicted by its aspect) relative to the direction of the failure plane or slip surface controls failure and slide and was ranked second in the pairwise comparison. The composition of the geological material overlying the slope was the next most important factor as it largely determines the angle of repose of a slope which varies with material. Unfractured rocks for example are most unlikely to fail irrespective of the slope angle. Montgomery, (2006) noted that smooth, rounded materials tend to support only low angle slopes. The cohesive strength and friction angle of these geological materials imparts the strength which must be mobilized to resist the shearing stresses acting to destabilize the slope. Water especially torrential rainfall has been identified as a major trigger to landslide. This is due to the hydraulic conductivity of the geological material which imparts on it the capacity to permit infiltration into the soils or rocks. High hydraulic conductivity implies high infiltration rate and increase amount of water in the slope materials. The proximity to rivers and streams in the drainage basin increases erosion and seepage into the slope materials. In the area, the proximity to the Calabar and Great Kwa rivers and dendritic stream dissecting the area has been considered seventh ranking factor in the pairwise comparison and selection of landslide triggering factors. Development on slopes as measured by the land use land cover is the major anthropogenic trigger to landslide. Road excavations on slopes lead to slope steepening; building construction increase the load on the already stressed slope and the watering of lawns, use of septic tanks and swimming pools further reduce the frictional strength and increases the shear stress. Vegetation’s effect act to strengthen the slope as the roots provide interlocking of the slope materials. Therefore de-vegetation for building construction promotes landslide likelihood in any region.
These factors have been determined, reclassified and parameterized based on the range of values of all their results. Reclassification is carried out because the input criteria layers (landslide causative factors) have different numbering systems and units with different ranges of values to combine them in a single analysis. Therefore, each cell for each criterion has to be reclassified into a common preference scale such as 1 to 9, with 9 being the most favorable. An assigned preference on the common scale implies the phenomenon's preference for the criterion and the preference values are on a relative scale. In the reclassification, care was taken to choose classes in order not to render the analytic hierarchy process insignificant by the effect of low range value parameters such soil type, soil friction angle and soil cohesion. The reclassification of the criteria was carried out using the Reclassify geo-processing tools in ArcGIS 10.5.
4.1. Geotechnical Characteristics
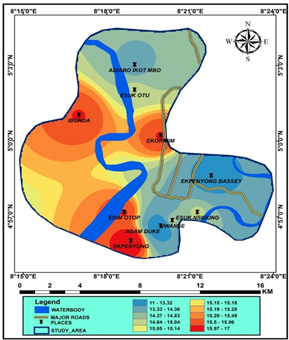
The soils in Calabar are coarse to medium silts and clays (Figure 3) (Nigeria soil’s map). However results of analysis from the 10 deep gully sites depicted medium to coarse silty materials with clay/silt ratio of 4.3 – 29.9.0%, silt sand content of 60 – 74% and gravel range of 2 – 8% overlying the slopes. Moisture content varies from 7.1 to 22.6%, Specific gravity from 2.6 to 2.7, bulk density from 2.02 to 3.54(g/m3), unit weight from 19.82 to 24.92(KN/m2). Soils cohesive strength ranges from 11.01 to 32.03(KN/m2) (Figure 4 and Table 1) while the angle of internal friction varies 11.0 to 18.0 degrees (Figure 5 and Table 1).
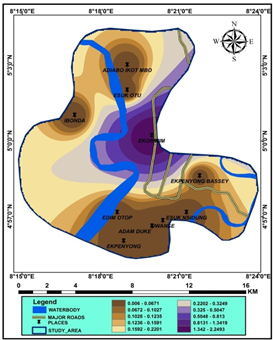
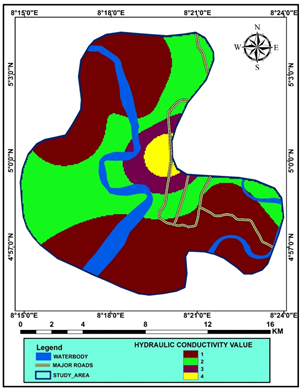
Consistency indices indicate the liquid limit to vary from 24.3 – 55.7%, the plastic limit from 9.8 – 31.8% while the plasticity index ranges from 14.5 – 23.9%. The soils hydraulic conductivity ranges from 0.006cm/sec to 2.25cm/sec (Figure 6 and Table 1)
Table 1: Summary of basic geotechnical properties
|
Geotechnical Property |
Minimum |
Maximum |
Mean |
|
Moisture Content (%) |
7.1 |
22.6 |
22.8 |
|
Specific Gravity, Gs |
2.6 |
2.7 |
2.64 |
|
Bulk Density (g/m3) |
2.02 |
3.54 |
2.97 |
|
Unit Weight (KN/m2) |
19.82 |
24.92 |
23.94 |
|
Liquid Limit % |
24.3 |
55.7 |
40.2 |
|
Plastic Limit % |
9.8 |
31.8 |
20.9 |
|
Plasticity Index % |
14.5 |
23.9 |
19.5 |
|
Cohesion (KN/m2) |
11.01 |
32.03 |
22.52 |
|
Friction Angle (0) |
11.0 |
18.0 |
14.25 |
|
Hydraulic Conductivity (cm/sec) |
0.006 |
2.25 |
1.253 |
|
% Clay/Silt |
4.3 |
29.9 |
27.7 |
|
% Sand |
60 |
74 |
66.1 |
|
% Gravel |
2 |
8 |
3 |
|
USCS classification |
SC |
SM |
SC |
4.2. Geospatial Terrain and Hydrometeorology parameters
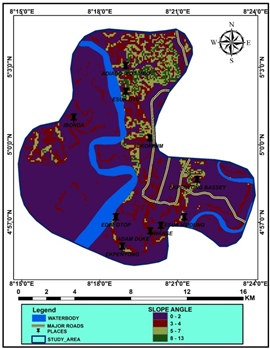
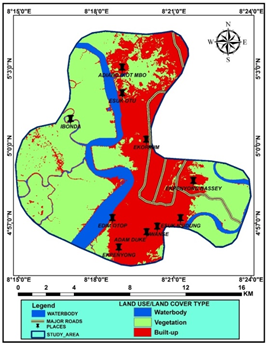
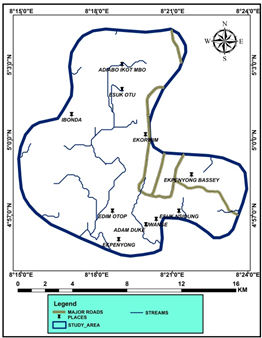
The ground surface slope varies from 0 – 13 degrees across the area with the sampled deep gully sites recording 3 – 8 degrees slope angles (Figure 7 and Table 2). High slope angles equate to greater shear stress and risk of landslide susceptibility. The slope orientations of the deep gully sites range from 112.5 – 360 degrees azimuth with dominant directions in the Northwest, Southeast, southwest, South and North (Figure 8 and Table 2). The land use land cover which is a measure of the built up areas with attendant increase in soils moisture content from such activities as watering of lawns, septic tanks, swimming pools and other activities such as car wash indicates that the deep gully sites are located in the built up areas of the city (Figure 9). The drainage system shows a dendritic stream pattern across the area with two major rivers, the Calabar and the Great Kwa Rivers on the west and east of the study area (Figure 10). The Great Kwa River forms the eastern drainage system while the Calabar River forms the western drainage system of the basin with different streams draining the built up areas along the slopes. Drainage is very important in landslide due to its influence on infiltration and recharge of the groundwater system.
Table 2: Ground surface slope angles and slope direction of deep gully sites in the study area
|
NAME |
X |
Y |
SLOPE DIP ANGLE (deg) |
SLOPE DIP DIRECTION |
SLOPE DIP DIRECTION ANGLE |
|
IBONDA |
8.2833 |
5.0167 |
4 |
SW |
202.5 – 247.5 |
|
ESUK OUT |
8.3167 |
5.0333 |
8 |
SW |
202.5 – 247.5 |
|
ADIABO IKOT MBO |
8.3167 |
5.0500 |
8 |
S |
157.5 – 202.5 |
|
ADAM DUKE |
8.3325 |
4.9434 |
3 |
SE |
112.5 – 157.5 |
|
ESUK NSIDUNG |
8.3544 |
4.9525 |
6 |
SE |
112.5 – 157.5 |
|
EKPENYONG |
8.3146 |
4.9335 |
5 |
SW |
202.5 – 247.5 |
|
EKPENYONG BASSEY |
8.3627 |
4.9766 |
9 |
N |
337.5 – 360 |
|
EKORINIM |
8.3322 |
5.0033 |
5 |
S |
157.5 – 202.5 |
|
UWANSE |
8.3394 |
4.9470 |
3 |
NW |
292.5 – 337.5 |
|
EDIM OTOP |
8.3104 |
4.9525 |
8 |
S |
157.5 – 202.5 |
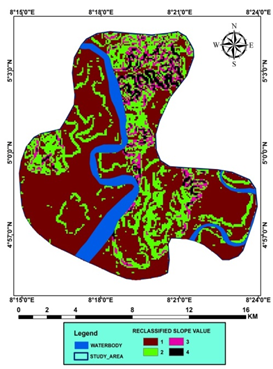
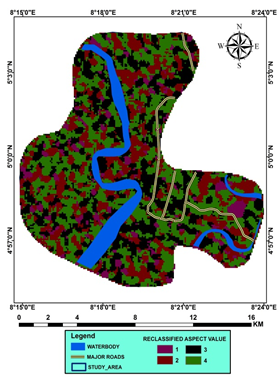
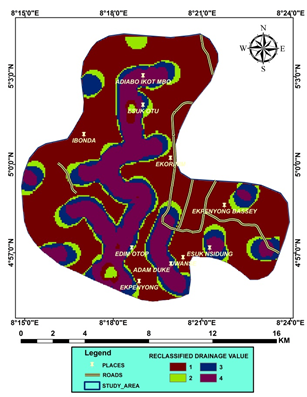
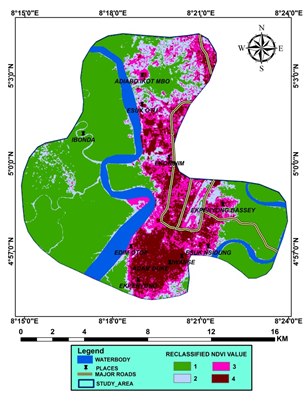
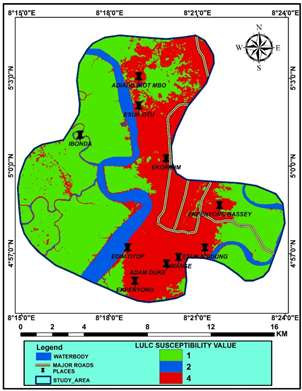
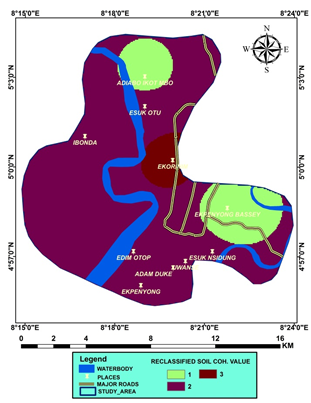
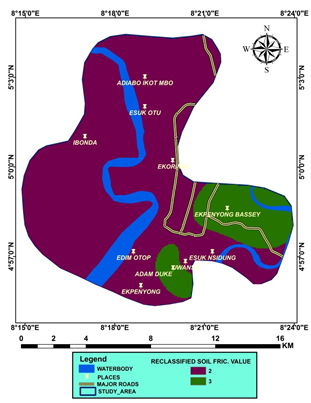
The slope angle was reclassified into four classes of very low (1), medium, high and very high (4) (Figure 11) while the slope direction reclassified into North West (1), Southwest (2), Southeast (3) and South (4) 1 being very low and 4 very high (Figure 12). The drainage, normalized vegetation index (NDVI) and soil’s hydraulic conductivity were equally reclassified into 1 – 4 (very low – very high) classes (Figures 13, 14 and 15 respectively); the land use land cover (Figure 16) and soil cohesion (Figure 17) were reclassified into 3 classes of low, medium and high while the soil type (Figure 18) and friction angle (19) were attributed 2 classes of low and high.
Weights for each class of criteria were derived using the Analytic Hierarchy Processes (AHP) in ArcGIS software integrated in the multi-criteria decision analysis. The AHP was applied in the selection process as a decision support mechanism in the organization of the criteria and alternative solutions thereby selecting landslide prone zones and susceptibility ranks in a hierarchical decision model (Eldrandly et al; 2005). Expert preferences for comparing the classes were used and a matrix of classified rating of the landslide causal factors populated with values from 1 to 9 and fractions from 1/9 to ½ representing the importance of one factor against another in the pair prepared (Table 1). The validity of the AHP is to the extent that the values in the matrix must be consistent. This implies that, if one parameter is compared to another, the parameter being compared receives a score of 5 (strong importance), while the index parameter should score 1/5 (little importance).
|
Figure 3: Spatial distribution of soil type |
Figure 4: Spatial variation of soil’s cohesive Strength (KN/m2) |
|
Figure 5: Spatial variation of soil friction angle (degrees) |
Figure 6: Spatial variation of soil’s hydraulic conductivity (cm/sec) |
|
Figure 7: Distribution of ground surface slope in the study area |
Figure 8: variation of slope direction in the study area |
|
Figure 9: Land use land cover distribution in the study area |
Figure 10: Drainage map showing stream distribution in the study area |
|
Figure 11: Reclassified slope angle |
Figure 12: Reclassified slope aspect map |
|
Figure 13: Reclassified drainage map |
Figure 14: Reclassified NDVI map |
|
Figure 15: Reclassified Hydraulic Conductivity map |
Figure 16: Reclassified land use land cover map |
|
Figure 17: Reclassified soil cohesion map |
Figure 18: Soil map |
|
Figure 19: Reclassified soil friction map |
Figure 20: Landslide susceptibility map |
Table 3: Results of Analytic Hierarchy Process judgment matrix for landslide multi criteria decision analysis
|
|
Slope |
Aspect |
Soil Type |
Cohesion |
Friction |
Hydraulic Conductivity |
Drainage |
LULC |
NDVI |
% Effect on Landslide Susceptibility |
|
Slope |
1 |
3 |
3 |
5 |
5 |
6 |
7 |
9 |
9 |
32.0 |
|
Aspect |
0.333 |
1 |
2 |
5 |
7 |
3 |
7 |
7 |
7 |
22.0 |
|
Soil Type |
0.333 |
0.5 |
1 |
3 |
5 |
3 |
5 |
7 |
9 |
16 |
|
Cohesion |
0.2 |
0.2 |
0.333 |
1 |
3 |
3 |
5 |
3 |
5 |
9 |
|
Friction |
0.2 |
0.143 |
0.2 |
0.333 |
1 |
3 |
5 |
3 |
5 |
7 |
|
Hydraulic Conductivity |
0.167 |
0.333 |
0.333 |
0.333 |
0.333 |
1 |
3 |
3 |
5 |
6 |
|
Drainage |
0.143 |
0.143 |
0.2 |
0.2 |
0.2 |
0.333 |
1 |
3 |
3 |
3 |
|
LULC |
0.111 |
0.143 |
0.143 |
0.333 |
0.333 |
0.333 |
0.333 |
1 |
2 |
3 |
|
NDVI |
0.111 |
0.143 |
0.111 |
0.2 |
0.2 |
0.2 |
0.333 |
0.5 |
1 |
2 |
|
Total |
|
100 |
||||||||
|
Consistency Ratio |
|
0.008 <0.1 |
||||||||
A parameter compared to itself gets the score of 1 (equal importance). The weights calculated from each column were summed and every element in the matrix was divided by the sum of the respective column. An average from the elements from each row of the normalized matrix was calculated. Consistency ratio (CR) was 0.008 (<0.1) and this ensures that the comparison of criteria made by decision makers was consistent satisfying the rule that a CR less than or equal to 0.10 signifies an acceptable reciprocal matrix, whereas greater than 0.10 is not acceptable and weights obtained by this method are interpreted as average of all possible weights.
The analytical hierarchy process results (Table 3) depicts that slope angle contributes 32% to the likelihood of landslide occurrence, while the orientation of the slope (aspect), soil type, cohesion, friction angle, hydraulic conductivity, drainage, land use land cover and normalized vegetation index’s causative abilities to slope instability, failure and landslide susceptibility were 22%, 16%, 9%, 7%, 6%, 3%, 3%, and 2% (Table 3) respectively.
The landslide susceptibility (Figure 20) classification of the study area into three zones of low, high and very high was the effect of slope, preponderance of silty materials and high hydraulic conductivity which impart some degree of instability during rainfall. Study therefore has zoned Calabar three zones of slope instability tendencies and susceptibility to landslide occurrence. It is noteworthy that the ten deep gully sites sampled during the field studies nd including Edim Otop, the site of the September 2013 fatal rainfall induced landslide fall under the zone of very high land slide susceptibility (Figure 20). Construction effects as depicted by the land use land cover on the high to very slopes coupled with the high to very high hydraulic conductivities of the low to medium strength slope materials under the forces of gravity which increase after rainfall thus reducing friction and the shear strength of the geological materials is accounts for the landslide susceptibility in the area. Moreso, the effect of vegetation which roots act to provide interlocking of soil particles has exacerbated the risk of landslide susceptibility in the area.
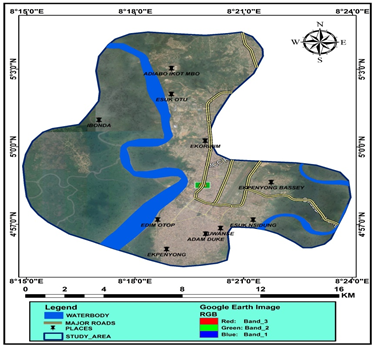
Figure 21: Google image of the study area showing built up area
4.4. Implications for Urban Planning and Development
Figure 21 is an image of the study area showing housing density with total disregard to slope geometry and without any geotechnical investigation to characterize the geological materials that constitute that foundation subgrades and slope stability analysis. Obia et al; (2016) reported that housing development (private as well as public) in Calabar is based on the paradigm of individual plots for individual house owners. This is exacerbated by ancestral land ownership system and indiscriminate land acquisitions by private developers. Peri-urban prime agricultural lands de-vegetated and converted into urban housing sectors; a phenomenon (Obia et al; 2016) stated has been happening since the 1970s. It is a known fact that slopes are unsuitable for housing development and human occupation. This research has indicated that the ten deep gully sites under investigation including the site of the September 2013 fatal incidence are in the very high landslide susceptibility zones. Urban planning and development authorities are in a unique position to reduce disaster risk through implementation of planned and controlled land use management.
We recommend that for sustainable habitation on very high landslide susceptibility areas (Figure 20), urban planning and development authorities’ should,
It is concluded that a multicriteria decision support systems of landslide susceptibility integrating geospatial, geotechnical and hydrometeorological parameters helps to delineate and rank zones of a region prone to the disaster. Method has combined the causative factors as criteria in the analysis based on site specific characteristics with results indicating the contribution of each criterion to landslide susceptibility. The study area has been delineated into low, high and very high landslide susceptibility zones. Results were consistent with previous disaster and deep cut gully sites indicating them as most vulnerable. Recommendations for further research include the investigation of deep seated rock joints, depth of circular failure surface and detailed slope stability analysis and determination of rainfall induced rise in pore water pressures of the slope materials and attendant effect on slope instability. Risk assessment and implementation of slope protection and or stabilization options is highly recommended for sustainability of developments in the high to very high susceptibility zones.
Authors would like to thank the management of Mcfaas Int’l Projects Ltd for funding the research.
Abam, T. K. S. (2016). Engineering Geology of the Niger Delta. J. of Earth Sciences and Geotechnical Engineering, Vol.6, (3), 65-89.
Abija, F. A. and Abam, T. K. S. (2018). Application of geo-accumulation and pollution load indices in the assessment of heavy metal contamination in Forcados river sediments and adjoining soils, Western Niger Delta. J. of Geoscience and Environmental Research, Vol. 1, No. 1, pp. 35 - 51
Abija, F. A. (2019). Assessment of Coastal Modification and Surf Zone Induced Erosion in Itak Abasi Beach, Eastern Niger Delta, Nigeria. Environmental and Earth Sciences Research Journal Vol. 6, No. 2, June, 2019, 83-88.
View ArticleAbija, F. A., Essien, N. U., Abam, T. K. S and Ifedotun, A.I. (2019).Assessment of aquifer hydraulic properties, groundwater potential; and vulnerability integrating geoelectric methods with SRTM-DEM and LANDSAT-7 ETM lineament analysis in parts of Cross River State, Nigeria. London Journal of Research in Science: natural and Formal. Vol. 19, Issue 7, Compilation 1. 35 - 55.
Abija, F. A., Teme, S. C. and Oborie, E. (2018). Geotechnical Considerations for the design and construction of foundations in a marshy stream channel of Iwochang - Ibeno, Eastern Niger Delta, Nigeria. Journal of Civil, Construction and Environmental Engineering 2018; 3(6): 154-170.
Adefolalu, D.O. (1981). The weather and climate of Calabar: a study of coastal microclimatology in equatorial tropics. Senate Research Project Report, University of Calabar.
Altuzarra, A.,. Moreno-Jimenez, J. .M. and Salvador, M. (2007). A Bayesian prioritization procedure for AHP - group decision making. Eur. J. Oper. Res., 182, 367-382.
View ArticleBlyth, F. G. and de Freitas, M. H. (1982). A Geology for Engineers, 7th edn. Oxford: Butterwoth - Heineman, Imprint of Elsevier. 325 pages.
Cascini, L., Bonnard, Ch., Corominas, J., Jibson, R., Montero-Olarte, J. 2005. Landslide hazard and risk zoning for urban planning and development. In: Hungr, Fell, Couture, and Eberhardt (eds.), Landslide Risk Management, Proceeding of the International Conference on Landslide Risk Management, Vancouver, Canada. A.A. Balkema Publishers, Taylor & Francis Group, London, p. 199-235.
Charlton, M, and Ellis, S. (1991). GIS in planning. Journal of Environmental Planning and Management 34(1): 20-26.
View ArticleCheng, E.W.L., Li, H., Yu, L. (2005). The Analytic Network Process (ANP) approach to location selection: A shopping mall illustration. Constr. Innov. 2005, 5, 83-97.
View ArticleCrosta, G. and Frattini, P. (2008). Rainfall induced landslides and debris flows. Hydproc 22(4) 473 - 477.
View ArticleDe Felice, F., Petrillo, A., and Autorino, C. (2015). Development of a framework for sustainable outsourcing: Analytic Balanced Scorecard Method (A-BSC). Sustainability, 7, 8399-8419.
View ArticleDe Montis, A., Toro, D., Droste-Franke, B., Omann, I. and Stagl, S. (2000) Criteria for quality assessment of MCDA methods. In Proceedings of the 3rd Biennial Conference of the European Society for Ecological Economics, ESEE, Vienna, Austria, 3-6.
Edet, A. E. and Okereke, C. S. (2002). Delineation o groundwater aquifers in the coastal of the Calabar area, Southern Nigeria using surface resistivity and hydrogeological data. J. of African Earth Sciences (35) 433 - 443. 00148-3
View ArticleEdet, J. J., and Nyong, E.E (1993). Depositional environments, Sea - level history and paleogeogra phy of the late Campanian - Maastritchtian of the Calabar Flank SE. Nigeria. Paleoclimatology, Paleoecology;161-175. 90010-G
View ArticleEldrandly, K., Eldin, N., Sui, D., Shouman, M. and Nawara, G., 2005. Integrating GIS and MCDM using COM technology, the International Arab Journal of Information Technology, 2:2, 133-149
Evamy, B. D., Haremboure, J., Kamerling, P., Knaap, W.A., Molloy, F.A., and Rowlands, P.H. (1978). Hydrocarbon habitat of Tertiary Niger Delta: AAPG Bull., Vol. 62, 277-298.
View ArticleExpAhp2.0,(2015),Availableon:< >, Downloaded : October,(2015.)
View ArticleEtu-Efeotor, J. O. and Akpokodje, E. G. (1990). Aquifer systems of the Niger Delta. J. of Mining and Geology, 26, 279 - 294.
Ferretti, V. (2011). A Multi-criteria Spatial Decision Support System Development for Siting a Landfill in the Province of Torino (Italy). Journal of Multi-Criteria Decision Analysis, 18, 231-252.
View ArticleHong, H., Xu, C., and Biu, T. D. (2015). Landslide susceptibility assessment at the Xiushui area (China) using frequency ration model. Proceedia Earth and Planetary sciences, 15, 513 - 517.
View ArticleIge, O. O., Oyeleke, T. A., Baiyegunhi, C., Oloniniyi, T. L. and Sigabi, L. (2016). Liquefaction, landslide and slope stability analysis of soils: A case study of soils from parts of Kwara, Kogi, and Anambra States of Nigeria. Journal of Natural Hazards Earth Systems Science Discuss 9Under review). Doi:10.5194/nhess-2016-297; 1 - 39.
View ArticleIgwe, O. (2015). Stability analysis and simulated hydrologic response of some vulnerable slopes in Nigeria: implications for rainfall induced landslides. IOSR Journal of Applied Geology and Geophysics. Vol. 3, Issue 3 Ver. I. pp. 48 - 56.
Igwe, O. and Fukuoka, H. (2014). The effect of water saturation on the stability of problematic slopes at Iva Valley area, Southeast Nigeria. Arab J. of Geosciences, doi: 10.1007/s12517-014-1398-7.
View ArticleJanssen, R., (1992). Multi-objective Decision Support for Environmental Management. Kluwer Academic, Dordrecht, 232 pages.
View ArticleJanskowski, P., (1995,) Integrating Geographical Information Systems and Multiple Criteria Decision Making Methods, International Journal of Geographical Information Systems, 9-3, 251-273
View ArticleKar, A. (1994). Lineament control on channel behavior during the 1990 flood in Southeastern Thar desert. Int. J. of Remote Sensing, 15, 254 - 2530.
View ArticleKhan, H., Shafique, M., Khan, M. A., Bacha, M. A., Shah, S. U. and Calligaris, C. (2019). Landslide susceptibility assessment using frequency ratio a case study of Northern Pakistan. The Egyptian Journal of Remote Sensing and Space Sciences, 22, 11 - 34.
View ArticleKoopmans, B, N. (1986). A comparative study of lineament analysis from different remote sensing imagery over areas in Benue valley and Jos plateau, Nigeria. Int. J. of Remote Sensing, 7, 1763 - 1771.
View ArticleLehner, P., and De Ruiter, P.A.C. (1977). Structural history of Atlantic Margin of Africa: American Association of Petroleum Geologists Bulletin, Vol. 61, 961-981
View ArticleMcHarg, I. (1969). Design with Nature. Natural History Press: Garden City, New York.
Montgomery, C. W. (2006). Environmental Geology, 8th edn. New York: McGraw-Hill Companies INC. 556pages.
Murthy, V. N. S. (2014). Textbook of Soil mechanics and Foundation Engineering: Geotechnical Engineering series. New Delhi: CBS Publishers and Distributors Pvt Ltd. 1043pages.
Nilsen, T.H., Wright, R.H., Vlasic, T.C. & Spangle, W.E. (1979). Relative slope stability and land-use planning in the San Francisco Bay region, California. U.S. Geological Survey Professional Paper 944: 96 pp.
View ArticleNsengiyumva, J. B., Luo, G. Nahayo, L., Huang, X., and Cai, P. (2018).Landslide Susceptibility Assessment Using Spatial Multi-Criteria Evaluation Model in Rwanda. International J. of environmental research and Public Health, Vol. 15, 243. 1 - 23. doi:10.3390/ijerph15020243 PMid:29385096
View Article PubMed/NCBIObia, A. E., Itam, E. B. and Archibong, A. E.(2016). Contemporary urban development in Calabar - promoting sustainability by curtailing ecological footprints of (housing) development. Global Journal of Pure and Applied Sciences Vol. 22, 73-80
View ArticleOborie, E. and Abija, F. A. (2019). Slope stability analysis of the Afaha Ekpenedi integrated farm site, Esit Eket, Akwa Ibom State, Nigeria. Paper presented at the 2nd Africa Regional congress of the International Association for Engineering Geology and the environment and 4th annual International Conference of the Nigerian Association for Engineering Geology and the Environment, Abuja, 2019; pp. 27.
Ohon, E. O., Ukata, S, U, Eric J. Ndik, E.J., Ewa E. E. and Ibor, U. U. (2011). Assessment of Soils Susceptibility to Erosion Menace in Calabar Metropolis, Cross River State, Nigeria. J Hum Ecol, 36(3): 205-209.
View ArticlePhilip, G. (1996). Landsat thematic mapper data analysis for quaternary tectonics in parts of the Doon valley, NW Himalaya, India. Int. J. of Remote Sensing. Vol. 17, No. 1; 143 -153.
View ArticleReddy, M. A. (2007). A textbook of Environmental science and Technology, Hyderabad: BS Publications. 319 pages.
Saaty, T. L., (1990). How to make a decision: The Analytic Hierarchy Process. European Journal of Operational Research, 48, 9-26 90057-I
View ArticleSaaty, T. L. (1980). The Analytic Hierarchy Process: Planning, Priority Setting, Resources Allocation; McGraw-Hill: New York, NY, USA, 1980.