Nworie Felix .
Email: nworie.felix @gmail.com
© 2019 Sift Desk Journals. All Rights Reserved
VOLUME: 2 ISSUE: 1
Page No: 90-97
Nworie Felix .
Email: nworie.felix @gmail.com
NWORIE, F.S and NWABUE, F.I
DEPARTMENT OF INDUSTRIAL CHEMISTRY, EBONYI STATE UNIVERSITY, PMB 053 ABAKALIKI, EBONYI STATE, NIGERIA.
Ahmet Kilic(kilica63@harran.edu.tr)
Bao Li(libao@mail.hust.edu.cn)
Ahmed M Abu-Dief(ahmed_benzoic@yahoo.com)
Albert Poater(albert.poater@udg.edu)
Nworie Felix Sunday, Spectral and thermal analysis study of some transition metal complexes derived from bis(2,2/-methylylidene phenol)diaminoethane(-0001)SDRP Journal of Computational Chemistry & Molecular Modelling 1(1)
The thermodynamics of complexation and thermal properties of mixed ionic complexes of the types M(H2L)X2 and M(HL)X (where M = Fe(II), Fe(III),Co(III), Ni(II), and Cu(II)., L = bis(2,2/-methylylidenephenol)diaminoethane, and X = anions of the types Cl-, NO3-, SO42-, ClO4- or OH-) prepared using extractive method have been investigated. Thermal decomposition of the transition metal complexes took place in two or three distinct steps in exothermic reaction up to 800°C. The heat capacity change (), transition midpoint temperature (Tm), entropy change (), calorimetric enthalpy, Gibbs free energy change (), denaturation enthalpy ( )) and denaturation entropy () were calculated from the results of differential scanning calorimetry (DSC) while Vant Hoff thermodynamic properties was used to calculate the stability constants of the complexes in solution. It was found that the stability constants of the complexes follow the order Fe(II) > Fe(III) > Cu(II) > Ni(II) > Co(II) while the denaturation enthalpy and entropy of the complexes follow the order Ni(II) > Fe(II) > Fe(III) > Co(II) > Cu(II) respectively.
Keywords: bis(2,2/-methylylidenephenol)diaminoethane, transition metal complexes, thermal analysis, thermodynamic parameters.
The development of the field of inorganic and physical chemistry has increased in recent years with increased synergy especially in the area of Schiff bases and their transition metal complexes. Bis(2,2/-methylylidene phenol)diaminoethane its derivatives and transition metal complexes have played significant role in bioinorganic chemistry and applications [1-2] in catalysis and in electrocatalytic reactions [3-5], as oxidizing agent [6-7], as nanocomposite and nanoparticles [8-9], as corrosion inhibitor [10], in carbon capture for purifying the environment [11], as red phosphorescent light emitting diode (Ph OLEDs) [12] and as metallomesogens [13].
Even though some authors [14-16] have incriminated some Schiff bases and their metal complexes as potential antimicrobial agent, none have related the thermodynamic stability and denaturation enthalpy and entropy to the biochemical nature of the synthesized metal complexes. Similarly some authors [12,17-18] who worked on H2L and complexes only concentrated on melting point determination and thermal stability without indepth treatment of the thermodynamic properties. Again, most studies concentrated on complexes of H2L prepared using constituent combination method [19] but this work was on the thermal and thermodynamic properties of H2L complexes prepared using extractive techniques. In this work, spectral, thermodynamic and thermal methods were applied in the characterization of H2L transition metal complexes which are very important in bioinorganic chemistry and applications.
2.1 Reagents and equipment.
Analytical grade reagents (Merck, Germany) were used without further purification unless otherwise mentioned. All aqueous solutions were prepared in distilled water and working solutions prepared by dilution as required. Bis(2,2/-methylylidene phenol) diaminoethane(H2L) shown in figure I was prepared as reported elsewhere [20] . Stock solutions of Fe(II) , Fe(II),Co(II), Ni(II) and Cu(II) were prepared using (NH4)2SO4.FeSO4.6H2O, Fe2(SO4)3.9H2O, CoCl2.6H2O, NiSO4.7H20 and CuSO4.5H2O (Merck, Analar grade). Stock solutions of mineral acids (HCl, HNO3 and H2SO4) were prepared by diluting the concentrated acids and were standardized using appropriate standard bases.
Electronic spectra of the ligand and complexes in chloroform solution were obtained on Jenway Uv – Vis spectrophotometer model 6105. DSC analysis (Thermal degradation pattern) was determined using NETZSCHDTA 404PC Differential scanning calorimeter. Metal-ligand mole ratio was determined using jobs method of continuous variation as described elsewhere [21]. Microanalysis of the ligand and complexes were done at the Department of Chemistry, Rhodes University, South Africa.
2.2. Synthesis of metal complexes
An aliquot of a sample solution containing 100µg each of Fe(II), Fe(III), Cu(II) ,Ni(II) and Co(II) was transferred into a 20 mL calibrated extraction bottle and volume was made up to 5 mL with acid solution of concentration 0.0001M. This was followed with the addition of 0.5mL of ligand solution. 5minutes for colour development was allowed and complexes formed extracted with 5 mL chloroform. The organic extracts were allowed to dry and product recrystallized using carbon tetrachloride, dried and characterized (M.P ˃2500C for Fe(II) while for Fe(III), Cu(II) ,Ni(II) and Co(II) M.P ˃3000C).
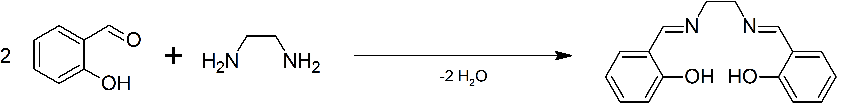
Figure 1: synthesis of the ligand H2L
2.3 Thermal Analysis Using Differential Scanning Calorimeter
The sample and reference pan were placed at separate furnaces maintained by separate heaters. Both sample and reference were maintained at same temperature and the difference in thermal power required maintaining them at the same temperature measured and plotted as a function of temperature or time. Differential heat flow was due to heat capacity associated with heating the sample. Small samples (5.00 mg) were weighed into an alumina crucible and mass noted. The crucible was covered with its cover usually slightly smaller. The TA Blue DSC sample press was used to close the crucible. The enclosed sample was placed side by side with the empty alumina crucible as reference. The instrument was purged with ultra pure N2 gas at regulated pressure between 100 and 140 Kpa guage (15 and 20 Psi). The gas flow rate was set at 50 mL per min and experiment run from room temperature to 800 0C at scan rate of 10 0C min.
3.1 UV-Vis Data and metal-ligand mole ratio.
Electronic spectrum of the Ni(II)H2BMPDE complex exhibited three bands in the region 24691cm-1 assignable to and 33898 and 38462 cm-1 due to charge transfer transitions respectively notable in square planar environment for Ni(II) ion [22]. The absence of bands around 10120-11605, 16062-16180 and 25210 -25575cm-1 assignable to, respectively are due to charge transfer transitions from ligand to Ni(II) ion [23-25].
The electronic spectrum of cobalt (II) oxidized to Co(III) complex a d6 ion consists of three bands in the region 25000, 29851 and 38462 cm-1. The appearance of the band in the region 25000cm-1 assignable to indicated distorted octahedral geometry around the cobalt(II) ion whereas the band in the region 29851 and 38462 cm-1 are due to charge transfer transitions [26-27]. Similarly the broad band region of the electronic spectra of Co3+ a d6 covering the long wavelength region 335-400 nm was assigned to an octahedral transition [28].
For Cu2+ ion a d9, a band displayed in the electronic spectrum in the region of 28571cm-1 characteristic of transitions was typical of a distorted octahedral geometry. The and states of d9 octahedral copper (II) ion splits up under the influence of octahedral field (tetragonal distortion). The distortion can cause three transitions and typical of distorted octahedral geometry [29]. The electronic spectra of Fe3+ H2BMPDE a d5 ion consist of three bands in the region of 43478, 37037 and 23529 cm-1. The band at 23529 cm-1 assignable to suggested distorted octahedral geometry [30-31]. The other band 43478 and 37037 cm-1 are due to charge transfer transition [26,31]. The electronic spectra of Fe2+ H2BMPDE a d6 ion consists of three bands in the region 30762, 40000 and 47619 cm-1. The band at 30769cm-1 was assigned to indicating distorted octahedral geometry of Fe(II) ion (El-Gamel, 2012). The band at 40000 and 47619 cm-1 are due to charge transfer transitions [22]. The metal-ligand mole ratio as determined from jobs plot indicated 1:1 stoichiometry for all the transition metal complexes and similar observations have been made [32] with related derivatives.
3.2 Thermodynamics of Complexation
The Vant Hoff thermodynamic properties of H2L and HL complexes are shown in table I. Entropy and enthalpy changes were positive for all the complexes. The stability constants of the complexes increased in the order Fe(II) > Fe(III) > Cu(II) > Ni(II) > Co(II).
The complexation process increased as temperature increased for all the metal ions until at a maximum of about 35 oC. The increased complexation of the metal ions to the ligand at relatively high temperatures (between 20-35 oC) showed that the complexation process may be endothermic [33]. From table II, Gibb’s free energy change values were found to be negative indicating the feasibility and spontaneity of the complexation. The positive sign of enthalpy change confirmed that the complexation process was endothermic. The negative value of entropy change showed that the complexation involved solvation process [34]. Similarly the values of stability constants indicated that iron (II) and iron (III) metal ion complexes are more stable than others [34]. The thermodynamic parameters of complexation such as enthalpy (∆H0), entropy (∆S0), Gibb’s free energy (∆G0) and stability constant (βn) are listed in table I and are calculated from the variation of the thermodynamic equilibrium constant, K0 at different temperatures as shown in equation 1.
K0 = C1 / C2 …………………….1
C1 is the amount of metal ion complexed per unit mass of ligand and C2 the concentration of metal ion in the aqueous phase [33].
The standard enthalpy change of complexation (∆H0), the standard entropy change of complexation (∆S0), Gibb’s free energy of complexation (∆G0) and stability constant for complexation (βn) were calculated as shown in equation 2, 3 and 4.
K0 = ΔS0 /R - ΔH0 /RT ---------------------2
ΔG0 =RTInK0 ……………………………3
ΔG0 =-2.303RTβ0 …………………………….4
Thus, T represents the temperature in K while R is the universal gas constant (KJ Mol-1k-1). The thermodynamic values are given in Table 2.
Table I: Vant Hoff Thermodynamic Parameters of H2L and HL complexes.
|
Metal complexed |
T(K) |
InK0 |
Βn |
∆G0(KJMol-1) |
∆H0(KJ Mol-) |
∆S(KJMol-1K-1) |
|
Fe(III) |
288 293 298 303 |
4.59 2.43 0.559 0.198 |
1.813 1.055 0.243 0.086 |
-10.99 -5.919 -1.385 -0.498 |
20187.85 |
-52.406 |
|
Fe(II) |
288 293 293 303 308 313 |
4.18 4.056 3.94 3.17 3.112 2.94 |
1.814 1.76 1.71 1.38 1.35 1.27 |
-10.00 -9.88 -9.76 -7.98 -7.96 -7.65 |
5462.11 |
-65.63 |
|
Ni(II) |
288 293 293 303 308 313 |
3.17 3.10 3.00 2.90 2.923 2.923 |
1.38 1.35 1.30 1.26 1.27 1.27 |
-7.59 -7.55 -7.55 -7.43 -7.48 -7.60 |
1155.74 |
-0.1817 |
|
Co(II) |
288 293 293 303 |
2.495 2.429 2.31 0 |
1.08 1.05 0.985 -0 |
-5.97 -5.97 -5.62 0 |
14680.49 |
-47.51 |
|
Cu(II) |
288 293 293 303 308 313 |
3.66 3.47 2.99 2.09 2.034 1.967 |
1.59 1.506 1.298 0.906 0.8817 0.854 |
-8.76 -8.45 -7.41 -5.26 -5.20 -5.12 |
7654.36 |
-22.50 |
Legend:T=temperature, βn= stability constant, ∆G0=Gibb`s free energy.
3.4 Kinetics of complexation
The kinetics of complexation of metal ions to the ligand (H2L) at different contact time (1, 3, 5, 10 and 15 minutes) and at constant ligand and acid concentration of 0.5 % and 10-4 M respectively was performed. Contact time of 10,5,10, 10 and 5 mins was sufficient to achieve equilibrium for iron (III), iron(II), cobalt(II), nickel(II) and copper(II) metal ions complexation with H2L ligand respectively. The commonly used kinetic models were applied on the complexation data the Lagergren pseudo-first –order model and pseudo-second –order shown in equations 5 and 6 respectively.
In (qe-qt) = Inqe – k1t ---------------5
t/qt = 1/k2 qe2 + t/qe -------------6
qe is the amount of metal ion complexed with ligand at equilibrium (µg) and qt is the amount (µg) of metal complexed at time t (min) whereas K1 and K2 are rate constants of pseudo-first order and second –order models respectively. A linear plot of In(qe-qt) versus t for Pseudo-first –order model and t/qt versus t for second –order –model clearly described the relevance of the models with the slopes as K1 and K2 respectively. Based on the high regression coefficient of the metal ions complexation on the ligand as shown from the pseudo-second –order kinetic model (R2 =0.9984, 0.9993, 0.9948, 0.9983,0.9994 for iron(II), iron (III), cobalt(II), nickel(II) and copper(II) respectively in relation with pseudo-first –order kinetic model (R2=0.6634, 0.6102, 0.3382, 0.383 and 0.6118 for iron(II), iron (III), cobalt(II), nickel(II) and copper(II) respectively), the complexation was best described by the Pseudo –second –order kinetic model.
3.5 DSC studies
Table 2: Thermodynamic Data on the DSC Decomposition of H2L and HL Complexes.
|
Metal complex |
T |
Tm |
|
||||||
|
Fe3+ HL |
317.7 425.4 783.6 |
302.1 405.2 776.9 |
235 138.4 880.2 |
34.1 34.9 8.6 |
0.778 0.342 1.13 |
-0.034 -0.178 2.103 |
766.96 843.38 937.82 |
2.49 2.04 1.20
|
|
|
Fe2+ HL |
109.2 290 811.1 |
98.1 275.4 802.4 |
-49.62 536.2 108.6 |
23.9 40.9 18.9 |
-0.506 1.95 0.135 |
0.019 -0.83 0.276 |
220.45 1133.3 273.03 |
2.055 4.06 0.338
|
|
|
Ni2+ HL |
146.4 509.2 617.6 842.2 |
141.4 496.1 573.1 836.6 |
31.24 -101.8 576.7 444.66 |
13.7 19.4 55.5 14.1 |
0.221 -0.205 1.006 0.531 |
-0.009 -0.099 0.161 0.365 |
99.74 152.34 3046.4 523.56 |
0.697 0.300 5.156 0.623
|
|
|
Co2+ H2L |
117.8 519.2 626.3 667.3 |
124.8 505.6 601.6 695.4 |
-181.3 234 106.1 269 |
12.8 29.1 31.1 34.5 |
-1.45 0.46 0.176 0.387 |
-0.34 1.424 0.218 0.119 |
270.9 513.36 874.27 700.45 |
0.711 1.23 1.427 -1.036
|
|
|
Cu2+ H2L |
345.6 539.1 623.2 792.2 |
332.3 545.2 619.6 802.7 |
166.9 10.7 54.81 36.8 |
19.6 8.8 37.4 51.1 |
0.502 0.019 0.088 0.046 |
0.085 0.341 0.285 -0.124 |
427.58 -42.98 189.45 -499.75 |
1.27 -0.08 0.304 -0.626
|
|
|
|
|
|
|
|
|
|
|
|
|
Legend: T(oC)=Temperature,Tm(oC)J/K)oC) = change in heat capacity, , =denaturation entropy, = denaturation enthalpy.
The DSC curve for Fe2+HL, Cu2+HL, Co2+H2L, Fe3+HL and Ni2+HL was subdivided into two, three, three, two and three main exothermic stages respectively as shown in table II. The thermal degradation patterns could have been due to loss of hydroxyl group, loss of component attached to the phenolic moiety, ligand degradation or decomposition and final decomposition to metal oxide. For FeII HL, the weak endothermic peak at 98.1 oC corresponds to morphological transformation or loss of hydroxyl group or smaller fragment [35] while the sharp endothermic peak at 275.4 oC corresponds to the melting point of the complex. This was followed by a strong exothermic peak at 802.4 oC corresponding to the decomposition of the complex. For Cu2+ HL, the DSC thermogram showed single sharp endothermic peak at 332.3 0C corresponding to the melting point of the complex. This was followed by three exothermic peaks at 545.2, 619.6 and 802.7 0C corresponding to the stepwise decomposition of the complex. The DSC curve of Fe3+ HL showed three peaks, one of the peaks corresponds to endothermic process while two corresponds to exothermic processes. The sharp endothermic peak at 302.1 0C corresponds to the melting point of the complex whereas the broad peaks at 405.2 0C and 776.9 0C corresponds to stepwise decomposition of the complex. The DSC curve of Ni2+ HL showed four peaks, 141.4 0C, 496.1 0C, 573.1 0C and 836.6 0C. The first weak endothermic peak (141.4 0C) corresponds to morphological transformation while the second sharp endothermic peak 496.1 0C corresponds to the melting point of the complex. The last two peaks at 573.1 0C and 836.6 0C corresponds to stepwise decomposition of the complex. The DSC curve of Co2+ H2L showed four peaks. The first weak endothermic peak at 124.8 0C corresponds to morphological transformation while the second sharp endothermic peak 505.6 0C corresponds to melting point of the complex. The last two broad exothermic peaks at 601.6 0C and 695.4 0C correspond to stepwise decomposition of the complex.
Calculations from DSC data as shown in table II, presented negative values of at some steps indicating the reactions are slower than expected thereby establishing nonspontaneous nature of the reaction. Positive value o in some steps supports the nonspontaneous nature of the degradation process [36]. Similarly, the positive value of enthalpy indicated the endothermic nature of the degradation process [37]. values indicated that the transition is highly co-operative as denaturation occurs within narrow range of temperature [37-38]. Based on the results, degree of denaturation entropy and denaturation enthalpy of the H2L complexes increased from Ni2+ Fe2+ Fe3+Co2+ Cu2+.
The values of was derived from the relation in equation 7
Δsm0 = ΔHm0 /Tm ----------------------7
ΔG0 (T) = ΔHm0 (1-T/Tm) + ΔCp (T - Tm) – T In (T/Tm)-------------------------8
ΔH0 (T) = ΔHm0 + ΔCp (T - Tm) --------------------------------9
ΔS0 (T) = Δsm0 + ΔCp In (T/Tm) -------------------------10
Differential scanning calorimetry studies on the complexes showed the stages of decomposition of the complexes with temperature variation. The thermal degradation patterns have been attributed to loss of water, loss of component attached to the phenolic moiety, ligand degradation or decomposition and final decomposition to metal oxide. Similar observations have been seen in complexes of bis(salicylaldehyde)ethylenediamine [39].The proposed thermal degradation pattern of the complexes are illustrated in fig 2.
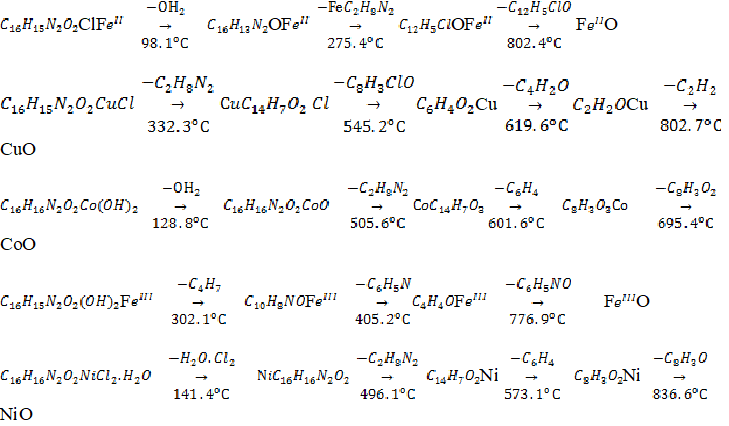
Figure 2: proposed degradation pattern of H2L and HL complexes.
In conclusion, the thermal properties of the complexes of H2L synthesized using extractive technique have been critically studied. The complexation which indicated formation of mixed ionic complexes was nonspontaneous and the DSC decomposition of the complexes have shown their degrees of biochemical stability.
Woldemarian G A, Mandal S S . Iron(III) salen Damages DNA and Induces Apoptosis in Human Cell Via. J. Inorg. Biochem. 2008;102: 740-7. PMid:18180039
View Article PubMed/NCBIRosas-Garcia VM, Martinez PE, Rodriguez N P, Martinez BN. Potential Oxygen ?Carrying Complexes by Design. Quimica Hoy Chemistry Sciences. 2012; 2(4): 30-3.
Sonkar P K, Ganesan V, Rao V. Electrocatalytic Oxidation and Determiantion of Cysteine at Oxovanadium(IV)salen Coated Electrodes. Int. Journal of Electrochemistry. 2014; 1-6.
View ArticleKatsuki T . Functionalization of Metallosalem Complexes: Diverse Catalytic Performances and High Asymmetry Inducing Ability. Chem Lett, 2006; 124:1-12.
Zhang W, Loebach JL, Wilson SR, Jacobsen EN. Enantioselective Epoxidation of Unfunctionalized Olefins Catalyzed by (Salen) Manganese Complexes. J.Am. Chem. Soc. 1990; 112: 2801-3.
View ArticlePerumal S, Thangadurai V, Thiruthimuthu K, Chandra R S. Role of Iron (III)- Salen Chloride as Oxiding Agent with Thiodiglycolic Acid: The Effect of Axial Ligands. J. Mex. Chem. Soc. 2004;58(2): 211-17.
Alioke C U, Ukoha P O, Ukwueze N N, Ujam O T, Asegbeloyin J N. Kinetics and Mechanism of the Reduction of N,NI-salicylideneiminatoiron(III) Complex Ion by L-ascorbic acid in Aqueous Acid Medium.Chemistry and Materials Research. 2012;2(7):48-57.
Du J, Cheng F, Wang S, Zhang T, Chen J. M(salen)-Derived Nitrogen Doped M/C (M=Fe, Co, Ni) Porous Nanocomposites for Electrocatalytic Oxygen Reduction. Scientific Reports (4386) Conference Proceedings AP Energy 2014; 4: 1-7.
Zhu Z, Wang S, Du J, Jin Q, Zhang T, Cheng F, Chen J. Ultrasmall Sn Nanoparticle Embedded in Nitrogen ?Doped Porous Carbon as High Performance Anode for Lithium-ion Batteries. Nano Lett. 2014; 14(1):153-7. PMid:24328829
View Article PubMed/NCBIMurugaiyan M, Madhu P, Vennila P ,Venkatesh Investigation of Schiff Base N, NI ?bis (Salicylidene)- 1,2- Diaminoethene(salen) as Corrosion Inhibitor for Mild Steel in H3P04 Solution. International journal of Chem Tech Research. 2014/2015; 7(5): 2489-98
Starkie C. Advances in Carbon Capture and Storage Research. John Matthey Technol. Rev 2015; 59(3): 182-187.
View ArticleBae HJ, Hwang KY, Lee M H, Do Y. Salen-Aluminium Complexes as Host Materials for Red Phosphorescent Organic Light Emitting Diodes. Bull. Korean. Chem. Soc. 2011; 32(9): 3290-94.
View ArticleAbe Y, Nakabayashi K., Matsukawa N, Takashima H, Lida M, Tanase T, Sugibayashi M, Mukai H, Ohta K. Chain Formation via the VO Units in the Lliquid Crystal. Inorg. Chin. Acta. 2006; 359(12): 3934-46.
View ArticleDoctrow SR, Huffman K, Marcus CB, Tocco G, Malfroy E, Adinolfi, C A, Kruk H, Baker K, Lazarowych N, Mascarenhas J, Malfroy B. Salen Manganese Complexes as Catalytic Scavengers of Hydrogen Peroxide and Cytoprotective Agents: Structure- Activity Relationship Studies. J. Med. Chem. 2002;45: 4549 PMid:12238934
View Article PubMed/NCBIDoctrow S R, Liesa M, Melov S, Shirihai OS, Tofilon P. Salen Mn Complexes are Superoxide Dismutase/Catalase Mimetics that Protect the Mitochondria. Curr. Inorg. Chem. 2012; 2: 325-334
View ArticleJohnson C, Long B, Ngugen JG, Day V W, Borovi AS, Subramaniam B, Guzman J. Correlation Between Active Centre Structure and Enhanced Dioxygen Binding in Co(salen) Nanoparticles: Characterization by In Situ Infrared, Raman, and X-ray Absorption Spectroscopies. J. phy. Chem. C. 2008; 112(32) :12272-81
Kumar D N, Garg BS. Some New Cobalt(II) Complexes: Synthesis, Characterization and Thermal Studies. Journal of Thermal Analysis and Calorimetry. 2002; 6(2):607-16.
View ArticleAl-hamadani UJ, Abid DS. Synthesis of Iron(III) Complex of Polyester and Study of its Liquid Crystalline and Catalytic Properties. Journal of Basrah Researchers (sciences). 2011;37(3A):100-103
Cozzi PG. Metal ?salen Schiff Base Complexes in Catalysis. Practical Aspects. Chem. Soc. Rev. 2004; 33: 410-21. PMid:15354222
View Article PubMed/NCBINworie FS, Nwabue FI.Solvent Extraction Studies of Metal Complexes Derived from a Tetradentate Schiff Base Bis(salicylidene)ethylenediamine (H2SAL) in Acid Medium.International Journal of Innovative and Applied Research. 2014; 2 (6): 66-75.
Nwabue F I, Okafo E N. Studies on the Extraction and Spectrophotometric Determination of Ni(II), Fe(II), Fe(III) and V (IV) with Bis (4-hydroxypent-2-ylidene) Diaminoethane. Talanta. 1991; 39(3): 273-280. 80032-9
View ArticleBoghaei DM, Lashanizadega M. Template Synthesis Characterization of Highly Unsymmetrical Tetradentate Schiff Base Complexes of Nickel(II) and Copper(II). J.Sci.I.R. Iran. 2000; 2: 301.
Rathore K, Singh RK, Singh HB. Structural, Spectroscopic and Biological Aspects of O, N Donor Schiff Base Ligand and its Cr(III), Co(II) Ni(II) and Cu(II) Complexes Synthesized through Green Chemical Approach. E-Journal of Chemistry. 2010; 7: 5566-72.
View ArticleUkoha PO, Oruma US.Synthesis and Antimicrobial Studies of N,NI-bis(4-dimethylaminobenzylaldehyde) ethane- 1,2-diamine and its Nickel(II) and platinum(IV) Complexes. Journal Chem Soc.Nigeria. 2014; 39(2):102-7.
Zahid H L, Syed KAS. Spectral, Magnetic and Biological Studies on Some Bivalent 3d Metal Complexes of Hydrazine Derived Schiff ?Base Ligands. Metal ?Based Drugs. 1997; 4(2): 65-8. PMid:18475770 PMCid:PMC2365047
View Article PubMed/NCBIYang S, Kwon H, Wang H, Chang K, Wang J. Efficient Electrolyte of N, NI-bis(salicylidene) ethylenediamine zinc(II) Iodide in Dye-sensitized Solar Cells. New. J. Chem. 2010; 34, 313-7.
View ArticleSingh K, Baruwa MS, Tyagi P. Synthesis, Characterization and biological activities of Co(II), Ni(II), Cu(II) and Zn(II) Complexes with Bidentate Schiff Bases Derived by Heterocyclic Ketone. Eur Journ Medicinal Chem. 2006; 41 (1) :147 -153. PMid:16271421
View Article PubMed/NCBIPrakash A, Pal Ganwar M, Singh KK . Synthesis, Spectroscopy and Biological Studies of Ni(II) Complexes with Tetradentate Schiff Bases having N202 Donor Group. J. Dev. Biol. Tissue Eng . 2011;3(2): 13-19.
El-Gamel N E A, Zayed MA. Fluoroquinoline Antibiotic (Enrofloxacin) Metal Complexes. Synthesis, Spectroscopic and In vitro Antimicrobial Screening Properties. World Journal of pharmaceutical research, 2014;4(1):142-62.
El-Gamel NEA .Co-ordination Behavior and Biopotency of Metal N, N- Salen Complexes. RSC Advances, 2012; 2:5870-6.
View ArticleEl-Gamel NEA, Zayed MA. Synthesis, Structural Characterization and Antimicrobial Activity Evaluation of Metal Complexes of Sparfloxacin. Spectrochim Acta, 2011; 82:414-23. PMid:21856215
View Article PubMed/NCBILloret F, Moratal J, Faus J. Hydrolytic Decomposition of Salen in Acid Solution: Solution Chemistry of N,NI- ethylenebis(salicylideneiminato)Iron(III). International Journal of Inorganic and Organometallic Chemistry. 1983; 10: 1743-8
El- Binday A- A, El- sonbati, M A D, Abd ? El kader M K Potentiometric and Thermodynemic Studies of Some Schiff Base Derivative of 4- Aminoantipyriane and their Metal Complexes. Journal of Chemistry.2013. 68218: 1-6
Samir A A, Saber EM, Abdulrahman,A F Potentiometric, Spectrophotometric, Conductimetric and Thermodynamic Studies on Some Transition Metal Complexes Derived from 3? methyl-l-phenyl- and 1,3,- diphenyl- 4?arylazo- 5- pyrazolones. Nature and science. 2010; 2 : 793- 803.
View ArticleLee CH, Hsu CK, Chang CL. A Study on the Thermal Decomposition Behaviours of PETN, RDX, HNS and HMX, Thermochim. Acta. 2002; 173: 392-3
Borah D, BaruahM K.Kinetic and Thermodynamic Studies on Oxidation and Desulphurization of Organic Sulphur from India Coal at 50-150oC. Fuel.Processing Technology. 2001;72(2):83-101 00132-6
View ArticleBruylant G, Wouters J, Michaux C. Differential Scanning Calorimetry in Life Science: Thermodynamics Stability, Molecular Recognition and Application in Drug Design.Current Medicinal Chemistry. 2005; 12: 2011-20.
View ArticleJoshi K R, Rojivadiya A J, Pandya J H.Synthetic and Spectroscopic and Antimicrobial Studies of Schiff Base Metal Complexe Derived from 2-hydroxy-3- methoxy-5-nitrobenzaldehyde. Int. Journal of Inorganic Chem,2014, 817412.
Emara AAA, Ali AM, El-Asmy AF, Ragab EM. Investigation of the Oxygen Affinity of Manganese(II), Cobalt (II) and Nickel(II) Complexes with Some Tetradentate Schiff Bases. Journal of Saudi Chemical Society. 2011; 18 (6): 762-73.
View Article