Qun Kang
Email: kangqun@hubu.edu.cn
© 2019 Sift Desk Journals. All Rights Reserved
VOLUME: 4 ISSUE: 6
Page No: 763-773
Qun Kang
Email: kangqun@hubu.edu.cn
Zhao Jinhui1, He Chao2,Deng Tiantian1,Hou ChangpingP1,Yang Zhe1,Kang Qun1*
1 College of Resources and Environment, Hubei University,Wuhan,430062
2 Wuhan University School of Resources and Environmental Science,Wuhan,430072
Tania Colasanti(tania.colasanti@gmail.com)
Qun Kang, Zhao Jinhui, He Chao, Deng Tiantian, Hou ChangpingP, Yang Zhe, The Analysis of the Sedimentation Regularity and the Potential Source Area of the Black Carbon Aerosol in Wuhan City of the Middle Yangtze River(2019)Journal of Earth Sciences & Environmental Studies 4(6) p:763-773
Based on the WRF-CMAQ model, this paper simulates the data of the daily mass concentration of black carbon aerosol at 16 different height levels of Wuhan City, makes the analysis of trajectory clustering and height profile and the calculation of trajectory concentration by HYSPLIT-4 model, reveals the feature of the air trajectory from the perspective of the source, the directions, the channel area, the number of trajectory, the ratio of the mass concentration of the single trajectory of black carbon to all the trajectory and other aspects, and tries to find the special level from the vertical direction according to the difference. The result shows that the trajectory distribution in different height levels shows the homonymous direction and co-originality during the study phase; the mass concentration of black carbon in all kinds of trajectory at different height levels presents a tendency to decrease from low level to high level, and the trajectory of the high mass concentration of black carbon mainly comes from Hunan Province, Henan Province, Jiangxi Province and other directions, which shows that the peripheral sources within short transmission distance cast larger influence to the mass concentration of black carbon; the level of 300m and 2600m is the key saltation layer in vertical direction, thus, the pollution by black carbon in Wuhan area are mainly from close range; from the first layer to the thirteenth layer(from 500m to 1800m), the low air masses have much influence, and from fourteenth layer to the sixteenth layer(from 3000m to 6400m), the high air masses have much influence.
Key words: the Middle Yangtze River, Black Carbon Aerosol, vertical sedimentation, trajectory clustering, analysis of the source area
Black carbon aerosol is a kind of amorphous carbon particles, generated by incomplete combustion of carbonaceous matter, and it is harmful to human health, can change climate feature, deduce the visibility, influence the procedure of atmospheric chemical reaction and so on. Black carbon is the major impact factor, so it becomes a hot point for scientific research.
Many scholars pay attention to and make analysis on the horizontal spatial-temporal distribution regularity of black carbon, and using models like MM5/SMOKE/CMAQ to systemically simulate, they find that black carbon aerosol is mainly distributed in North China, South China and the middle and lower reaches of Yangtze River, showing a clear seasonal change, that is, the concentration of black carbon aerosol is higher in winter and spring than in summer. The model has successfully simulated the variation trend of the air pollutant, consistent with the observed result. However, not many researches use the WRF-CMAQ model to study the vertical distribution of black carbon aerosol, this paper makes deep exploration in the parameter setting.
In analysis of the sedimentation of black aerosol, some research reveal that, the 80% to 90% black carbon generated all over the world each year interact into soil and deposits, and Jurado’s research shows the wet deposition of the global black carbon aerosol is 5 times as much as dry deposition. Cape et al(2012) indicated that the life-span of BC in villages in the south of Scotland is about 4 to 12 days. Black aerosol cannot be cleaned up by atmospheric chemical processes, and the wet and dry deposition is the only. In urban area, it can remain for an hour, but in higher troposphere, it can remain for 7.85 days, and supposing that the discharged black carbon is hydrophilic, it can remain for 5.57 days. The sedimentation rate of aerosol particles depends on the feature of the particles, the meteorological conditions and the terrain feature. At present, however, there is no scholar having made long-time relevant researches to study the vertical sedimentation regularity of black aerosol in Wuhan city in middle Yangtze River.
Domestic scholars have made specific analysis in issues of air pollution and potential source area in some city agglomerations. In Pearl River Delta, the lower air pollutant are divided into three types, respectively, long-range transportation, local transportation and inter-city transportation, among which, the last one is the most important; in Suxichang Metropolitan area, the clean air from the ocean and the polluted air from inland are the two key transporting types, and the potential source areas are mainly distributed in local areas and the surrounding cities; in the Yangtze River Delta, the long-range transportation source from northwestern inland and North and East China and the regional pollution have cast serious impact to the air quality in winter in the Yangtze River Delta. In conclusion, the potential source areas of the three city agglomerations include long-range transportation, regional transportation and the inter-city transportation within city agglomerations. Yet in home, the present researches on black carbon aerosol are primarily centered on the spatial-temporal distribution and the component of black carbon, and fewer researches are made on data simulation of black carbon using professional model, and there is almost no discussion on its vertical distribution regularity and features. In addition, fewer researches are about the potential source area of air pollutant in Wuhan city, one of the city agglomerations in the middle of Yangtze River, thus, this paper chooses the black aerosol in the city agglomerations in the Yangtze River Delta as the research object, uses the HYSPLIT multi-point forward trajectory model, trajectory cluster analysis, weight concentration trajectory method and the contributed factor analysis of the potential source, makes simulated analysis on the main transporting channel of the pollutant and the potential source distribution in the vertical direction within regions to decide the air moving trajectory, to study the transportation route and to reveal the potential pollution source area. This paper compares the similarities and differences of the variation regularity in vertical direction of the 16 levels, discriminate the key source areas and the key levels that influence the black carbon aerosol pollution in this area, concludes the vertical sedimentation regularity of the concentration of black carbon aerosol to provide data support for the vertical distribution of the black carbon aerosol in air and for the settlement of the black carbon aerosol pollution, and to provide reference data for the combination of air combined pollution prevention and control in the city agglomerations in the middle of Yangtze River.
2.1. Data Sources and Analysis Methods
2.1.1. Research Area
Wuhan city, spanning from 113°41′ to 115°05′ east longitude, 29°58′to 31°22′ north latitude, is located in the Middle-lower Yangtze River Plain and the east of Jianhan Plain, a national central metropolitan of Central China, a sub-provincial city and the capital of Hubei Province, seen in Fig.1. Wuhan city belongs to the Subtropical humid monsoon climate zone, with a percentage of greenery coverage of 39.09% in built-up area and a forest cover rate of 27.31%. According to the environmental quality communiqué of Wuhan city, PM is the primary pollutant, and this paper studies the component of black carbon, one kind of PM.
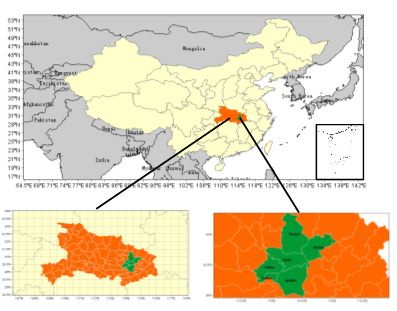
Fig1. The Location of the Studied Area
2.1.2 Data Sources
Data of wind speed, visibility, temperature and atmospheric pressure is from Wuhan Tianhe Station of The United States National Climatic Data Center, representing the conventional meteorological data in Wuhan city area and to be used in future analysis.
The WRF meteorological model is chosen as the meteorological driving field of CMAQ model, and the pollution source data demanded by the numerical computation of CMAQ is based on list of the regional air pollution source emission made by MeteoinfoLab and the source list files of 2012MEIC. The resolution of the emission space is 0.25×0.25, and the spatial extent is 40.125°E to 179.875°E, 20.125°N to 89.875°N.
2.1.3 Analysis Methods
1. WRF-CMAQ meteorological chemical coupling model
By combining Chinese MEIC model data and the MeteoInfo meteorological cartographic software, the spatial distribution of different emission source in different months is respectively drawn. In the process of dealing with data, the related functions in MeteoInfo base are called to open MEIC data, after which, the height dimension, longitude dimension and latitude dimension are fixed while time dimension is changed, and then the spatial distribution graph of the variation of the mass concentration of black carbon on industrial emission, settlement emission and traffic emission in different months.
In the after-treatment process, only the black carbon element(AECI+AECJ) in the output file, emulated by the WRF-CMAQ meteorological chemical coupling mode, is under treatment. The calculation of the trajectory data is from the reanalysis data of NCEP and the data of the Air Resources Laboratory of National Oceanic and Atmospheric Administration Bureau developed by the Juint 4.9 HYSPLIT. The daily meteorological data, downloaded from the HYSPLIT web and provided by GDAS from NCEP combines with the meteorological cartographic software to make an after-treatment analysis on the emulated result according to the practical demands.
This study uses 16 coarse meshes of CMAQ based on the terrain - following coordinate system, each of whose thickness is varied with the time. The meteorological input data and the geographical input data are pretreated to get the consistent input data with the set mesh distribution by the WRF model. The boundary condition and initial condition of the WRF model use defaults, and the initial mass concentration in the first day of a month is set as the emulated result of the first five days of that month.
2.PSCF Method
PSCF model, having been widely used to identify the possible source area where the pollutant of high concentration observed from the receiving sites comes, is a method based on the HYSPLIT model to confirm the source area. The function of PSCF is followed as:
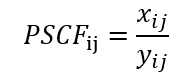
xij is the amount of the falling track endpoints in the mesh, and yij is the amount of the observed pollutant concentration which surpasses the threshold value of the chosen pollutant in the same mesh unit, while the threshold value is to limit local emission, lower than the value, and the regional transportation. In order to eliminate the uncertainty from the unit with minimum value, the PSCF value multiplies a random weight function yij to better reflect the uncertainty of the value of these units. When the amount of the endpoints of the special unit is less than three times the average of the endpoints of each unit, the weight function will lower the PSCF value.
3. Trajectory cluster analysis
Based on TrajStat software of GIS, the trajectory data was divided into different transport group and cluster to make analysis on trajectory cluster. One of the limitations of PSCF method is that when the sample concentration is a little higher or much higher than the standard, the mesh unit can have the same PSCF value. Therefore, it is hard to discriminate the weak source and the strong source. In CWT method, through dividing the average value of sample concentration equally, each mesh unit is distributed a weight concentration, which has related trajectory with mesh unit, and the formula is followed as:
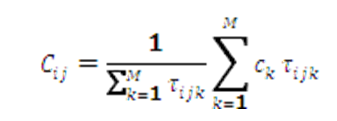
Cijis weight average concentration, Ck the observed concentration on the trajectory, τijk the trajectory DDd.
2.2. Analysis and Discussion
Under WRF-CMAQ model, Wuhan urban area is chosen as the horizontal study area, which is set as two-layered nested mesh by Lambert projection method, and the distance of horizontal meshes is 27km and 9km respectively, and on the vertical direction, the stepped terrain vertical coordination is used, which is divided into 16 layers. Seen in table 1, the top level is 0.2bar(that is 202hPa), 7,600m high from ground; the bottom level is 1.0bar(that is 1010hPa), 10m high from the ground.
Table 1. The Vertical Layer Information on Basis of WRF-CMAQ Model
|
layer |
1 |
2 |
3 |
4 |
5 |
6 |
7 |
8 |
|
Isobaric height /bar |
1.000 |
0.998 |
0.995 |
0.992 |
0.987 |
0.980 |
0.970 |
0.940 |
|
Height from ground/m |
10 |
30 |
60 |
70 |
120 |
190 |
300 |
600 |
|
layer |
9 |
10 |
11 |
12 |
13 |
14 |
15 |
16 |
|
Isobaric height /bar |
0.910 |
0.870 |
0.800 |
0.740 |
0.650 |
0.500 |
0.400 |
0.200 |
|
Height from ground/m |
900 |
1300 |
2000 |
2600 |
3500 |
4600 |
5600 |
7600 |
Treating all the data from July 2015 to June 2016 to get daily concentrations of black carbon aerosol at each height and compare the 16 daily average values from different height.
2.2.1. The Daily Variation Regularity of Black Carbon Sedimentation in Wuhan Urban Area
Because the orders of magnitude of the data among 16 layers have wide gaps, in order to make it convenient to compare data in one graph, the data at the 1st layer to 5th layer times 1,000, that at 6th to 11th layer 10,000, that at 12th layer 1,000,000, that at 13th to 15th layer 10,000,000 and that at 16th layer 100,000,000. The daily variation curve of the black carbon sedimentation value at each layer is seen in Fig.2, whose general regularity is that the concentration of black carbon decreases with height increasing.
From the variation trend, the daily variation trend of the concentration of black carbon at the 1st to 5th layer(that is less than 120m) is almost consistent, with little fluctuation; the fluctuation at 6th to 9th is increasing; at the 10th to 11th layer(that is 1,300m), with the largest fluctuation, the daily value of black carbon sedimentation is obviously different all year round, which is relatively lower from October to February; the daily variation trend at 12th to 16th layer is basically consistent, while the daily sedimentation value of black carbon fluctuates a lot and there is an obvious difference in the whole year’s daily value, the fluctuation of the sedimentation value of black carbon at the 12th layer is wider than that at 13th layer; the daily variation trend at 14th and 15th is consistent, and the daily sedimentation value of black carbon fluctuates a lot, especially at 14th layer, there is an obvious difference in the daily sedimentation value of black carbon, and the daily sedimentation value of black carbon fluctuates a lot at 16th layer where the whole year’s daily sedimentation value of black carbon is obviously different. From September, 2015 to March, 2016, daily sedimentation value of black carbon is relatively lower with little fluctuation, and from March, 2016 to June, 2016, the fluctuation of the daily sedimentation value of black carbon is showing an upward tendency.
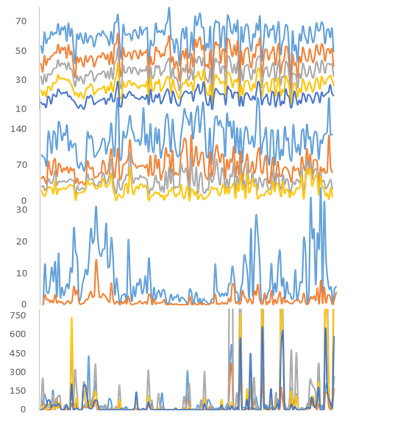
Fig.2 The Contrast of the Daily Variation of the Sedimentation of Black Carbon from the 1st to the 16th Layer in Wuhan Urban Area
In vertical direction, compared to the adjacent layers, abnormal variations happen at the 5th to the 6th layer, the 9th to the 10th layer, the 12th layer and the 14th layer.
2.2.2 The Seasonal Variation Regularity of the Sedimentation of Black Carbon in Wuhan Urban Area
There is little seasonal variation difference of the sedimentation concentration of black carbon from the 1st to the 9th layer, among which the 2nd layer has an abnormal sedimentation value in spring, much higher; and the sedimentation value at the 7th layer is abnormal in winter, much higher; and from the 10th to the 14th layer, the sedimentation concentration value of black carbon is highest in winter and spring, moderate in autumn and lowest in summer; and from the 15th to the 16th layer, spring is the highest, summer the second, autumn the third, and winter the lowest.
In vertical direction, compared to the adjacent layers, abnormal variations happen at the 2nd layer, the 6th to the 7th layer, the 9th to the 10th layer and the 14th to the 14th layer.
The air aerosol particles have to go through three totally different phases if they will be transported from a certain height to the ground and absorbed by the ground. The first phase is the transportation from boundary layer to laminar flow sub-layer, mainly controlled by turbulent activities; the second one is the transportation from laminar flow sub-layer to earth's surface, controlled by molecular thermal movement, belonging to Brownian movement; in the third phase, the air aerosol particles are adsorbed by the ground surface and disappear from the air, which is the final process of dry deposition. According to fig.2, beginning with 120m from the ground, the mass concentration of black carbon starts to decline to a basically stable value above 2,000m from the ground. It illuminates that at the range from 120m to 2,000m, the mass concentration of black carbon is rapidly decreasing, belonging the 2nd and the 3rd phase, which is composed of non - diffusion processes, respectively, turbulent diffusion and gravity sedimentation.
Among them, the saltation layers of the concentration variation of black carbon are the 2nd layer, the 5th layer to the 7th layer, the 9th layer to the 10th layer, the 12th layer and the 14th layer to the 15th layer, and the abnormal variation occurs at the height of 30m, 120m to 300m, 900m to 1,300m and 4,600m to 5,600m.
2.2.3 The Trajectory Cluster Analysis at Different Height
Based on the simulated concentration of black carbon at 16 layers from July, 2015 to June, 2016, this study deals with the air movement material of black carbon at different simulated layers through the HYSPLIT model and the TrajStat plugin of Meteoinfo Lab. And this paper divides the main trajectory clusters according to the consistence of each spatial distribution characteristic of trajectory, and makes statistical analysis on the arithmetic mean of the mass concentration of black carbon(ρ (BC)) corresponding to various trajectories to respectively get the air clustering trajectory figure at different heights.
After clustering analysis, it finds that in the 16 layers’ trajectory type, trajectory 1 and trajectory 2 has a large proportion. And trajectory 1 is the air transportation channel through Jiangsu Province, Anhui Province and other places to Hubei Province, representing the close local sources; and trajectory 2 is the air trajectory through the middle Pacific, Japan Islands, Jiangsu Province and Anhui Province to Hubei Province, representing the remote transportation channel of oceanic air. Conduct a statistic on the proportion variation of trajectory 1 and trajectory 2 at 16 layers, seen in fig.3, finding that the proportion variation of trajectory at the 3rd layer, the 7th layer, the 9th layer and the 12th is larger. It finds that the proportion of the remote source trajectory increases at different layers as the heights rise after comparing the proportion of remote source trajectory.
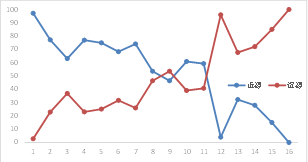
Fig.3 The Proportion Variation of Trajectory 1 and Trajectory 2 at Different Heights
According to the principle of the consistence of the spatial distribution characteristic of kinds of air trajectories and the minimum variability of the clustering trajectory, the air trajectory at different heights is made differentiated clustering. Comparing the number of clustered trajectories at different heights, it find that the number of trajectories at the 5th layer, the 7th layer and the 12th layer is 3, fewer than other layers.
At the height of 10m above sea level, the air trajectory(No.1 trajectory) from Zhejiang Province, Jiangxi Province and other places enjoys the largest mass concentration of black carbon, namely 0.0605ng/m³, accounting for 97.23% of the total number of trajectory; yet the mass concentration of black carbon of the air trajectory(No.2 trajectory) from the ocean is the lowest, namely 0.0598ng/m³, accounting for 2.77% of the total number of trajectory. From the above analysis, the No.2 air trajectory from the ocean, though through a long-distance oceanic transportation, must passes by Jiangsu Province, Zhejiang Province, Anhui Province and other regions with rather developed economy before arriving at Wuhan City, thus, it is apt to bring the industrial emission of this region and the man-made source from the regional emission, resulting in a high average value of ρ(BC) responding to the air trajectory; however, No.2 air trajectory, mainly the air trajectory at the height of 10m over sea level with a short-distance transportation, brings many man-made sources before reaching the destination, thus, No.1 trajectory, the horizontal transportation is the main transporting air of black carbon.
At the height of 30m above sea level, the air trajectory(No.1 trajectory), passing the Middle Pacific, Jiangsu Province, Anhui Province and other places before reaching Hubei Province, has the highest mass concentration of black carbon, that is 0.0499ng/m³, accounting for 7.32% of the amount of the clustering trajectories; and the air trajectory(No.5 trajectory) from the eastern Pacific has the lowest averaged mass concentration of black carbon, accounting for 1.52% of the total number of the clustering trajectories. It shows that, at 30m above the sea level, the No.1 trajectory from the middle Pacific, Jiangsu Province and Anhui Province brings the largest mass concentration of black carbon, whose main source comes from the industrial and man-made sources along its passing way. The No.2 air trajectory through Henan Province and Anhui Province to Hubei Province accounts for 54.46% of the total trajectories, being the main transportation trajectory of black carbon at this height, whose main polluted source comes from the industrial emission from the passing places like, Henan Province and Anhui Province, and the man-made emission from the densely inhabited districts.
At 60m above sea level, the air trajectory(No.3 trajectory) from Jiangxi Province to Hubei Province, whose averaged mass concentration of black carbon is 0.0365ng/m³, accounting for 56.55% of the total number of the air trajectories, is the main transporting trajectory of black carbon at the height of 60m.
At 70m above sea level, the air trajectory(No.6 trajectory) from the middle Pacific, through Jiangsu Province, Anhui Province and others to Hubei Province, has the highest averaged mass concentration of black carbon to 0.2641ng/m³, accounting for 2.88% of the total number of the air trajectories, whose main pollution source comes from the economically more developed regions like Zhejiang Province and Anhui Province, apt to bring the industrial emission source and the man-made emission from the regions on the passing way.
At 120m above sea level, the air trajectory(No.1 trajectory) from the ocean through the Southern Japan, and Jiangsu Province and Anhui Province to Hubei Province has the highest averaged mass concentration of black carbon to 0.1714ng/m³, accounting for 17.78% of the total number of the air trajectories; the No.3 air trajectory through Guangdong Province, Guizhou Province and Hunan Province to Hubei Province is the main air trajectory of the source of pollutants at the height of 120m, and the main source of the pollutants is the industrial emission source and the man-made emission from the regions on the passing way, however, affected by the diluting effect of the southwest monsoon, the averaged mass concentration of black carbon in Wuhan City is lower.
At 190m above sea level, the air trajectory(No.2 trajectory) from the Pacific passing through Jiangsu Province, Zhejiang Province and Jiangxi Province to Hubei Province has the highest averaged mass concentration of black carbon to 0.0148ng/m³, accounting for 1.4% of the total number of the air trajectories; the air trajectory(No.5 trajectory), whose averaged mass concentration of black carbon is 0.0122ng/m³, accounting for 29.5% of the total number of the air trajectories, is the main air trajectory of this layer, whose pollutants are mainly from the industrial emission in the Southeast Wuhan City and the man-made emission from the residential neighborhoods.
At 300m above sea level, the averaged mass concentration of black carbon of the air trajectory(No.3 trajectory) from the eastern Japan through Shanghai City, Zhejiang Province and Jiangxi Province to Hubei Province is the highest to 0.0136ng/m³, accounting for 16.85% of the total number of the air trajectories; the air trajectory(No.2 trajectory), through Jiangxi Province to Hubei Province accounts for 74.08% of the total number of the air trajectories.
At 600m above sea level, the air trajectory(No.5 trajectory) passing Hunan Province and Jiangxi Province to Hubei Province, accounting for 45.8% of the total number of the air trajectories, is the key air trajectory of the pollutant source at the height of 600m.
At 900m above sea level, the air trajectory(No.7 trajectory) through Anhui Province and Jiangxi Province to Hubei Province, accounting for 38.19% of the total number of the air trajectories, is the key air trajectory of the pollutant source at the height of 900m.
At 1300m above sea level, the averaged mass concentration of black carbon of the air trajectory(No.3 trajectory) through Jiangxi Province and Hunan Province to Hubei Province is the highest to 0.008ng/m³, accounting for 46.99% of the total number of the air trajectories, and the industrial emission along the passing way and the man-made emission result in higher mass concentration of black carbon.
At 2000m above sea level, the air trajectory (No.3 trajectory) through Shanghai City, Zhejiang Province and Jiangxi Province to Hubei Province, whose averaged mass concentration of black carbon is 0.00015ng/m³, accounting for 59.29% of the total number of the air trajectories, is the key air trajectory of the pollutant source at the height of 2000m.
At 2600m above sea level, the air trajectory (No.2 trajectory) through Fujian Province and Jiangxi Province to Hubei Province accounts for 74.65% of the total number of the air trajectories, being the key air trajectory of the pollutant source at the height of 2600m.
At 3500m above sea level, the air trajectory (No.3 trajectory) from the ocean and through Jiangxi Province and Hunan Province to Hubei Province accounts for 32.37% of the total number of the air trajectories, being the main air trajectory of the pollutant source at the height of 3500m.
At 4600m above sea level, the air trajectory (No.3 trajectory) from the middle Pacific and through Jiangsu Province and Anhui Province to Hubei Province has the highest averaged mass concentration of black carbon of 1.85E-04ng/m³, accounting for 13.29% of the total number of the air trajectories; the air trajectory (No.4 trajectory) through Shanghai City, Zhejiang Province and Jiangxi Province to Hubei Province, whose averaged mass concentration of black carbon is 0.0612ng/m³, accounting for 27.96% of the total number of the air trajectories, is the main air trajectory of the pollutant source at the height of 4600m.
At 7600m above sea level, the air trajectory (No.1 trajectory) from the ocean and through Japan, the Yellow Sea, Shanghai City, Jiangsu Province, Anhui Province to Hubei Province accounts for 33.53% of the total number of the air trajectories, being the main air trajectory of the pollutant source at the height of 7600m.
2.2.4 The Vertical Variation Regularity of Height Profile
After analyzing the height profile of the forward trajectory at the vertical direction of 120H, it finds that there is an obvious difference in the air mass variation arriving in Wuhan, seen in fig.5.
At the height layer of 10m, the averaged altitude height of No.1 trajectory and No.2 trajectory is respectively (867.89±534.79)m and (4073.38±2071.79)m. In general, the altitude of the air mass of No.2 trajectory is higher than that of No.1 trajectory, yet the averaged mass concentration of black carbon and the proportion of its trajectory to the total trajectory of No.2 trajectory are lower than No.1, which shows that at this height layer, the air mass resulting in the black carbon pollution in Wuhan area is mainly low-altitude transportation. And the air mass is mainly from Zhejiang Province, Jiangxi Province and other places with a short transporting channel and aggravates the pollution in Wuhan area, at the meanwhile, the air mass of No.2 trajectory from the middle Pacific has a longer channel and passes through Japan Sea, the Yellow Sea and other clean sea areas, casting less pollution to Wuhan area.
At the height layer of 30m, the averaged altitude of No.1 trajectory, No.2 trajectory, No.3 trajectory, No.4 trajectory, No.5 trajectory is respectively (2878.3±1729.65)m, (589.48±385.16)m, (1925.36±1260.23)m, (537.68±254.71)m, (4661.66±2096.21)m, among which No.2 trajectory and No.4 trajectory may be regarded as the major pollution trajectories. They respectively pass by Guangxi Province, Guizhou Province, Hunan Province, Jiangxi Province and other places, chiefly transporting pollutants of industrial pollution source and man-made pollutants like straw incineration, contributing more to the mass concentration of black carbon. While the other three trajectories are mainly from the ocean, and the air trajectory over 1900m passes by a longer transporting channel, so the pollutants gradually decrease and contribute less to the mass concentration of black carbon. At this height layer, the air mass air mainly transported by low-altitude, about 500m high.
At the height layer of 60m, No.3 trajectory and No.5 trajectory are the most important pollution trajectories, accounting a higher proportion of all the trajectories, and the altitude of the two trajectories is respectively (581.15±348.62)m, (691.485±272.07)m. On one hand, the air mass comes from the North and through Hebei Province and Henan Province and other places with more coal and biomass combustion, and then the pollutant is transported to Wuhan City. On the other hand, the air mass is from the South, through Hunan Province and other areas in possession of more developed nonferrous metallurgical industry, and then more pollutants are channeled into Wuhan City. And over the height of about 1,000m, the other trajectories has similar source and the sea transportation channels with the above ones, casting less effect on the mass concentration of black carbon.
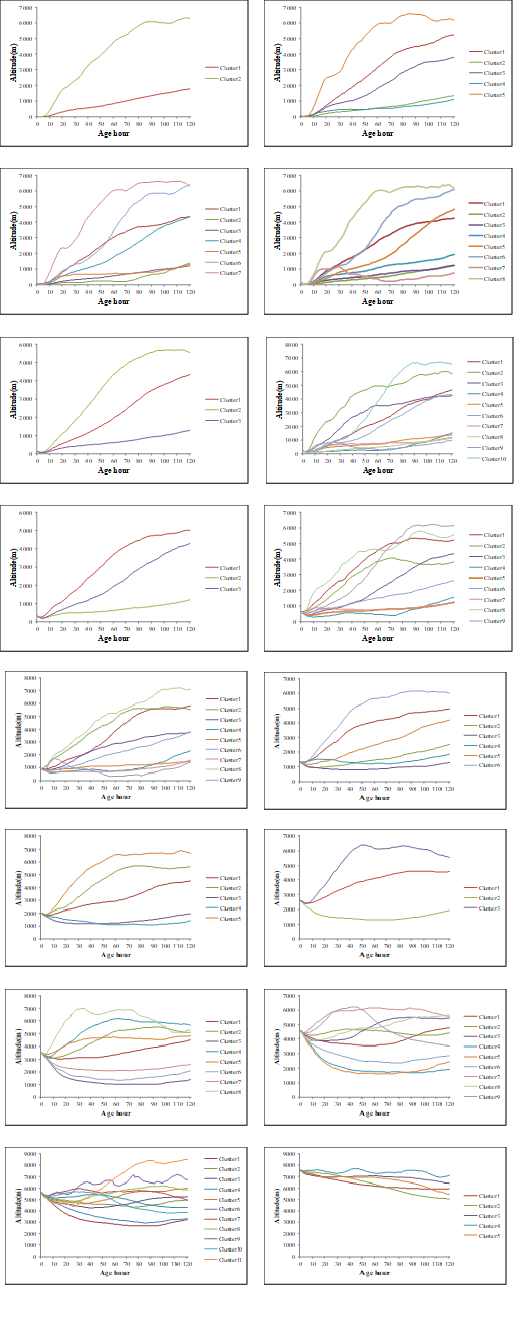
Fig.4 The Height Profile of the Forward Trajectory at Different Height 120H in Wuhan City
At the same time, by analyzing the height profile variations of the air trajectories at each height layers, it finds that from the first layer to the 16th layer, the general altitude of the major pollution trajectories at each height layer is increasing, which mainly comes from Hebei Province, Henan Province in the North, Guangdong Province, Fujian Province, Hunan Province and Jiangxi Province in the South, Zhejiang Province, Jiangsu Province, Anhui Province and other places in the East with a rather shorter transportation channel, apt to transport the industrial emission source and the man-made emission source to make Wuhan Area polluted by black carbon. The other trajectories are from the Pacific with a long distance transportation channel, fairly affected by maritime airstream and contributing little to the pollution of black carbon. And from the first layer to the 7th layer, the height of key air trajectories is between 500m and 700m, and the height of key air trajectories from the 8th layer to the 13th layer is between 800m and 1,800m, and starting from the 14th layer, the height of key air trajectories varies abnormally and intensely, from 3,000m shooting up to 6,400m. In general, the black carbon pollution in Wuhan is principally transported by short distance, and from the 1st layer to the 13th layer, it is impacted more seriously by the low air mass between 500m and 1,800m, while from the 14th layer to the 16th layer, it is influenced more by the high air mass between 3,000m and 6,400m.
The trajectory cluster can represent the horizontal characteristics of the air pollutant concentration affected by a certain kind of airstream at a certain height, and distribute the number of the trajectories in each cluster, their responding concentration of black carbon, and describe the consistency of the spatial distribution characteristics of each trajectory.
(1) There is a spatio-temporal distribution characteristic. Spatially, the mass concentration of black carbon aerosol is decreasing from lower height to higher height with the height increasing. Temporally, the daily variation tend of mass concentration of black carbon from the 1st layer to the 5th layer(that is under 120m) is almost consistent, with a small fluctuation. The fluctuation amplitude at the 6th layer and the 7th layer and the fluctuation amplitude at the 8th layer and the 9th layer is bigger after being compared, and the sedimentation concentration of black carbon aerosol at each layer is decreasing with the height increasing; the up-and-down fluctuation amplitude at the 10th layer(that is 1,300m) is bigger, and the daily average value of the yearly black carbon aerosol sedimentation is varying obviously. In addition, at seasonal distribution, the average value of black carbon aerosol sedimentation in four seasons at each height has an unobvious difference, and it is a bit higher in winter than that in the other three seasons.
(2) The analysis results on trajectory pollution characteristics show, during the study phase, the trajectory distribution at different heights takes on isotonicity and co-originality. And there are four key transportation channel: the 1st one is from the eastern Pacific through the middle Pacific, Japan, East China Sea, Zhejiang Province and Anhui Province to Wuhan; the 2nd one comes from the northern China, through Hebei Province and Henan Province going down to the South; the 3rd one comes from Indo-China Peninsula, through South China Sea, Guangxi Province, Guizhou Province, Hunan Province and going up to the north to Wuhan; the 4th one is originated from Taiwan(China), through Fujian Province, Jiangxi Province and other places to Wuhan. Among them, the trajectory from the Pacific is affected by marine moist airstream, taking a lower proportion of the total number of trajectories, and its trajectory transportation distance is loner, with a faster speed. Yet the trajectories from the other directions accounts for a larger proportion, with a short transportation distance and a slower speed. Specially, at the two height layers of 5,600m and 7,600m, the air trajectory from the ocean takes a larger proportion of the total trajectories, and the most distant origination is from the Arctic Ocean, Canada and other places which shows that at a certain height, that is over 5,600m, Wuhan area is widely influenced by the global large-scale airstream trajectory.
(3) Through the analysis on the height profile, the responding number of clustering trajectory cluster of the 16 height layers is respectively 2, 5, 7, 8, 3, 10, 3, 9, 9, 6, 5, 3, 8, 9, 11, 5. And the number trajectory on vertical direction is generally in an increasing trend from the lower height to the higher height, yet at the 5th, 7th, and the 12th layer are obvious saltation layers. At the same time, contrasting the proportion variation of No.1 and No.2 trajectory at different layers, it can be seen that the 2nd, 4th, 7th and 12th trajectory are saltation layers, yet the difference reason at the nearside of 10m is related with the existence of only two trajectory distribution. Generally speaking, the 7th layer and the 12th layer, namely at the height of 300m and 2,600m, are the crucial saltation layers of the trajectories on the vertical direction.
In brief, the black carbon pollution in Wuhan area is mainly based on short distance transportation, and from the 1st layer to the 13th layer, it is widely affected by the low air mass between 500m and 1,800m, yet from the 14th layer to the 16th layer, it is influenced a lot by the high air mass between 3,000m and 6.400m.
Supported by the National natural science foundation project (No. 41401559)
Cao J J, Lee S C, Ho K F, et al. Spatial and seasonal variations of atmospheric organic carbon and elemental carbon in Pearl River Delta Region, China[J]. Atmospheric Environment, 2004, 38(27):4447-4456.
View ArticleHighwood E J, Kinnersley R P. When smoke gets in our eyes: The multiple impacts of atmospheric black carbon on climate, air quality and health [J]. Environment International, 2006, (32):560-566. PMid:16513170
View Article PubMed/NCBIGelencs r A. Carbonaceous Aerosol[M]. New York: Springer Verlag, 2005.
Streets D G, Gupta S, Waldhoff S T, et al. Black carbon emissions in China[J]. Atmospheric Environment. 2001,35:4281-4296. 00179-0
View ArticleDerwent, R G, Ryall, D B, Jennings, S G, Spain, T G, Simmonds, P G. Black carbon aerosol and carbon monoxide in European regionally polluted air masses at Mace Head, Ireland during 1995e1998[J]. Atmospheric Environment, 2001, 35, 6371-6378. 00394-6
View ArticleDickerson, R R, Andreae, M O, Campos, T, Mayol-Bracero, O L, Neusuess, C, Streets, D G, 2002. Analysis of black carbon and carbon monoxide observed over the Indian Ocean: implications for emissions and photochemistry[J]. Journal of Geophysical Research 107 (D19), 8017.
View ArticleSharma, S, Lavoue, D, Cachier, H, Barrie, L A, Gong, S L, 2004. Long-term trends of the black carbon concentrations in the Canadian Arctic[J]. Journal of Geophysical Research 109, D15203.
View ArticleZhuang B L, Wang, T J, Liu J, et al. Continuous measurement of black carbon aerosol in urban Nanjing of Yangtze River Delta, China[J]. Atmospheric Environment, 2014 (89):415-424.
View Articlezhang Xiaolin, Rao Ruizhong, Huang Yinbo, et al. Black carbon aerosols in urban central China[J]. Journal of Quantitative Spectroscopy & Radiative Transfer, 2015 (150):3-11.
View ArticleCape, J N, Coyle, M, Dumitrean, P. The atmospheric lifetime of black carbon[J]. Atmospheric Environment 2012,59:256-263. Junge C E. Air Chemistry and Radioactivity[M]. NewYork: Academic Press, 1963.
View ArticleZhu Houling. Spatial and Temporal Distribution of Black Carbon Aerosol in China [D].Beijing: Chinese Academy of Meteorological Sciences master's degree thesis.2013.
Ding A. J, Huang X, Nie W, et al. Enhanced haze pollution by black carbon in megacities in China. Geophys. Res. Lett, 2016,43:2873-2879
View ArticleDeping Li, Jianguo Liu, Jiaoshi Zhang , et al. Identification of long-range transport pathways and potential sources of PM2.5 and PM10 in Beijing from 2014 to 2015[J]. Journal of Environmental Sciences. 2017, 56:214-229 PMid:28571857
View Article PubMed/NCBIWang Aiping, Zhu Bin, Yin Yan,et al. Summer Aerosol Concentration Characteristics of Huangshan Top and Its Potential Source Transportation [J]. Chinese Environmental Science,2014,34(4):852-861.
WANG Y Q, ZHANG X Y, ARIMOTO R. The contribution from distant dust sources to the atmospheric particulate matter loading at Xi'an, China during spring[J]. Science of the Total Environment,2006,368:875-883. PMid:16677688
View Article PubMed/NCBIZhao Shuyun, Zhi Xiefei,Zhang Hua, et al. Preliminary Assessment of Climatic Simulation of Aerosol-Climate Coupling Model System BCC_AGCM2.0.1_CAM [J]. Climate and Environment Studies,2014,19(3):265-277.
Pi Zikun, Jia Yangui, Gong Fuqiang, et al. Simulation of atmospheric nitrogen wet deposition in Dalian based on CMAQ model [J]. Journal of Environmental Science,2014, 34(12) :3112-3118.
Ma Xin, Chen Dongsheng, Wen Wei, et al. Using WRF-chem to explore the impact of aerosol pollution on regional meteorological elements [J].北Journal of Beijing University of Technology, 2016,2:285-295.
Jiang C, Wang H, Zhao T, et al. Modeling study of PM2.5 pollutant transport across cities in China's Jing-Jin-Ji region during a severe haze episode in December 2013[J]. Atmos. Chem. Phys, 2015,15:5803-5814.
View Article