Yuping Yang, Qi Li, Jiawei Han
Municipal Experimental Teaching Demonstration Center of Environmental and Municipal Engineering, Tianjin Key Laboratory of Water Quality Science and Technology, Tianjin Chengjian University, Tianjin 300384
© 2019 Sift Desk Journals. All Rights Reserved
VOLUME: 4 ISSUE: 6
Page No: 741-748
Yuping Yang, Qi Li, Jiawei Han
Municipal Experimental Teaching Demonstration Center of Environmental and Municipal Engineering, Tianjin Key Laboratory of Water Quality Science and Technology, Tianjin Chengjian University, Tianjin 300384
Jianchao Wang(152312137@csu.edu.cn)
Yuping Yang, Qi Li, Jiawei Han, The enhanced hydrolysis process of mixture of sludge and protein kitchen waste by sodium hypochlorite to release more organic matter(2019)Journal of Earth Sciences & Environmental Studies 4(6)
The hydrolysis is a process of the mixtures of sludge and protein kitchen waste in a mixing ratio of 1:1 could be enhanced by adding sodium hypochlorite, releasing much more organic matter -than only sludge. Lab-scale sequential groups were operated with various concentrations of sodium hypochlorite (1.00 mg/g Total Solids (TS)5.00 mg/g TS, 15.00 mg/g TS, 25.00 mg/g TS, 50.00 mg/g TS and contrast blank group of concentration 0.00 mg/g TS) during 7 days of reaction. With the sodium hypochlorite concentration of 50 mg/g TS, the maximum released quantities of organic matter such as Soluble Chemical Oxygen Demand (SCOD), Protein (SPN) and Soluble Polysaccharide (SPS) by the mixtures of sludge and protein kitchen waste were 4.7, 3.6 and 1.9 times, respectively, compared to the only sludge hydrolysis. At the same time, it was 1.4, 2.3 and 1.2 times more than the controlled blank group for Soluble Chemical Oxygen Demand, Soluble Protein and Soluble Polysaccharide, respectively. However, sodium hypochlorite inhibited the release of Volatile Fatty Acid (VFA) from the sludge and mixture of sludge and protein kitchen waste.
Keyword:sludge, protein kitchen waste, sodium hypochlorite, organic matter
Mixed treatment and disposal of sewage sludge and municipal solid waste are useful and one of the development trends of large-scale and centralized utilization of municipal solid waste. The hydrolysis and fermentation of the mixtures of sludge and kitchen waste are more conducive to the dissolution and release of organic matter(Ara, Sartaj et al. 2014, Fitamo, Boldrin et al. 2016, Edwards, Othman et al. 2017). The abundant organic matter in the kitchen waste can make up for the lack of organic matter during the anaerobic fermentation process of the separate sludge, which will contribute to acid production process in the subsequent fermentation(Zhu, Parker et al. 2008, Min, Khan et al. 2010, Dong-Hoon, Sang-Hyoun et al. 2011). In recent years, the scale of urban sewage treatment plants has been continuously expanded, and sewage treatment capacity has been improved. A large amount of sewage sludge has also been produced. Besides, it was estimated that the total amount of municipal kitchen waste will exceed 9.5 billion/year by 2050 (Pham, Kaushik et al. 2015). Studies have shown that protein content accounted for about 16.7%. It can be seen that protein kitchen waste accounted for a relatively high proportion of kitchen waste and was rich in organic matter such as protein.
A previous study showed that adding excess sludge to kitchen waste was beneficial to substrate degradation and microbial germination, promoted a significant increase in hydrogen production in the whole system, as well as accelerated the entire reaction time(Kim, Kim et al. 2011). Hydrolysis of sludge and kitchen waste in a mixing ratio of 1:1 would increase the acid production of the system, and also improve the pH adaptability of microorganisms in the system to the environment(Zhu, Parker et al. 2008).
After pretreatment, the mixtures of sludge and kitchen waste could release more organic matter(Li, Chen et al. 2015, Li and Jin 2015, Tang, Wang et al. 2016). The effects of the fermentation of excess sludge was studied during different pH values at room temperature. The results showed that the excess sludge was more easily hydrolyzed under alkaline conditions. And the acid production was higher than acidity and neutrality(Chen, Jiang et al. 2007). Wang et al. showed that 3 days of treatment was sufficient for subsequent methane production with hyperthermophilic pretreatment, in which the highest dissolution of particulate Soluble Chemical Oxygen Demand (SCOD), Soluble Protein (SPN) and Soluble Polysaccharide (SPS) was 25.6%, 33.6% , and 25.0%, respectively(Wang, Hidaka et al. 2014). Oxidants also have a prominent influence on the release of organic matter. Indicated that ozonation significantly reduced the production of excess sludge and increased the organic matter content in the sludge(Alessandra and Vincenzo 2013). Also, potassium permanganate was beneficial to crack sludge and especially protein could flow outs cell, then the contents of SCOD were increased by 3.47 times(Wu, Zhang et al. 2014). Electrochemical and sodium hypochlorite combination pretreatment enhanced anaerobic digestion of waste activated sludge and increased methane content(Yuan, Bao et al. 2016). Chlorine-containing oxidants were a common oxidant, but little literature reported those oxidants for fermentation pre-treatment of mixtures of sludge and protein kitchen waste.
This study focused on the release of organic matter from SCOD, SPS and SPN on the mixtures of sludge and protein kitchen waste after different concentrations of sodium hypochlorite treatment. The acid production of mixtures of sludge and protein after sodium hypochlorite treatment was also studied. Results showed that the dissolution of organic matter enhanced the degradation, recovery, and utilization of the sludge and protein kitchen waste.
2.1 Characteristics of the sludge
The sludge was obtained from the secondary sedimentation tank of a municipal wastewater treatment plant in Tianjin, China. After the sludge was retrieved for 24 hours, the supernatant was removed and then stored at 4 °C before the test. The characteristics of the inoculum sludge are listed in Table 1.
Table 1. Characteristics of the initial sludge
|
pH |
TCOD (Total Chemical Oxygen Demand) (mg/g TS(Total Solids)) |
SCOD mg/gTS |
SPS mg/g TS |
SPN mg/g TS |
TS (total solids) (%) |
|
6.0±0.1 |
934.07±0.2 |
3.49±0.3 |
0.40±0.1 |
2.50±0.9 |
1.92±0.6 |
2.2 Characteristics of the protein kitchen waste
Tofu was high-protein foods with high digestibility. Therefore, protein waste was prepared by using common soybean tofu, which was hand-made tofu purchased from the market, following by crushing into a slurry by a food pulverizer and mixing with sludge. The characteristics of the mixtures are listed in Table 2.
Table 2. Characteristics of the initial kitchen protein waste
|
pH |
TCOD mg/g TS |
SCOD mg/gTS |
SPS mg/g TS |
SPN mg/g TS |
TS (%) |
|
5.9±0.1 |
1572.16±0.2 |
77.91±0.3 |
3.01±0.1 |
7.76±0.9 |
3.26±0.6 |
2.3 Characteristics of the mixtures of sludge and protein kitchen waste
The characteristics of the mixtures of sludge and protein kitchen waste in a mixing ratio of 1:1 are listed in Table 3.
Table 3. Characteristics of the mixtures of sludge and protein kitchen waste
|
pH |
TCOD mg/g TS |
SCOD mg/gTS |
SPS mg/g TS |
SPN mg/g TS |
TS (%) |
|
5.9±0.1 |
1175.75±0.2 |
73.64±0.3 |
2.91±0.1 |
8.09±0.9 |
3.30±0.6 |
2.4. Fermentation of waste mixture
In this study, the two substrates were single sludge and the mixtures of sludge and protein kitchen waste, which consisted of sludge (50 % TS) and protein kitchen waste (50 % TS) (Wang, Li et al. 2015). Lab-scale groups were operated in 500 mL conical flasks with various concentrations of sodium hypochlorite (flask #2-#6 dosing with 1.00 mg/g TS, 5.00 mg/g TS, 15.00 mg/g TS, 25.00 mg/g TS, and 50.00 mg/g TS, respectively) and contrast blank group (flask #1, 0.00 mg/g TS). To maintain a stable pH (8.0), HCl (2 mol/L) and NaOH (2 mol/L) were used to adjust the pH of the sludge samples during the initial hydrolysis process. The hydrolysis was performed under the conditions of 150 r/min and 35 ℃ after the conical flask was sealed with gauze and placed in the shaker. The hydrolysis broth (10 mL) at days 1, 3, 4, 5 and 7 were taken for further analysis.
2.5. Analytical methods
The extracted hydrolysis sample was centrifuged at 11,000 r/min, following by passing through a 0.45 μm membrane filter. The analyses of SCOD were conducted by Standard Methods. SPN and SPS were determined by the Lowry-Folin method (λabs = 500 nm) and anthrone method (λabs = 625 nm). VFAs were measured with gas chromatography (GC-500, Perkin Elmer, Norwalk, CT, USA). All other parameters were obtained according to the standard methods for the examination of water and wastewater(Yuan, Yang et al. 2018).
3.1 Effect of sodium hypochlorite on SCOD
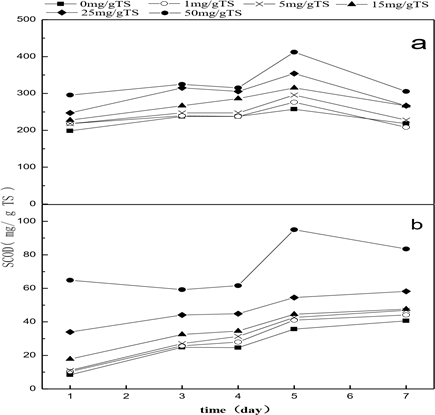
Figure 1. The mixtures of sludge and protein kitchen waste (a) and sludge only (b). Under different sodium hypochlorite concentrations, SCOD content changed along with the fermentation process.
Table 4. SCOD of the mixtures of sludge and protein kitchen waste accounted for TCOD percentage with hydrolysis time, when the sodium hypochlorite concentration was 50 mg/g TS.
|
Time (day) |
1 |
3 |
4 |
5 |
7 |
|
SCOD (mg/g TS) |
295.8 |
324.8 |
315.2 |
412.1 |
305.5 |
|
SCOD/TCOD (%) |
25.2 |
27.6 |
26.8 |
35.0 |
26.0 |
From figure 1, the concentration change of SCOD in only sludge and the mixtures of sludge and protein kitchen waste showed the same trend. As the addition of sodium hypochlorite and prolonged hydrolysis time, the concentration of SCOD increased. On the fifth day of hydrolysis with the sodium hypochlorite concentration of 50 mg/g TS, the produced amount of SCOD by the hydrolysis of the mixtures of sludge and protein kitchen waste were 1.6 times more than the one without sodium hypochlorite, and 4.7 times more than that of only sludge hydrolysis. When the sodium hypochlorite concentration was 50 mg/g TS, the percentage of SCOD to TCOD with hydrolysis time increases was shown table 4. It was obvious that hydrolysis time increases promoted the release of organic matter during hydrolysis of the mixtures of sludge and protein kitchen waste. The maximum released quantities of SCOD accounted for 35.0 % of TCOD, but most of SCOD accounted for 25 %~28 % TCOD.
Lin Y et al. reported that the SCOD of paper sludge improved as sodium hydroxide solution increased from 0% to 1.2% (alkali pretreatment)(Lin, Wang et al. 2010). When the mixtures of sludge and protein kitchen waste added sodium hypochlorite, SCOD also gradually increased. The main reason may be that sodium hypochlorite was alkaline in water. And the alkalinity was stronger as the concentration of sodium hypochlorite increases. According to the literature, adjusting the excess sludge to alkaline and prolonging anaerobic fermentation was beneficial to the formation of SCOD. The ratio of SCOD/TCOD also revealed a large amount of potential COD released.
3.2 Effect of sodium hypochlorite on SPN and SPS
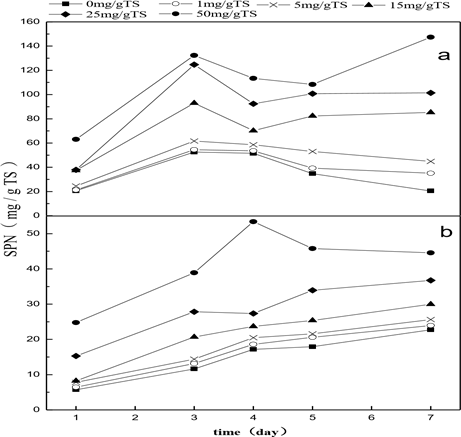
Figure 2. The mixtures of sludge and protein kitchen waste (a) and sludge only (b). Under different sodium hypochlorite concentrations, the SPN content changed along with the fermentation.
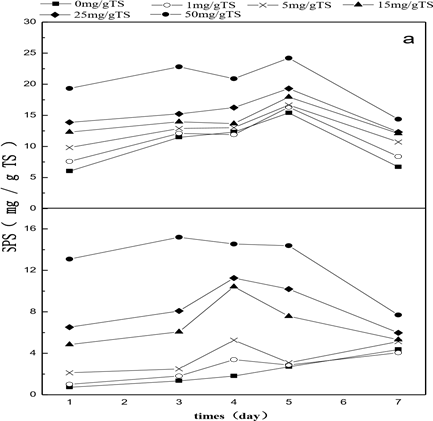
Figure 3. The mixtures of sludge and protein kitchen waste (a) and sludge only (b). Under different sodium hypochlorite concentrations, the SPS content changed along with fermentation time.
Table 5. SPS and SPN content of single sludge and the mixtures of sludge and protein kitchen waste were released, when the sodium hypochlorite concentration was 0mg/g TS and 50 mg/g TS and fermentation time was 1 day and 5 days.
|
|
|
SPN (mg/g TS) |
|
|
SPS (mg/g TS) |
|||
|
0 (mg/g TS) |
50 (mg/g TS) |
one day |
5 days |
0 (mg/g TS) |
50 (mg/g TS) |
one day |
5 days |
|
|
The mixtures of sludge and |
34.75 |
108.33 |
20.58 |
34.75 |
15.39 |
24.3 |
6.03 |
15.73 |
|
protein kitchen waste |
|
|
|
|
|
|
|
|
|
Single sludge |
17.95 |
41.62 |
5.72 |
17.95 |
2.19 |
12.78 |
0.72 |
2.69 |
In the first step of hydrolysis, particulate compounds were firstly converted to soluble forms (proteins, polysaccharides, etc.) and further hydrolyzed to simple monomers(Wahidunnabi and Eskicioglu). From table 5, when the sodium hypochlorite concentration was 0 mg/g TS and 50 mg/g TS and fermentation time was 5 days. First, the SPN content of the mixtures of sludge and protein kitchen waste and single sludge increased from 34.75, 17.95 to 108.33, 41.62 mg/g TS, respectively. Secondly, the SPS content of the mixtures of sludge and protein kitchen waste and single sludge increased from 15.39, 2.69 to 24.30, 12.78 mg/g TS, respectively. When fermentation time was one day and 5 days and sodium hypochlorite didn’t add. First, compared to the first day of hydrolysis, the SPN content of the mixtures of sludge and protein kitchen waste and single sludge improved from 20.58, 5.72 to 34.75, 17.95 mg/g TS, respectively. Secondly, the SPS content of the mixtures of sludge and protein kitchen waste and single sludge improved from 6.03, 0.72 to 15.93, 2.69 mg/g TS, respectively. At the same time, on the fifth day of hydrolysis and the dosage was 50 mg/g TS, the SPN and SPS of the mixtures of sludge and protein kitchen waste were 2.6, 1.9 times larger than only sludge hydrolysis, respectively.
Soluble carbohydrates and soluble proteins were important constituents of SCOD. With the aid of sodium hypochlorite, soluble carbohydrates and soluble proteins had a similar change trend with SCOD. Sodium hypochlorite was a disinfectant which had strong oxidizing property because sodium hypochlorite formed highly oxidizing hypochlorous acid in water(OKULL, DEMIRCI et al. 2006, Ponzano 2007). The cell membrane and the microbial cell wall were destroyed by hypochlorite acid, then the cell wall-embedded and the cell-containing inclusion proteins and polysaccharide entered the liquid phase, thereby improving the protein and polysaccharide content in the liquid phase. On the other hand, the main reason might be that the surface of the sludge particles had a negative charge. When the pH of the sludge raised, the negative charge on the surface of the mud granule cells also gradually increased, resulting in high electrostatic repulsion. As a result, part of the extracellular polymer (ECP) was resolved (the main components of ECP were proteins and carbohydrates, etc.) (Katsiris and Kouzeli-Katsiri 1987). In the initial stage of the reaction from the first to the fifth day, the particulate matter was converted into SPN and SPS by the extracellular enzyme catalysis. The fermentation process was in the rising stage since the formation rate of SPS and SPN was greater than the conversion rate. Under the same hydrolysis conditions, the sludge added protein kitchen waste produced more soluble protein.
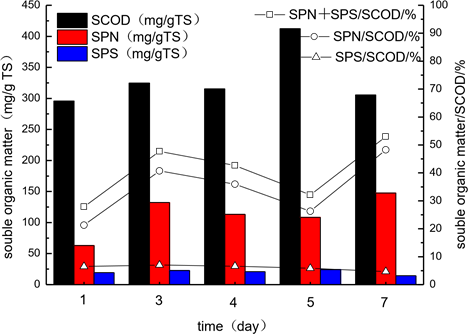
Figure 4. Soluble protein and soluble polysaccharide of the mixtures of sludge and protein kitchen waste accounted for SCOD percentage with hydrolysis time increases, when sodium hypochlorite concentration was 50 mg/g TS.
When sodium hypochlorite concentration was 50 mg/g TS, the effect of different hydrolysis time on the content of dissolved proteins, carbohydrates in the mixtures of sludge and protein kitchen waste was showed in figure 4. Soluble protein was released more in SCOD, followed by soluble polysaccharide. The dissolved protein content increased from 21.3 % first day to 40.7 % on the third day. After a short decrease, it reached a maximum of 48.2 % on the seventh day. However, the change of dissolved carbohydrates concentration was not much.
It could be seen that the content of dissolved substances in these SCOD was increased first and then decreased. The main reason was that various dissolved substances were formed during the hydrolysis of the mixtures of sludge and protein kitchen waste. At the same time, there also were different ways of consumption, such as VFAs produced by soluble proteins and carbohydrates with the aid of acid enzymes and microorganisms. Therefore, when the rate of consumption of dissolved substances (SPS and SPN) exceeded the rate of production, the percentage of the sum of the two was reduced.
3.3. Effect of sodium hypochlorite on VFA
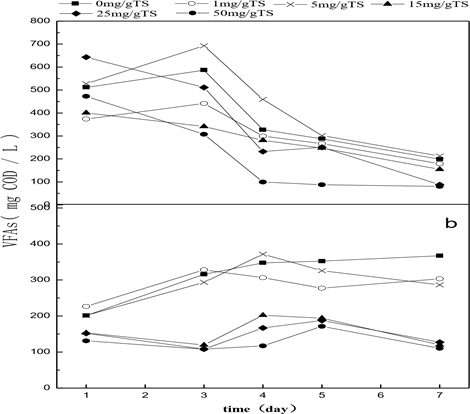
Figure 5. The mixtures of sludge and protein kitchen waste (a) and sludge only (b). Under different sodium hypochlorite concentrations, the VFA content changed along with the fermentation time
On the third day of hydrolysis, the amount of VFA produced by the mixtures of sludge and protein kitchen waste decreased from 692.93 to 307.2 mg COD/L along with the increased concentration of sodium hypochlorite (from 5 mg/g TS to 50 mg/g TS, figure 5). The amount of VFA produced by the sludge group also decreased from 287.79 to 105.91 mg COD/L.
Cells have died because high concentrations of sodium hypochlorite generated a lot of salt, which changed cells’ osmotic pressure (Feijoo, Soto et al. 1995, Elefsiniotis and Wareham 2007). Moreover, it also hindered the acidification rate. According to the results of related studies, sodium hypochlorite was a disinfectant which had strong oxidizing property due to the formation of highly oxidizing hypochlorous acid in water(OKULL, DEMIRCI et al. 2006). Sodium hypochlorite made the protein deform it.
In this study, the higher sodium hypochlorite was added, the better SPS, SPN and SCOD was released. When the concentration was 50 mg/g TS, it was significantly higher than other concentrations of organic matter released.In addition, according to the characteristics of organic substances, the hydrolysis time required for the maximum value of each organic substance was inconsistent. On the fifth day of hydrolysis, SCOD reached a maximum of 412.1 mg/g TS, accounting for 35.0% of TCOD. SPN got a maximum of 147.4 mg/g TS on the seventh day of hydrolysis, accounting for 48% of SCOD. And SPS obtained the maximum 24.2 mg/ g TS on the fifth day of hydrolysis, accounting for 6% of SCOD. Likewise, sodium hypochlorite didn‘t promote VFAs production.
The authors would like to thank National Science and Technology major projects in the "13th Five-Year Plan" of China (No. 2017ZX07107-002-04).
Alessandra, C. and B. Vincenzo (2013). "Sonolysis and ozonation as pretreatment for anaerobic digestion of solid organic waste." Ultrasonics Sonochemistry 20(3): 931-936. PMid:23231941
View Article PubMed/NCBIAra, E., ., M. Sartaj, . and K. Kennedy, . (2014). "Effect of microwave pre-treatment of thickened waste activated sludge on biogas production from co-digestion of organic fraction of municipal solid waste, thickened waste activated sludge and municipal sludge." Waste Manag Res 32(12): 1200-1209. PMid:25398411
View Article PubMed/NCBIChen, Y., S. Jiang, H. Yuan, Q. Zhou and G. Gu (2007). "Hydrolysis and acidification of waste activated sludge at different pHs." Water Research 41(3): 683-689. PMid:16987541
View Article PubMed/NCBIDong-Hoon, K., K. Sang-Hyoun, K. Hyun-Woo, K. Mi-Sun and S. Hang-Sik (2011). "Sewage sludge addition to food waste synergistically enhances hydrogen fermentation performance." Bioresource Technology 102(18): 8501-8506. PMid:21571523
View Article PubMed/NCBIEdwards, J., M. Othman, E. Crossin and S. Burn (2017). "Anaerobic co-digestion of municipal food waste and sewage sludge: A comparative life cycle assessment in the context of a waste service provision." Bioresource Technology 223: 237-249. Elefsiniotis, P. and D. G. Wareham (2007). "Utilization patterns of volatile fatty acids in the denitrification reaction." Enzyme & Microbial Technology 41(1): 92-97. Feijoo, G., M. Soto, R. Méndez and J. M. Lema (1995). "Sodium inhibition in the anaerobic digestion process: Antagonism and adaptation phenomena." Enzyme & Microbial Technology 17(2): 180-188. 00011-F
View ArticleFitamo, T., A. Boldrin, K. Boe, I. Angelidaki and C. Scheutz (2016). "Co-digestion of food and garden waste with mixed sludge from wastewater treatment in continuously stirred tank reactors." Bioresour Technol 206: 245-254. PMid:26866760
View Article PubMed/NCBIKim, D. H., S. H. Kim, H. W. Kim, M. S. Kim and H. S. Shin (2011). "Sewage sludge addition to food waste synergistically enhances hydrogen fermentation performance." Bioresource Technology 102(18): 8501-8506. PMid:21571523
View Article PubMed/NCBILi, X., Y. Chen, S. Zhao, H. Chen, X. Zheng, J. Luo , and Y. Liu (2015). "Efficient production of optically pure l -lactic acid from food waste at ambient temperature by regulating key enzyme activity." Water Research 70(5): 148-157. PMid:25528545
View Article PubMed/NCBILi, Y. and Y. Jin (2015). "Effects of thermal pretreatment on acidification phase during two-phase batch anaerobic digestion of kitchen waste." Renewable Energy 77: 550-557.
View ArticleLin, Y., D. Wang, S. Wu and C. Wang (2010). "Alkali pretreatment enhances biogas production in the anaerobic digestion of pulp and paper sludge." Waste Management & Research 170(1): 366-373. PMid:19464792
View Article PubMed/NCBIMin, K. S., A. R. Khan, M. K. Kwon, Y. J. Jung, Z. Yun and Y. Kiso (2010). "Acidogenic fermentation of blended food-waste in combination with primary sludge for the production of volatile fatty acids." Journal of Chemical Technology & Biotechnology Biotechnology 80(8): 909-915.
View ArticlePham, T. P. T., R. Kaushik, G. K. Parshetti, R. Mahmood and R. Balasubramanian (2015). "Food waste-to-energy conversion technologies: Current status and future directions." Waste Management 38: 399-408. PMid:25555663
View Article PubMed/NCBITang, J., X. Wang, Y. Hu, Y. Zhang and Y. Li (2016). "Lactic acid fermentation from food waste with indigenous microbiota: Effects of pH, temperature and high OLR." Waste Manag 52: 278-285. PMid:27040090
View Article PubMed/NCBIWang, F., T. Hidaka and J. Tsumori (2014). "Enhancement of anaerobic digestion of shredded grass by co-digestion with sewage sludge and hyperthermophilic pretreatment." Bioresource Technology 169(5): 299-306. PMid:25062542
View Article PubMed/NCBIWu, C., G. Zhang, P. Zhang and C. C. Chang (2014). "Disintegration of excess activated sludge with potassium permanganate: Feasibility, mechanisms and parameter optimization." Chemical Engineering Journal 240(6): 420-425.
View ArticleYuan, H., Y. Bao, P. Cheng, N. Zhu, C. Yin , and Y. Ling (2016). "Pilot-scale study of enhanced anaerobic digestion of waste activated sludge by electrochemical and sodium hypochlorite combination pretreatment." International Biodeterioration & Biodegradation 110: 227-234.
View ArticleYuan, H., Y. Yang, J. Yuan, Y. Wang, Y. Song, J. Lu and J. Song (2018). "Improved sludge dewaterability and hydrolysis performance after pretreatment with Fenton's reagent." Water Science & Technology A Journal of the International Association on Water Pollution Research 77(1): 204. PMid:29339619
View Article PubMed/NCBIZhu, H., W. Parker, R. Basnar, A. Proracki, P. Falletta, M. Béland and P. Seto (2008). "Biohydrogen production by anaerobic co-digestion of municipal food waste and sewage sludges." International Journal of Hydrogen Energy 33(14): 3651-3659.
View Article