Li Tian
Qianyanzhou Ecological Research Station, Key Laboratory of Ecosystem Network Observation and Modeling, Institute of Geographic Sciences and Natural Resources Research, Chinese Academy of Sciences, Beijing, China.
Email: tianli@igsnrr.ac.cn
© 2019 Sift Desk Journals. All Rights Reserved
VOLUME: 3 ISSUE: 3
Page No: 466-475
Li Tian
Qianyanzhou Ecological Research Station, Key Laboratory of Ecosystem Network Observation and Modeling, Institute of Geographic Sciences and Natural Resources Research, Chinese Academy of Sciences, Beijing, China.
Email: tianli@igsnrr.ac.cn
Li Tian
Li Tian, The spatial-temporal variations of vegetation cover in Qinba Mountains from 1982-2015(2018)SDRP Journal of Earth Sciences & Environmental Studies 3(3)
Vegetation and its distribution are largely controlled by the regional landform (including soils) and the global climate changes. Qingling-Daba (Qinba) Mountains are located in the transitional zone between the subtropical and warm temperate climate in China, with its vegetation very sensitive to the changes in climate. In this study, we quantify the spatiotemporal changing trend of NDVI of the GIMMS-NDVI dataset during1982 and 2015 through linear regression analysis and the trend analysis, with Hurst index (H value) as a measure for the future trends of vegetation. We found that: (1) NDVI increased significantly, with a growth rate of 1.2%/10a. When examined at decadal scale (1980s, 1990s and after 2000), it appeared that changing rate was 3.6%/10a, 1.4%/10a, 1.1%/10a, respectively. For the most recent decade (2006-2015), however, the NDVI decreased at -0.3%/10a. (2) The seasonal variation of vegetation was dominated by an increasing spring NDVI (3%/10a). (3) The spatial variation of NDVI was low on the edge and high in the middle, low in the west and high in the east, low in the south and high in the north. (4) Around 63.48% of the vegetation had improved function, while 1.98% of the vegetation continue being degraded.
Key Words: spatiotemporal variation; vegetation coverage; GIMMS3g NDVI; Qingling-Daba (Qinba) Mountains
The climate system is undergoing significant changes characterized by global warming in the past 100 years, and the effects of terrestrial ecosystems caused by such changes have been highly valued by humans (Shen et al. 2013; Huang et al. 2017; Zeng et al. 2017) . As the main body of terrestrial ecosystems, vegetation is the natural link connecting the relationship between atmosphere, water and soil, and plays an important role in material circulation and energy flow(Braswell et al. 1997; Buitenwerf et al. 2015; Verbeeck and Kearsley 2016) . Vegetation cover can well represent the growth of surface vegetation. Its dynamic changes are affected by multiple factors such as soil, climate and human activities (Yuan et al 2013; Wang et al 2014; Zhang et al. 2013; Yi et al. 2014). The influence of temperature and precipitation on vegetation cover change is most directly and important related to climate factors (Nemani et al. 2003). As a method to understand the change of vegetation cover, the trend analysis of Normalized Difference Vegetation Index (NDVI) data has been widely used from region to globe (Eckert et al. 2015). Guisan et al (2007) showed that the NDVI study of alpine vegetation showed that the dynamic change of vegetation cover at altitude between 1650 and 2450 m was mainly affected by human activities rather than climate change. Mancino (Mancino et al. 2014) used NDVI to analyze the characteristics and attribution of total forest cover in the Licata area of Brazil from 1984 to 2010. By analyzing the NDVI data from 1981 to 2006, Xin et al (2007) pointed out that the main driving force for the extension of vegetation growth in the Loess Plateau is climate warming, and precipitation fluctuation is also an important driving factor for vegetation cover change. Liu[16] analyzed the NDVI images in the northwestern region, and concluded that different climatic factors (temperature, precipitation) have obvious spatial differences in the effects of vegetation activities. The correlation between the Tarim River Basin and the annual average temperature is more than the interannual precipitation. Significant, while Xinjiang Tianshan and other places have the opposite result. Compared with MODIS NDVI and SPOT VGT NDVI data, GIMMS NDVI is widely used in long-scale vegetation cover monitoring due to its wide coverage and long time series (Wang et al. 2014; Yi et al. 2014; Xin et al. 2007; Liu et al 2012; Bao et al. 2013).
Qinba Mountainous is located in the transition zone between subtropical zone and warm temperate zone in China. It is a sensitive area of climate change and a vulnerable area of habitat. It is very sensitive to climate change response. The response of its vegetation cover to climate change plays an important role in the study of global change. Domestic scholars have conducted extensive research on vegetation changes in the Qinba Mountains (Sun et al. 2010; Zhang et al. 2016; He et al. 2011). Cui et al (2013; 2012) showed that the Qinling vegetation showed an overall improvement trend during 1998-2007, and the high-altitude vegetation NDVI was more sensitive to temperature response. The results of Ren (Ren et al 2012) pointed out different vegetation in Daba Mountain. The variation range of NDVI value is related to vegetation type; Deng et al (2017) explored the causes of vegetation change in Qinling Mountains, pointing out that the vegetation changes in Qinling Mountains were mainly affected by human activities during 2000-2015, followed by precipitation and temperature. However, at present, the research on vegetation cover change in Qinba Mountain area, on the one hand, the research period is mainly concentrated after 2000, the research time is short, lack of long-term monitoring research and prediction of future trends, and in the past, the average annual or The interannual variation of average vegetation in the growing season is the main research, and there are few studies on the variation of vegetation changes during the year (seasonal and intertemporal). On the other hand, the research scope is mainly concentrated in the territory of Shaanxi Province (Cui et al. 2012, Liu et al. 2015; Ren et al. 2003; Sun et al. 2009; Luo et al 2009), west There are few studies on Qinling, Funiu Mountain and Daba Mountain. Therefore, based on GIMMS3g NDVI data, this paper analyzes the different time scales and spatial distribution characteristics of vegetation NDVI in Qinba Mountain Area from 1982 to 2015 based on trend analysis and Hurst index, and predicts the future trend of vegetation cover change. Under the background of global warming, it provides a scientific basis for mountain vegetation protection and restoration.
2.1 Study area
The Qingling-Daba mountain (102º24’- 112º40’E, 30º43’-35º29’N) covers 30×104 km2, across six provinces and cities (fig. 1), it's about 1000 km long from east to west, 300 km wide from north to south. The qinling-daba mountains are not only the watershed of the Yangtze river and Yellow River, but also the main area of the south-north transition belt in China.The geographical location of the transition zone leads to the complexity of its vegetation flora. The north slope of qinling mountains is mainly warm temperate needle broad-leaved forest, the south slope is mainly north subtropical mixed deciduous broad-leaved forest and evergreen broad-leaved forest, and the south slope of dabashan mountain is a typical evergreen broad-leaved forest (Zhou et al. 2006). With the elevation increase, climate and vegetation are obviously vertically zonal distribution (Ma R Z, 1965).The region 12 ~ 16 ℃, annual average temperature, annual average rainfall of 709 ~ 1500 mm the highly complexity of geographical environment, biodiversity and climate sensitivity, geography, biology research in China is the natural laboratory.
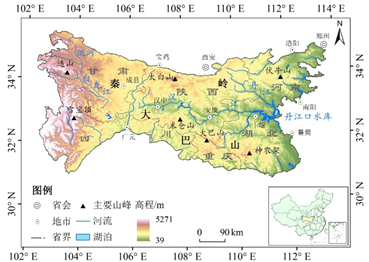
Fig.1 The location and topography of Qinba Mountains
2.2 Data sources
In this study, we used GIMMS3g V1.0 vegetation remote sensing data, provided by the United States Global testing with the model group (Global Inventor Modeling and Mapping Studies, GIMMS), the spatial resolution of the 15d synthesis of 8 km NDVI dataset (https://ecocast.arc.nsds.gov), the time span is 1982-2015. The data set has been pretreated by atmospheric correction and radiation correction.In order to reduce the impact of clouds, aerosols and perspectives, the Maximum Value synthesis method MVC (Maximum Value Composites) (Zhang et al. 2003; Lovell and Graetz 2001) was adopted to obtain monthly NDVI.Based on the monthly average, the average and average NDVI were obtained by the average method.During the year, march to may is defined as spring, June to August is defined as summer, September to November is defined as autumn, December to February is defined as winter (Zhao et al. 2015).
We included a total of 24 imgaes produced in a year. Our initial examinations of the NDVI change in the different seasons were calculated using average monthly values, —for example, spring was calculated using the March, April and May; summer was calculated using the June, July and August; Autumn was calculated using the September, October and November; Winter was calculated using the December, January, and February. and then, for the annual value, the NDVI was calculated using average monthly values with the following formula:
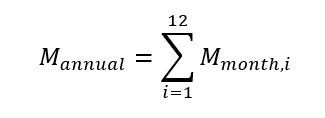
where Mannual was the albedo, ET and LAI annual mean value of every year, and Mmonth,i was the monthly mean value for NDVI, with representing the months of January through December.
To explore the interannual temporal and spatial variations of the NDVI values, we divided the annual by month and analyzed its change. For analysis of the inter-annual temporal and spatial variation of NDVI, we used pixel line regression.
3.1 Characteristics of vegetation cover time change
The correlation coefficient between annual NDVI in Qinba mountains is 0.589 (P<0.01), indicating that there is a strong correlation between year and year (fig. 1-2; Tab 1). The average annual NDVI value of there fluctuated significantly from 1982 to 2015, with an average increase rate of 1.2%/10a (R2=0.347, P < 0.000).The minimum value of NDVI (0.54) appeared in 1984, the maximum value (0.62) appeared in 2015, and the value of NDVI fluctuated between 0.54 and 0.62 in other years, and the annual fluctuation range was relatively large.There were two distinct ups and downs in the mean value of NDVI in the last 34 years. Through 1984 and 1987, NDVI continued to grow from 0.54 to 0.59, with an increase of 9.26%. From 1990 to 1994, the value of NDVI continued to decline from 0.61 in 1990 to 0.55 in 1994, a decline of 9.84%. In 1995, NDVI rapidly recovered to 0.60. however, the NDVI value was relatively low in 1998-2002.
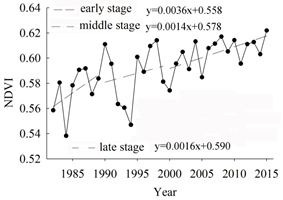
Fig.2 Change in annual mean NDVI in Qinba Mountains in different periods
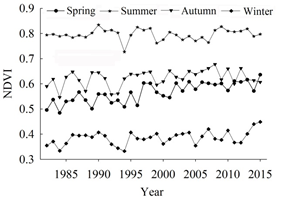
Fig.3 Change in seasonal mean NDVI in Qinba Mountains
In order to better understand the dynamic change of vegetation cover in Qinba mountains, we divided the time series into 1980s (early stage), 1990s (middle stage) and early 21st century (late stage) for comparative analysis, and the third-period average NDVI value was linearly fitted with the year (fig 2). The NDVI values in the first, middle and last stages all showed an upward trend of fluctuation (large degree of fluctuation in the early and middle stages, small degree of fluctuation in the later stage), but the increase rate of NDVI values was different. In the early stage, the growth rate was 3.6%/10a, with the fastest growth rate, and in the middle stage, the growth rate was 1.4%/10a, second only to the earlier stage, and in the later stage, the growth rate was higher than that in the middle stage, which was 1.6%/10a. The medium term growth rate is the lowest, which may be caused by the sharp decrease of cultivated land area in the early stage of the project of converting cultivated land to forest in the research area during this period, leading to the decrease of vegetation coverage (Deng et al. 2017; He et al. 2012).
Vegetation growth has a strong seasonal seasonality, which had a great impact on the average season NDVI value (fig. 3). We found the difference of NDVI values in the four seasons of Qinba mountains had a huge difference, which was manifested as in summer (0.80) > in autumn (0.62) > in spring (0.56) > in winter (0.38). Moreover, the rate of change of each season is quite different. The growth rate was in spring > in winter > in autumn and summer (fig. 3, table 1), which is highly consistent with other scholars' conclusions on the response of land ecosystems in north China and northern hemisphere to global change (Gehrig-Fasel et al. 2007; Los et al. 2001; Piao and Fang, 2003; Zhou et al. 2001).
Table.1 Regression equations, coefficient of determination and significance test of NDVI in Qinba Mountains
|
Season |
Regression analysis |
R2 |
P value |
|
Spring |
y=0.003x+0.5104 |
0.6106 |
< 0.000 |
|
Summer |
y=0.0001x+0.7935 |
0.0033 |
0.748 |
|
Autumn |
y=0.0008x+0.6067 |
0.0597 |
0.164 |
|
Winter |
y=0.001x+0.366 |
0.1279 |
0.038 |
|
Annual mean |
y=0.0012x+0.5691 |
0.3474 |
< 0.000 |
3.2 Characteristics of NDVI changes in Qinba mountains
In order to analyze the annual variation law of monthly average NDVI of vegetation in Qinba mountains, the mean value of monthly NDVI of 34a was calculated (fig. 4).The value of NDVI varies from month to month and has strong seasonal rhythm.The value of NDVI was lower in January and March, higher in May and September, with the lowest value at 0.36 in February and the highest value at 0.8 in July. From march to may, green plants began to bud in the study area, and the vegetation coverage increased rapidly, with an increased rate of 82.5%. From June to July, when the annual rainfall was relatively concentrated, the temperature was higher, which was conducive to plant growth. From July to August, the vegetation coverage was the highest, and the monthly average NDVI reaches the maximum. Due to the hysteretic response of vegetation growth to temperature and precipitation, vegetation cover decreased less in September. From October to November, the leaves of vegetation fell, and the value of NDVI decreased rapidly, with a decrease rate of 23.44%.
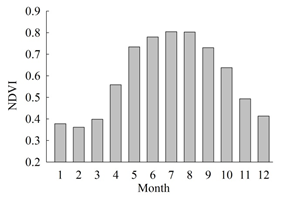
Fig.4 Averaged monthly NDVI in Qinba Mountains from 1982 to 2015
In order to understand the interannual variation trend of monthly average NDVI, the accumulated average NDVI of different months and the yearly during the research period were fitted and analyzed, and the variation trend of each month was obtained (fig. 5).The results showed that except for the slight decline of NDVI in July and September, the other months showed different degrees of increase.The increase rate of NDVI was the most significant in April, with an increase rate of 5.2%/10a (P<0.001), followed by may (2.6%/10a), and the smallest increase rate in June (0.7%/10a). The increase rate in February was consistent with the change trend of average annual NDVI, both of which were 1%/10a.The rate of reduction of NDVI was July > September and August, but it did not reach a significant level.
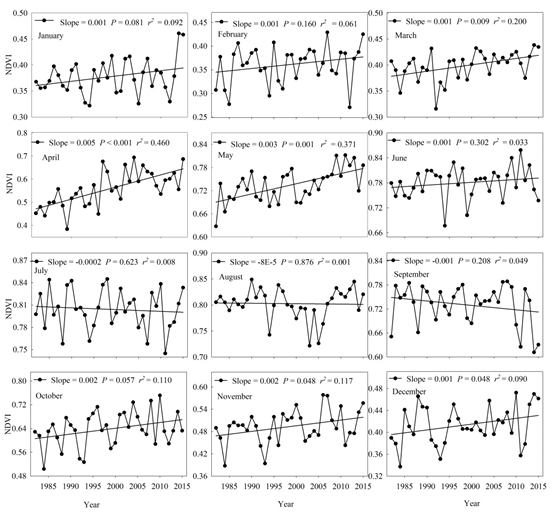
Fig .5 Change in monthly mean NDVI in Qinba Mountains
3.3 Spatial distribution of NDVI during the study 34years in Qinba mountains
According to the spatial distribution of NDVI in different periods and seasons in Qinba mountains (fig. 6), the vegetation cover in Qinba mountains as a whole presents the distribution pattern of "low around, high in the middle, high in the east, low in the west, high in the north and low in the south".From 1982 to 2015, the average value of NDVI was 0.59 (0.27-0.74), and most of NDVI was between 0.5 and 0.7, accounting for about 76.51% of the study area, indicating that the overall vegetation coverage in Qinba mountains was well among 34a.The areas with NDVI less than 0.4 accounted for about 7.24% of the study area, mainly distributed in the northwestern and southwestern edge areas of mountainous regions.The region with NDVI value was 0.4-0.5 accounted for about 9.90% of the total area, and its distribution was scattered in the central region of the study area.The region with 0.5-0.6 accounted for about 24.13% of the total area, and NDVI value was most widely distributed between 0.6-0.7, accounting for about 52.38% of the total area;The area with the best vegetation coverage (NDVI value 0.7-0.8) is mainly the area with large forest area such as taibai mountain, daba mountain and shennongjia.
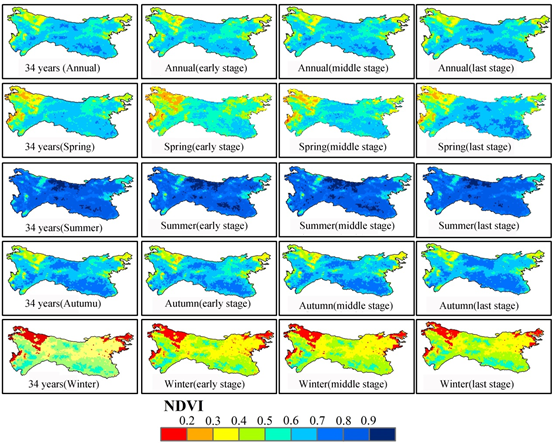
Fig.6 The spatial distribution of annual and seasonal NDVI in Qinba Mountains in different periods
In order to better understand the vegetation changes in the study area, the proportion of NDVI covered by different levels of annual and seasonal average was statistically analyzed (fig.7).The results showed that the vegetation distribution in the qinba mountains showed the same pattern in different periodsin the 34 years. The NDVI value in different periods were mostly between 0.5-0.7, but the area for NDVI between 0.5-0.6 and 0.6-0.7 was decreasing, at the moment, the area for NDVI between 0.6-0.7 was increasing. The proportion of low value NDVI region was decreasing and the proportion of high value region was increasing. It could be seen that the high-value areas were mainly increased in the Qinling mountains, daba mountains and shennongjia forests, while the low-value areas are mainly reduced in lixian county, xihe county and tianshui city.
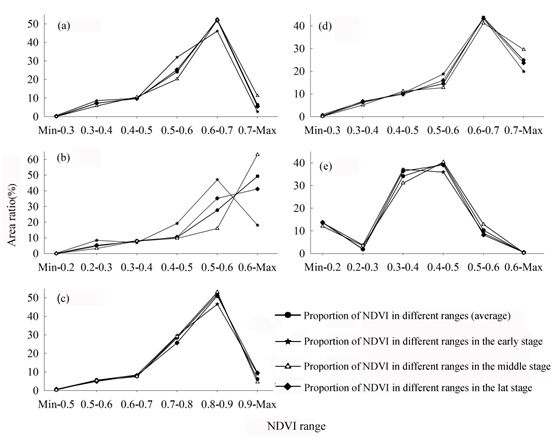
Fig.7 Interannual variation of annual(a) and seasonal NDVI(b-e) at different NDVI levels in Qinba Mountains in different periods
3.4 Spatial variation trend of NDVI in Qinba mountains in the study years
Using linear regression equation for each pixel to regression analysis with time series, and according to the annual NDVI value of the F test results of the vegetation change was divided into five categories: improved significantly, a slight improvement, basic unchanged, slight degradation, mild degradation (fig. 8 and tab 2).
The areas with basically unchanged vegetation coverage were mainly distributed in the high-altitude areas with little impact from human activities, such as the edge of Qinghai-Tibet plateau, the northern part of the bashan mountain, Taibai mountain and Shennongjia. In the area of vegetation improvement, the obviously improved area accounts for about 51.90% of the total area, mainly distributed in hanzhong city, ankang city, longnan city and other areas in the central and eastern part of Qinba mountains, and also scattered in the southwest. The areas with slight improvement were about 11.57% of the total area, scattered throughout the study area.The obvious and slightly degraded areas account for about 0.92% and 1.06% of the total area respectively, and they scattered in the marginal areas of the qinghai-tibet plateau, such as the marginal areas of lintan county and zhuoni county.Overall, the variation trend of NDVI in the nearly 34 years Qinba mountains was: lower altitude was stronger than high altitude, south was stronger than north, and east was stronger than west.
Table.2 The classification protocols for vegetation coverage changes statistical result in Qinba Mountains from 1982 to 2015
|
Class types |
standard of classification |
The number of pixel |
Area proportion (%) |
|
mild degradation |
Slope< 0, P<0.01 |
39 |
0.92 |
|
slight degradation |
Slope < 0, P<0.05 |
45 |
1.06 |
|
basic unchanged |
P >0.05 |
1469 |
34.55 |
|
slight improvement |
Slope > 0, P<0.05 |
492 |
11.57 |
|
improved significantly |
Slope > 0, P<0.01 |
2207 |
51.90 |
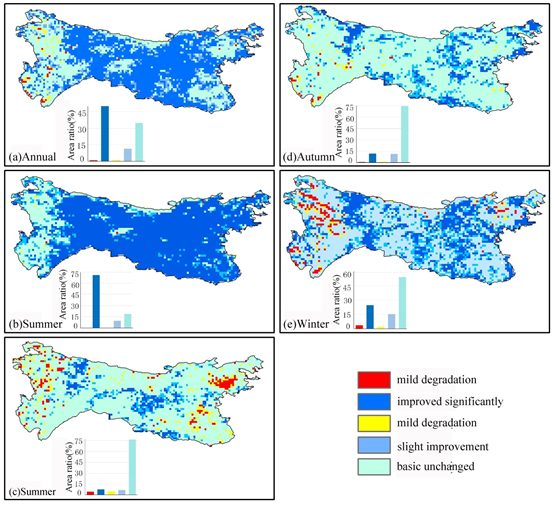
Fig.8 The spatial distribution of significance levels for testing interannual (a) and seasonal NDVI(b-e) change in Qinba Mountain from 1982 to 2015
The spatial distribution of NDVI changes in different seasons showed the degree of NDVI changes and regional distribution of vegetation in different seasons also vary greatly (fig. 8). In spring, vegetation was mainly improved, and the mostly unchanged areas were mainly in the high-altitude areas with little human influence, such as the edge of qinghai-tibet plateau and taibai mountain. The areas with moderate improvement were scattered in the study area, and the areas with obvious and moderate degradation only accounted for 0.12% and 0.19% of the total area. Summer and autumn were mainly basic unchanged, but the fall was significantly improved and moderate improvement area were more than the summer, the summer significant degradation and severe degradation area was more than the fall, so the vegetation NDVI increased 0.7% . In summer has significant improvement areas were mainly distributed in longnan, ankang municipality, significant degradation of area mainly in nanyang and luoyang area, and significantly improve the regional distribution of autumn was relatively fragmented, significant degradation of area accounted for only 0.73% of the total area; In winter, the area of vegetation improvement was slightly lower than the basically unchanged area, and the area of obvious improvement and moderate improvement was 24.76%, respectively, showing first decrease and then increase (early > later > middle stage).The three seasons of summer, autumn and winter were in different intervals and 15.31% in different periods. In summary, from 1982 to 2015, the vegetation cover in Qinba mountains in spring, summer, autumn and winter showed an increasing trend, but there was a significant difference in vegetation change degree in different seasons. The area of vegetation improvement was in spring > in autumn> in summer, which was consistent with the change characteristics of vegetation in time, and NDVI increased most obviously in spring.
In this study years, we used GIMMS NDVI, and analyzed the space-time variation characteristics of 34 years vegetation NDVI in Qinba mountains correlation analysis method and trend analysis method, and obtained the following main conclusions:
Qinba mountains NDVI showed a increased trend in 1982-2015, the growth of 1.2% / 10 a (P < 0.001), NDVI stable interannual fluctuation, which in the 1980s, 1990s, at the beginning of the 21st century the three stages of vegetation NDVI were increased, but the increase rate of the declining trend, 3.6%/10a, 1.4%/10a, 1.1%/10a, in the recent ten years (2006-2015). The annual changes of vegetation in Qinba mountain area showed strong seasonal, and NDVI value was summer > fall > spring > winter. For four seasons, spring average NDVI increased the fastest and most remarkable season, growth of 3%/10a (P < 0.001), scope of NDVI and different level range, the largest growth rate second only to the spring and winter a 1%/10a (P < 0.05), summer and autumn NDVI showed a trend of small gains. It indicates that the vegetation growth season in Qinba mountains from 1982 to 2015 was significantly advanced, and the increase of NDVI in spring may be the main response to global warming. In the space scale, Qinba mountains vegetation pattern showed large spatial heterogeneity, and the NDVI high value area were mainly distributed in the Qinling mountains, DaBaShan District and shennongjia forest region and other regions, low-value area were mainly distributed in the northeast edge of Qinghai-Tibet plateau and the research area of northeast edge of xinmi, dengfeng city, etc. By comparing the pixel Numbers of different ranges of NDVI in 1980s, 1990s and early 2000s, it can be seen that the pixel number of high value region of NDVI was increasing, while that of low value region was decreasing.
Qinba mountains vegetation NDVI change trend has obvious spatial heterogeneity, high altitude area vegetation in the study area was mainly affected by the climate change, vegetation cover mostly as basic unchanged or slightly degradation. The low altitude area was greatly influenced by human beings, most vegetation coverage performance was improved significantly, with the ecological protection policies to return farmland to forest and grassland, but due to urban sprawl, extreme climate factors such as vegetation was characterized by degeneration phenomenon also make a small area. How to quantitatively study the response mechanism of vegetation cover change to human and natural factors in Qinba mountains remains to be further studied in the future.
Funding: This research was funded by the National Natural Science Foundation of China (No. 41601100), the Strategic Priority Research Program of the Chinese Academy of Sciences (No. XDA19040305, XDA19050501), and National Key Research and Development Program of China (No. 2017YFB0503005), the International Postdoctoral Exchange Fellowship Program 2015 by the Office of China Postdoctoral Council (the approval document number: No: 38 Document of OCPC, 2015).
Shen Y P, Wang G, Key findings and assessment results of IPCC WGI Fifth Assessment report . Journal of Glaciology and Geocryology, 2013, 35(5):1068-1076.
Huang M, Piao S, Janssens I A, Zhu Z, Wang T, Wu D, Ciais P, Myneni R B, Peaucelle M, Peng S, Yang H, Penuelas J. Velocity of change in vegetation productivity over northern high latitudes. Nature ecology & evolution, 2017, 1(11): 1649-1654. PMid:28970570
View Article PubMed/NCBIZeng Q, Zhang Y M, Wen L, Li Z J, Duo H R, Lei G C. Productivity benefits of warming at regional scale could be offset by detrimental impacts on site level hydrology. Scientific Reports, 2017, 7: 11. PMid:29123146 PMCid:PMC5680237
View Article PubMed/NCBIBraswell B H, Schimel D S, Linder E, Moore B. The response of global terrestrial ecosystems to interannual temperature variability. Science, 1997, 278(5339): 870-872.
View ArticleBuitenwerf R, Rose L, Higgins S I. Three decades of multi-dimensional change in global leaf phenology. Nature Climate Change, 2015, 5(4): 364-368.
View ArticleVerbeeck H, Kearsley E. The importance of including lianas in global vegetation models. Proceedings of the National Academy of Sciences of the United States of America, 2016, 113(1): E4-E4. PMid:26699501 PMCid:PMC4711843
View Article PubMed/NCBIYuan L H,Jiang W G,Shen W M,Liu Y H,Wang W J,Tao L L,Zheng H,Liu X F. The spatio-temporal variations of vegetation cover in the Yellow River Basin from 2000 to 2010.Acta Ecologica Sinica,2013,33(24):7798-7806.
Wang Y C, Sun Y L, Wang Z H. Spatial-temporal change in vegetation cover and climate factor drivers of variation in the Haihe River Basin 1998-2011. Resources Science, 2014, 36(3):0594-0602.
Zhang Xuezhen, Dai Junhu, Ge Quansheng. Variation in vegetation greenness in spring across eastern China during 1982-2006. Journal of Geographical Sciences, 2013, 23(1): 45-56.
View ArticleYi L, Ren Zh, Zhang Y, et al. Vegetation Cover, Climate And Human Activities on the Loess Plateau. Resources Science, 2014, 36(1): 0166-0174.
Nemani R R, Keeling C D, Hashimoto H, Jolly W M, Piper S C, Tucker C J, Myneni R B, Running S W. Climate-driven increases in global terrestrial net primary production from 1982 to 1999. Science, 2003, 300(5625): 1560-1563. PMid:12791990
View Article PubMed/NCBIEckert S, Husler F, Liniger H, Hodel E. Trend analysis of MODIS NDVI time series for detecting land degradation and regeneration in Mongolia. Journal of Arid Environments, 2015, 113: 16-28.
View ArticleGehrig-Fasel J, Guisan A, Zimmermann N E. Tree line shifts in the Swiss Alps: Climate change or land abandonment? Journal of Vegetation Science, 2007, 18(4): 571-582.
View ArticleMancino G, Nolè A, Ripullone F, Ferrara A. Landsat TM imagery and NDVI differencing to detect vegetation change: assessing natural forest expansion in Basilicata, southern Italy. iForest - Biogeosciences and Forestry, 2014, 7(2): 75-84.
View ArticleXin Zh, Xu J X, Zheng W. Effects of climate change and human activities on vegetation cover in loess plateau. Science in China Press, 2007, 37(11):1504-1514.
Liu X F, Ren ZY. Vegetation Coverage Change and Its Relationship with Climate Factors in Northwest China. Scientia Agricultura Sinica, 2012, 45(10): 1954-1963.
Bao G, Qin Zh, Bao Y H, Zhou Y. Spatial-temporal changes of vegetation cover in Mongolian Plateau during 1982-2006. Journal of desert research, 2013, 33(3): 918-927.
Sun H,Bai H Y,Zhang Q Y,et al. SPOT VEGETATION-based analysis on vegetation change and its responses to temperature in the southernregion of Qinling Mountains during the last decades. Acta Scientiae Circumstantiae, 2010, 30(3):649 -654.
Zhang X D, Zhu WB, Cui YP, Zhang JJ, Zhu LQ. The response of forest dynamics to hydro-thermal change in Funiu Mountain. Geographical Research, 2016, 35(6): 1029-1040.
He Y N, Bai H Y, Gao X, Ma X P. Analysis on the Variation Tendency of Vegetation Cover of Micang Mountains. Acta Botanica Boreali-Occidentalia Sinica, 2011, 31(8): 1677-1682.
Cui XL, Bai HY, Wang T. Difference in NDVI with Altitudinal Gradient and Temperature in Qinling Area. Resources Science, 2013, 35(3): 618-626.
Cui X L, Bai H Y, Shang X Q. The vegetation dynamic in Qinling area based on MODIS NDVI . Journal of Northwest University (Natural Science Edition), 2012, (06): 1021-1026.
Ren YY, Zhang Zh, Hou QL, et al. Response of Vegetation Cover Changes to Climate Change in Daba Maintains. Bulletin of Soil and Water Conservation, 2012, 32(2): 56-59.
Deng Ch, Bai HY, Gao Sh, et al. Spatial-temporal Variation of the Vegetation Coverage in Qinling Mountains and Its Dual Response to Climate Change and HumanActivities. Journal of Natural Resources, 2017, 21(1): 1-15.
Liu XF, Pan YZ, Zhu XF, et al. Vegetation dynamics in Qinling-Daba Mountains in relation to climate factors between 2000 and 2014. Journal of Geographical Sciences, 2015, 70(5): 705.
Ren Zh, Li J. The valuation of ecological services from the vegetation ecosystems in the Qinling-Daba mountains. Journal of Geographical Sciences, 2003, 58(4): 503-511.
Sun H, Bai H Y, Zhang Q Y, etal. Responses of vegetation coverage to regional environmental change in the northern and southern Qinling mountains. Acta Scientiae Circumstantiae, 2009, 29(12):2635-2641
Luo XP. Spatial-temporal changes of NDVI and the response to the regional climate in the Qinling-Daba mountains for 25 years[M]. Northwestern University. 2009.
Zhou SX, Ren zh, Li J. Study on the Ecological Value of Soil Conservation of Vegetation in the Qinling-Daba Mountains. Arid zone research, 2006, 23(1): 144-148.
Ma RZ. Geographical distribution of mountain soil in China. ACTA PEDOLOGICA SINICA, 1965, 13(1): 1-7.
Zhang BP, Zhou ChH, Chen ShP. The Geo-info-spectrum of montane altitudinal belts in China. Acta Geographical sinica, 2003, 58(2): 163-171.
Lovell J L, Graetz R D. Filtering pathfinder AVHRR land NDVI data for Australia. International Journal of Remote Sensing, 2001, 22(13): 2649-2654.
View ArticleZhao ShY, Gong ZhN, Liu XY. Correlation analysis between vegetation coverage and climate drought conditions in North China during 2001–2013. Journal of Geographical Sciences, 2015, 70(5): 717-729.
Deng XY, Yao JQ, Liu ZhH. Spatiotemporal dynamic change of vegetation coverage in Arid regions in central Asia based on GIMMS NDVI. Arid Zone Research, 2017, 34(1): 10-19
He JL, Ma Zh H, Chen XA. Ecological and economic benefits of Grain-to-green program in Qinba mountainous. Bulletin of Soil and Water Conservation, 2012, 32(4): 251-260.
Los S O, Collatz G J, Bounoua L, Sellers P J, Tucker C J. Global interannual variations in sea surface temperature and land surface vegetation, air temperature, and precipitation. Journal of Climate, 2001, 14(7): 1535-1549. 014<1535:GIVISS>2.0.CO;2
View ArticlePiao s, Fang j. Seasonal Changes in Vegetation Activity in Response to Climate Changes in China between 1982and 1999. Acta Geographica Sinica, 2003, 58(1): 119-125.
Zhou L, Tucker C J, Kaufmann R K, Slayback D, Shabanov N V, Myneni R B. Variations in northern vegetation activity inferred from satellite data of vegetation index during 1981 to 1999. Journal of Geophysical Research: Atmospheres, 2001, 106(D17): 20069-20083.
View Article