TeresaValente
Telephone number: 00351253604034; ORCID: 0000-0002-7293-3825
Email : teresav@dct.uminho.pt;
© 2019 Sift Desk Journals. All Rights Reserved
VOLUME: 4 ISSUE: 2
Page No: 589-599
TeresaValente
Telephone number: 00351253604034; ORCID: 0000-0002-7293-3825
Email : teresav@dct.uminho.pt;
Nemias Gonçalves, TeresaValente*, Jorge Pamplona
ICT, Institute of Earth Sciences, Pole of University of Minho, Universidade do Minho, Campus de Gualtar, 4710-057 Braga, Portugal.
Kwong Fai Andrew Lo(andrewlo@faculty.pccu.edu.tw)
Teresa Valente, Jorge Pamplona, Nemias Gonçalves, WATER SUPPLY AND ACCESS TO SAFE WATER IN DEVELOPING ARID COUNTRIES(2019) SDRP Journal of Earth Sciences & Environmental Studies 4(2)
The supply of drinking water is one of the major concerns in semi-arid and arid climates, mainly in developing countries. The present study reviews the situation of the water supply in a West African coast country, the archipelago of Cape Verde, with focus on the most populous island (Santiago), regarding the rate of public coverage and the water quality.
As main insights, the research indicates that at Santiago Island only 54% of the population has connection to the public network, while 24% uses wells, springs and other potentially non-potable sources. The region of São Domingo’s is one of the most critical, with only 6.5% of public supply, justifying the assessment of the water quality used by this population. With regard to water quality, the results of this study indicate that natural and anthropic factors are contributing to degradation of the water resources, with salinity, chloride, nitrates, and nitrites as major concerning pollutants. The insufficiency of the public supply in this island could be a reflection of the situation in other arid regions of Africa. Though the recent advances it is vital to continue or even increase with the international cooperation to provide for adequate water supply infrastructures.
Keywords: public water supply, coverage rate, water points, scarcity, quality, Santiago Island
Water is an essential good to human life that should be used and managed in a sustainable way. Access to potable water is a basic need, but there are many regions of the world with precarious situations or even without infrastructure of water supply with minimum quality. In accordance with WHO/UNICEF (2012; 2015), there is about 1/6 of the world population without access to safe drinking water. The same reference estimates that this will worsen by 2050, affecting 90% of the population in developing countries. On the other hand, an adequate water supply is vital for good sanitation, and consequently to assure public health (Carter, 2006).
According to Imler and Liu (2013), water supply refers to the improved water provided by water utilities in order to meet specific defined quality standard. In turn, the concept of drinking water is generally assigned to the water provided for human uses, including for drinking, cooking and washing.
The levels of distribution by public networks vary strongly within the largest African cities (Wallingford, 2003). For example, this author presented a water production (L/inhabitant/day) in the range of 30 to 286 (for Luanda in Angola and Gabarone in Botswana, respectively). However, basic services in rural areas are considerably less available (Brinkerhoff et al 2016) or even inexistent. The former authors present a review on spatial issues that affect service availability in the rural areas of developing countries.
Currently, arid African countries are facing the effects of climate changes, as well as demographic, economic, and political evolution that may constrain the sustainable development of water management systems (Feyera et al, 2018). These regions should deal with especially complex situations due to water scarcity, which in turn enhances the water quality problems. In these contexts, growing population promotes more demand, enhancing difficulties for water management entities. Also, water management may be more complex in insular contexts, especially in small islands, where the marine influence may constrain the water quality (Cruz et al, 2017). In those cases, the salinization of the groundwater resources often compromises conditions for safe supply (Lima and Garcia, 2011).
Managing of water supply in arid climates, such as Cape Verde, has been subject of extensive bibliography. Marques et al (2011) present the regulatory model for Cape Verde and propose a methodology for evaluating the quality of the public service. This is based on indicators and scores that allow classification of the system performance varying from excellent to poor. Falkenmark (2010) focused on hydroclimate constraints and, consequently, on the need for strategies to deal with severe lack of water in many African countries. Similarly, Vörosmaty et al (2000) demonstrate the impact of climate changes and increasing extreme droughts episodes on a large world proportion that suffers water scarcity in developing countries. In terms of water polices, there is the example presented by Cirilo (2008) for the arid northeastern region of Brazil, focusing on the strategic policy for public supply at long distances. With regard to the coverage rates, Milliken (2001) refers the need for considering social, economic, and environmental factors to achieve the equilibrium between supply and demand, in a cost-effective way.
In developing countries, the access to water often depends on water points without monitoring and quality control, like springs, ponds, and rivers. Exploitation and distribution infrastructures are generally insufficient or present management difficulties. Van Damme (1981) had already reviewed these problems, showing evidences of deficient monitoring and quality control, lack of trained personal and limited economical resources. More recently Imler and Liu (2013) also identifies low coverage and poor quality as two major water issues in developing countries, mainly caused by scarcity due to aridity and frequent droughts. In the absence of an efficient public network, water vendors may provide it but obliging population to walk long distances. This is a task typically attributed to women and children (Kjellen and McGranahan, 2006).
Scarcity enhances the economic value of water and, therefore, countries have a water market, which should be regulated by the market principles. (Rogers et al, 2002; Imler and Liu, 2013). A report of United Nations in 2007 presents a brief exploring about the role of tariffs and subsidies as a strategy for providing water in these countries. In fact, tariffs are generally incapable of supporting the costs for operation and maintenance of the existent networks (Desalegn, 2005; OECD, 2009). In this context, Komiver (2005) analyzed the impact of the subsidies in Cape Verde. This author concluded that there was a great disparity between the ratio of the amount of subsidy for poor households and that going to all households (only one to five).
Cape Verde shows nowadays a fast economic growth and a population increase. Nevertheless this archipelago was identified as a developing state by the UN (UN, 2013) with 27 percent of the population living below the poverty line (World Bank Country Brief, 2011). Water public supply is a critical and challenging issue for the sustainable development of the country.
As the above context described for developing arid climates, safe water supply is also a significant challenge for Cape Verde, where recent severe droughts increased the scarcity, which is usually already problematic. So, management entities should find adaptation strategies to accommodate a changing climate as stated by Asefa et al (2014).
Lima (2013) notes the commitment of the Government of Cape Verde to accomplish the Millennium Development Goals (MDGs), especially in what regards the proportion of the population without safe water (WHO/UNICEF, 2015). In this line, reforms in the water and sanitation sector have been undertaken to improve the efficiency of the public services (Marques et al, 2011). The Economic Regulatory Agency (ARE, abbreviation in Portuguese) is the national entity that controls the water service in Cape Verde, being responsible for the public sector, namely for developing coverage rates of safe water. In Santiago Island, where the capital city is located, several measures were implemented, namely the creation of the “Intermunicipal Company of Water and Sanitation of Santiago - Águas de Santiago”. The main intention is referred as to assure a cost-effective distribution with adequate quality and quantity (ARE, 2015). Nevertheless, the region is increasingly more sensitive to climate changes, and consequently it faces increasing dryness. This, together with the current trends of population growth in Cape Verde, may lead to increasing water demands. The same situation extends in general to Africa, like exposed in TNC (2016) for sub-Saharan Africa. This report highlights how insufficient investment in water resource management exacerbates the economic impact of droughts.
Therefore, the present study aims: i) to overview the situation of water supply coverage in Cape Verde and in the Santiago Island, ii) to assess the feasibility and sustainability of the public service, and iii) to assess the quality of the water resources in regions with low coverage by the public network distribution (the case of São Domingo’s Municipality).
Insufficient investment in water resource management can exacerbate the economic impact of droughts
Cape Verde is an archipelago located in the West African coast. It is a small country with ten islands (Figure 1). The capital Praia city is located in Santiago Island. With a surface area of 991 km2, this island is the most populous, with about 55% of the population (236,000 in accordance with census of 2013). INE (2018) estimates that Santiago will host more than 60% of the population in the year of 2030.
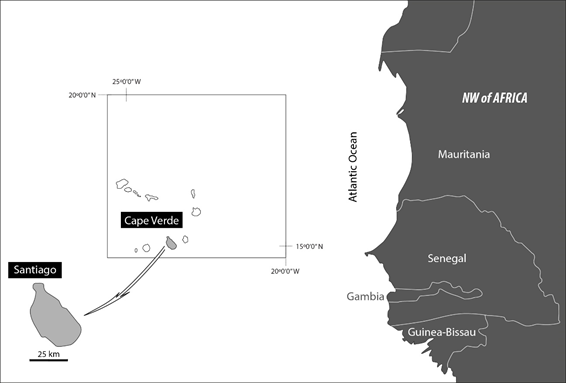
Fig 1: Geographic localization of the Cape Verde Island in the West African coast
Like other Macaronesia regions (Azores, Madeira, and Canary Islands), Cape Verde, has a torrential rainfall regime, with irregular distribution of precipitation (Ventura, 2009; Cerezal et al., 2013). The climate can be classified as arid with two seasons (dry and rainy) (Mota Gomes, 2007). The temperature varies between 25°C and 27°C in the warmer months and 22°C to 24°C in the colder months (Gomes and Pina, 2004).
Santiago has a maximum altitude of 1394 m and the irregular precipitation varies from coast to mountains, in a range of 190 to 320 mm/year (Carreira et al., 2009). There are no perennial water courses, so water availability is mainly dependent on the precipitation (Pina, 2009). Mota Gomes (2007), based on the PNUD/DDES CVI-87-001 (2005), refers that in dry period the exploitable groundwater in Santiago island is of 16.5 cubic meters per year. In fact, the island is characterized by a dense network of temporary rivers that are often used as roads or are occupied for agriculture and for illegal exploitation of aggregates, during the increasingly long drought periods.
The Island has a volcanic origin and so, from the lithological point of view, there is a predominance of volcanic rocks of varied composition and genesis, mainly basalts and pyroclasts. Associations of sedimentary rocks grouped in two facies (marine and terrestrial) can also be found. There are three main geological units with hydrogeological importance: Pico de Antonia, Monte das Vacas, and recent sedimentary Quaternary formations (Carreira et al, 2009). A detailed geological and hydrogeological characterization can be found in Serralheiro (1974) and Matos Alves (1979). Based on data from National Institute of Water Resources, and as evidenced by Carreira et al. (2009), the pillow lava layers from Pico de Antonia represent the most hydrogeological productive formations.
3.1. National strategies for the water management system
The arid climate, with rare and irregular precipitation, is the main control factor on the availability of drinking water. Nowadays, difficulties on the water supply are worsened by growing population and urbanization, together with recent severe droughts periods. A consequence is the increased vulnerability of the water management system, which imposes reducing the impacts of these negative events in order to fulfill water requirements under different scenarios (Vieira and Sandoval-Solis, 2018).
The national action plan for the integrated water resources management highlighted the need for developing this sector in order satisfies the rising freshwater demand. Thus, the supply is expected to increase to more than 70 million m3 in 2020, in comparison with the 42 million m3 in 2007. However, demand should increase to 100 million m3 during the same period (Loan, 2013). Given the limited potential of the surface water resources, supply is strongly dependent on groundwater sources. However, excessive pumping is promoting saltwater intrusion, which affects such groundwater resources (e.g., Carreira et al. 2010; Gonçalves et al, 2015). So, nowadays seawater desalination is a national strategy to help the development of the public water supply service (Marques et al 2011).
According to the national plan of basic sanitation from 2010, the total volume of groundwater explored in the archipelago was estimated at 99,409 m3/day, with Santiago representing 53,989m3/ day. The springs account for 44% of this total value, while the holes and wells represent 28-29%, respectively (Ventura, 2009).
3.2. Access to infrastructure in the archipelago
According to the official available information, there has been progress in relation to the public supply in Cape Verde as the proportion of the population served by the public network has increased considerably. In fact, this proportion increased from 32.4% in 1990 to 64.6% in 2016 (Figure 2) (INE, 2016).
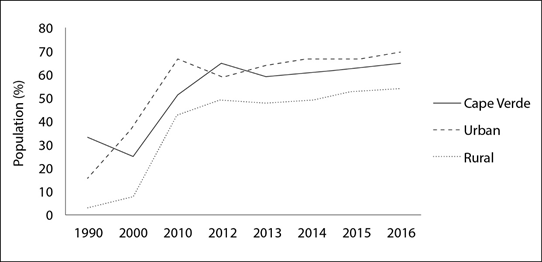
Fig 2: Evolution of the population with access to the public water network in Cape Verde from 1990 to 2016. Sources: Census from INE (1990, 2000, 2010) and several official reports from the Government (QUIBB - 2006, 2007 and IMC (2011, 2012, 2013, 2014, 2015, 2016)
Although the proportion of the population with access to public network in 2016 reached about 70%, figure 2 illustrates the inequalities between urban and rural areas, in favor to urban centers.
The per capita water consumption in Cape Verde is low: 40-60 L in areas with domestic public supply and 10-20 L for fountains (UNDP, 2013). This value does not meet the recommended minimum standard of 20 to 40 L/ inhabitant/day (WHO, 2011) (INGRH, 2010). Nevertheless, in rural areas, public fountains and auto tanks have particular importance (INE, 2017). These sources are more costly, both in time and price, as the households should spend time collecting water, task typically attributed to women and children (Figure 3).
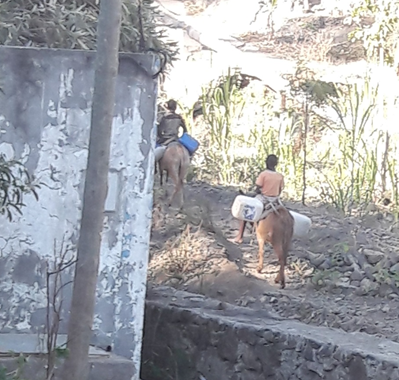
Fig. 3: Image of children carrying containers for collecting water
Data in figure 4 shows that around 64% of the population is supplied through the public network, 13% through fountains, and 6% by auto tanks. So, 83% of the population has access to more or less safe water supply but 17% supplies precariously.
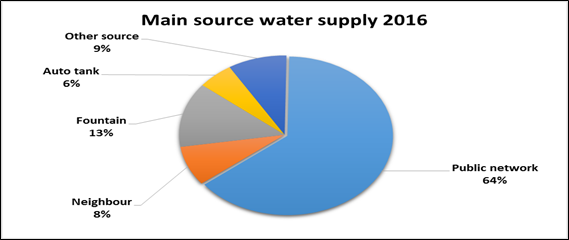
Fig 4: Main source of water supply in Cape Verde. Source: INE 2017
4.1. Water consumption and main water sources
In 2013, the Santiago Island had 236,000 inhabitants and 63,392 households, which indicated about 4 inhabitants per household. This island has more than half of the Cape Verde population and demographic projections by INE (2017) indicate that the population of Santiago Island should increase progressively until 2020, with an annual growth rate of 1.4%.
According to UNDP (2013), estimation of per capita consumption in urban centers depends on system supply: on average it is 50 L/ inhabitant /day, where there is public (domestic) connection, and 15 L/inhabitant /day for users of fountains.
In rural areas, consumption is variable: 25-50 L/inhabitant/day for domestic connections and between 5-15 L/inhabitant/day for other forms of supply. This average consumption is below that recommended by the World Health Organization (WHO, 2011).
The increased demographic trend for Santiago implies higher demand for potable water. So, the Water Supply System Development Project conducted by the government (Loan, 2013), considered some measures to satisfy this needs, such as temporary transfer of water among municipalities in dry season.
The island has a total of 2,287 identified and georeferenced points of water, in the form of tubular wells, cisterns, piezometers, and waterways, in addition to the clandestine ones (Pina, 2014). Presently (2017-2018), there are projects to strength the distribution network, such as the systems of Faveta and Poilão, two recent constructed water dams (DouroECI, 2018).
In terms of quality control, the institution - INGRH/ANAS assures the monitoring of 15.4% of water points (353), being 211 tubular wells, 39 springs, 14 piezometers, and 89 cisterns (Pina, 2014). The wells are monitored monthly by the ANAS institution, with flow measurements and expeditious physico-chemical indicators, like electric conductivity, temperature, and total dissolved solids, aiming to an in situ characterization.
4.2. Access to infrastructures in the Island
The water management model in Santiago, as in the other islands of the archipelago, is somehow peculiar, as described by Bosa (2015). It is based on the co-existence of public and private institutions: The springs, small wells are managed by privates; the holes and large wells are controlled by the state, being in fact mostly managed by the communities.
According to the INE (2017; IMC-CV - 2016), in Santiago Island 54% of the population is served by the public network connection, although using different formats of supply. However, 24% of the population is supplied by wells and springs, among others, which can be considered as non-potable sources (Figure 5).
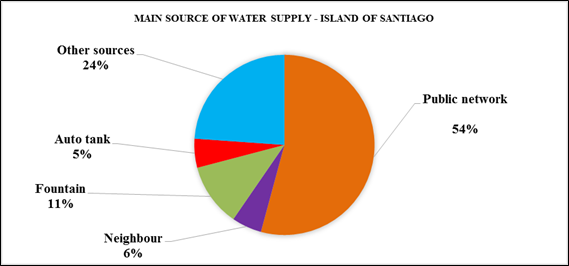
Fig. 5: Main source of water supply - island of Santiago. Data from INE, 2017
In the cases where the population supplies through fountains, pump trucks or other sources (wells and springs), the service is provided by private companies although under the public responsibility of the entity ADS (Water of Santiago). Figure 6 shows precarious examples of water supply, used by the population without coverage of the public network.
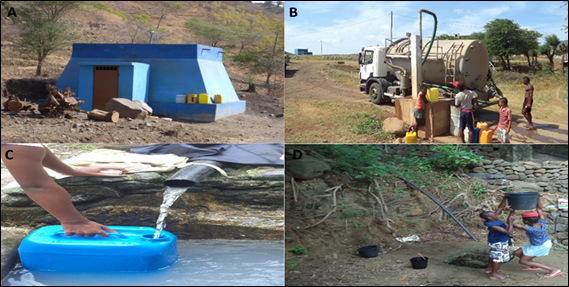
Fig. 6: different types of water supply in Santiago Island: a) Fountain; b) Auto tank; c) Springs; d) Wells
Figure 7 presents the estimation of the evolution of the public supply service until 2020. In the year of 2015, 212,447 people were served through the network, while 78,735 inhabitants were dependent on other sources. By 2020, the population served through the public network will increase to 274,218, while the other sources will decrease to 38,250 (ARE, 2015).
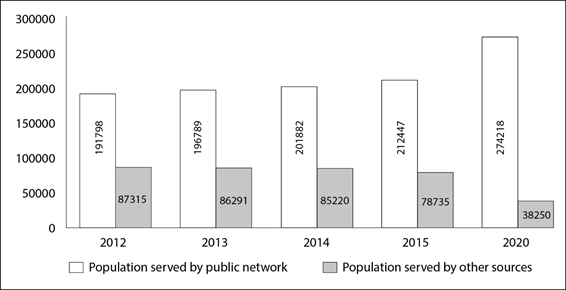
Fig. 7 Evolution of the population with access to public network in Santiago Island (2012-2020). Source: (ARE, 2015; MEF EBES)
In 2015 the average water capitation for public consumption in Santiago was estimated of about 40 L/inhabitant/ day. A minimum capitation of 60 L/inhabitant/ day is expected up to 2020 (ARE, 2015).
In respect of the percentage of connection to the public network, the municipalities of São Lourenço dos Órgãos, Santa Catarina, Santa Cruz, and Tarrafal, are above the national average (Table 1). However, there are municipalities with a significant proportion of the population (over 30%) dependent on precarious sources (wells, springs). This situation is more worrying in the cases of São Domingos and São Salvador do Mundo, since not even 25% of the population has connection to public network. Specifically, in the municipality of São Domingos the public network does not reach the 10%.
Table 1- Main sources of water supply in the Santiago Island (%)
|
Municipality |
Public Network |
Neighbors |
Fountains |
Auto tank |
Other sources |
|
Tarrafal |
80.0 |
3.6 |
8.7 |
5.5 |
2.2 |
|
Santa Catarina |
66.9 |
5.6 |
7.4 |
2.7 |
17.4 |
|
Santa Cruz |
66.8 |
8.5 |
4.8 |
2.4 |
17.4 |
|
Praia |
62.7 |
13.0 |
16.1 |
7.9 |
0.3 |
|
S. Domingos |
6.5 |
0.7 |
34.7 |
17.9 |
40.1 |
|
S. Miguel |
50.9 |
5.6 |
3.8 |
3.2 |
36.4 |
|
S. Salvador do Mundo |
24.2 |
0.1 |
13.2 |
3.1 |
59.4 |
|
S. Lourenço dos Órgãos |
73.9 |
3.5 |
0.0 |
0.8 |
21.8 |
|
Ribeira Grande de Santiago |
55.8 |
7.8 |
13.2 |
3.3 |
19.9 |
|
Cape Verde Average |
64 |
8 |
13 |
6 |
9 |
Figure 8 illustrates graphically the situation observed for the nine municipalities of Santiago, putting in evidence the dependence of São Salvador do Mundo and São Domingos on precarious sources of supply.
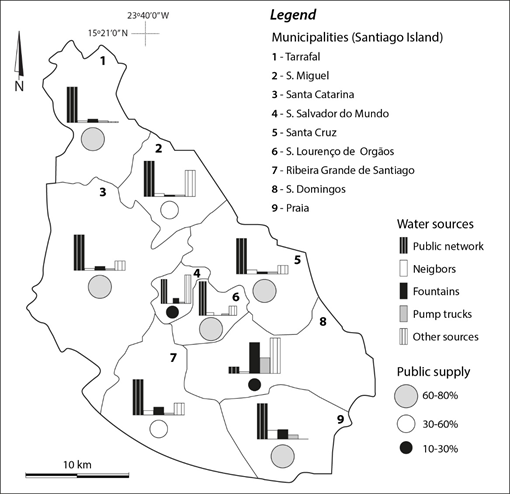
Fig 8: Distribution of main sources of water supply by municipality. The size of the circles represents the proportion of population served by public network
The characterization of water resources in Santiago Island has been performed by several authors, mainly focused on hydrogeology and hydrochemistry of groundwater. For example, Monteiro Santos et al. (2006) present results of geophysical research (VLF) in the region of Santa Cruz, revealing the patterns of aquifer contamination by seawater. In the same line, Carreira et al (2009) combined geochemical and isotopic methods to study the coastal aquifers of Santiago. Similarly, salinity appears as a relevant issue, mostly for groundwater systems in agriculture valley zones. Overexploitation and low precipitation are pointed out as the main causes for the high salt contents. In fact, Carreira et al. (2010) identify anthropogenic contamination by agriculture and salinization as responsible by aquifers degradation.
Also, Mota Gomes (2007) established a geological model of the Island, correlating geological, hydrological and hydrochemical data of the water resources. The work concludes with evidences of contamination by salinization in the wells located in some pillow-lava formations, namely in São Domingos region.
São Domingos is located in the southeastern part of Santiago Island (Figure 8). It extends from the coast to the interior, occupying an area of 134.6 km2. As evidenced in table 1, this municipality has the least coverage of public supply services. As a consequence, the inhabitants have to resort to other sources, mostly without monitoring and quality control.
Specifically focused on the region of São Domingo’s, there is the work by Gonçalves et al. (2015), which presents water quality based on the characterization of 22 water points used by population. These authors showed how water-rock interaction explains the chemistry of water. However, the influence of agriculture and diffuse pollution by sewage also control the hydrochemical properties, especially with respect to potential chlorinated contributions. This study, conducted in 2014, showed a considerable variation in electric conductivity (369-1361 μS/cm), reflecting the variation in salinity. In these volcanic terrains, the salinization of the aquifers can result from the water-rock interaction processes and from evapoconcentration of the deposition of the marine aerosol, typical of the arid climate, as noted by other authors (e.g. Carreira et al, 2010).
Infiltration from irrigation water, which is often saline (Cruz-Fuente, 2008), may also be mentioned. The high concentrations of chloride obtained by Gonçalves et al (2015) (average of 181 mg/L, with maximum of 450 mg/L) can also result from fecal contribution, due to poor sanitation conditions. The region does not have waste water treatment and sewage flows into the soil and surface water. These explanations are reinforced by very high concentration of nitrates, reaching a maximum value of 214 mg/L, considerably above the quality standards established by Cape Verde law and by WHO (United Nations, 2010). The evaluation of the compliance of the 22 water points relatively to the Cape Verde legal framework is presented in Figure 9. For example magnesium exceeds the water standard (50 mg/L) in about 55% of the analyzed sources while nitrite is responsible for the lack of quality in about 41% of the samples. On the other hand, the analyzed sources did not show metallic contamination. As a global perspective, only 36% of the water points analyzed in São Domingos fulfilled the quality standards.
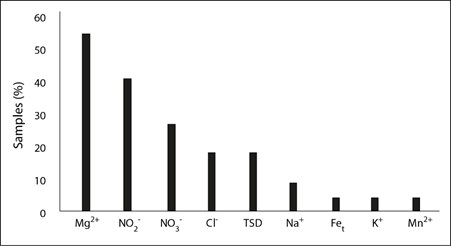
Fig 9: Samples exceeding the maximum permissible values (Decree-Law nº8/2004 of 23 February of the Republic of Cape Verde). Data from Gonçalves et al. (2015). TSD – Total Dissolved Solids; Fet – Total iron
Water supply is a critical topic in developing countries, which should be managed taken in account social, economic and environmental issues. In conditions of water scarcity, water supply systems are not likely to satisfy rising future demands. Limited water supply is generally accompanied by low sanitation conditions, with sewage flowing into soil, surface water and groundwater reservoirs. This, in turn, enhances potential for pollution and degradation of freshwater sources.
The present study covered topics such as the proportion of population with access to safe water, types of water sources and models of supply as well as quality issues in one of the regions with lowest public supply coverage. By analyzing the global situation in Cape Verde, it was found that it varies strongly at national level and also between urban and rural scenarios. Despite the evolution of the public service over the last years, the percentage of coverage does not comply with the Millennium Development Goals (MDGs).
The present review revealed some problematic clusters in the Santiago Island, which is the most populous island, with 24% of the population without public coverage. Specifically, in the municipalities of São Domingos and São Salvador do Mundo a significant part of the population stills dependent on precarious sources that do not always meet the legal quality standards (uncontrolled wells and springs). Moreover, inhabitants have to move a certain distance to get water, which most of the time is not monitored nor treated.
The limitations of the public water supply identified in Santiago Island could be extensive to other developing countries in Africa. Insufficient capital for infrastructures is a strong limiting factor for expanding the coverage rates and to assure monitoring and control of the water quality. Moreover, water scarcity is an unavoidable reality in arid countries, which tends to aggravate with climate disruptions. Therefore, an effective and extensive public water supply system for large part of the population is one of the major challenges that developing countries are facing today. For that, financing investment, international cooperation, and well-guided water policies are critical for sustainable development of countries like Cape Verde.
Nemias Moniz Goncalves avails to acknowledge Gulbenkian Scholarship Service from FCG (CALOUSTE GULBENKIAN FOUNDATION), for the granted individual scholarship, under the program of Postgraduate Scholarships for students of PALOP and East Timor - Stimulating research and professional appreciation, process Nº. 139758. The FCG has been an indispensable support in carrying out all academic activities. This work was also supported by the European Union through the European Regional Development Fund, based on COMPETE 2020 (Programa Operacional da Competitividade e Internacionalização) - project ICT (UID/GEO/04683/2013) with reference POCI-01-0145-FEDER-007690
ARE, (2015). Sistema tarifário águas de Santiago. Praia- Cabo Verde. Relatório final, 21pp.
Asefa, T., Clayton, J., Adams, A., Anderson, D. (2014). Performance evaluation of a water resources system under varying climatic conditions: Reliability, Resilience, Vulnerability and beyond. Journal of Hydrology, 508, 56-65.
View ArticleBrinkerhoff, W., Wetterberg, A., Wibbels, E. (2018). Distance, services, and citizen perceptions of the state in rural Africa. Governance, 31: 103-124.
View ArticleBosa, M.S. (2015). Water Institutions and Management in Cape Verde. Water, 7, 2641-2655.
View ArticleCarter RC (2006) Investigating options for selfhelp water supply: from field research to pilot interventions in Uganda: RWSN/ WSP, Available: . [Accessed May 2018].
View ArticleCarreira, P.M.; Marques, J.M.; Pina, A.; Mota Gomes, A., Nunes, D.; Monteiro Santos, F.A. (2008). Characterization of groundwater resources degradation at Santiago Island (Cabo Verde) ascribed to isotopic and geochemical signatures. Water Pollution IX (Ed. Prats Rico; Brebbia, C.A; Villacampa Esteva) WIT Press, 139-148.
View ArticleCarreira, P.M.; Marques, J.M.; Pina, A.; Mota Gomes, A.; Galego Fernandes, P.A.; Monteiro Santos, F.A. (2010). Groundwater Assessment at Santiago Island (Cabo Verde): A Multidisciplinary Approach to a Recurring Source of Water Supply. Water Resources Management, 24: 1139- 1159.
View ArticleCerezal, J.C., Gutiérrez, L. (2013). Introduction to water problems in Canary Islands.In: Environmental security, geological hazards and management. Proceedings from the 1st International Workshop, San Cristobal de La Laguna, Tenerife (Canary Islands), Spain, 10-12 April 2013, p.169.
Cirilo, J. A. (2008). Políticas públicas de recursos hídricos para o semi-árido. Estudos avançados, vol. 22, n.63, pp.61-82. ISSN 0103-4014.
View ArticleCruz-Fuentes, T. (2008) - Modelización hidrogeológica del acuífero de La Aldea (Gran Canaria). PhD thesis, Universidad de Las Palmas de Gran Canaria.
Cruz, V. J., Melo, C., Medeiros, D., Costa, S., Cymbron, R., Rocha, S., Medeiros, C., Valente, A., Mendes, S., Silva, D., Martins, F. (2017). Water management and planning in a small island archipelago: the Azores case study (Portugal) in the context of the Water Framework Directive. Water Policy, 19 (6): 1097-1118.
View ArticleDesalegn, W. (2005). Water supply coverage nd water loss in distribution systems: The case of Addis Ababa. MSc thesis, International Institute of Geo-information science and observation, 91p.
DouroECI (2018). Detailed design of two water supply systems in Santiago Island. [accessed in June 2018].
View ArticleEBES, (2013). Consultores Lda. Estudo de Viabilidade Económica do Sector da Água: Relatório Final: Deliverables 5 and 6. 2013.
Falkenmark, M. (1989). The Massive Water Scarcity Now Threatening Africa - Why Isn't It Being Addressed? Ambio, Vol. 18, 112-118.
Falkenmark M, Lannerstad M. (2010). Food security in water short countries-coping with carrying capacity overshoot. In Rethinking water and food security (eds L Martinez-Corina et al.), pp. 3-22. Fourth Boletín Foundation Water Workshop. Boca Raton, FL: CRC Press.
View ArticleFalkenmark M. (2013). Growing water scarcity in agriculture: future challenge to global water security. Philosophical Transactions of the Royal Society A, 371: 20120410. . [Accessed August 2018]. https://doi.org/10.1098/rsta.2012.0410
View ArticleFeyera, K., Hirpaa,A., Dyera, E., Hopea, R., Olagob, D., Dadsona, S. (2018). Finding sustainable water futures in data-sparse regions under climate change: Insights from the Turkwel River basin, Kenya, Journal of Hydrology: Regional Studies, 19, 124-135.
View ArticleGonçalves, N., Valente, T., Grande, J. A. (2015). Water quality in the Municipality of São Domingos (Santiago Island, Cape Verde). Comunicações Geológicas, 102, 119-123 ISSN: 0873-948X; e-ISSN: 1647-581X.
INE, (2010). Recenseamento geral da população e habitação - CENSO 2010. Praia. Cabo Verde.
INE, (2017). Estatísticas das famílias e condições de vida- Inquérito Multi-Objectivo Contínuo 2016. Praia, Cabo Verde.
INE (2018). Projecções demográficas, Santiago, Cabo Verde. [Accessed August 2018].
Irmler, I., Liu, L. (2013). Water Pricing in Cape Verde. Master Geographien der Globalisierung, Goethe-Universität Frankfurt am Main. Available from
View ArticleINGRH, (2010). Plano de Ação Nacional para Gestão Integrada dos recursos hídricos - PAGIRE, INGRH serie nº 45, 2, da Republica de Cabo Verde: Praia, Cabo Verde.
Kjellen, M, and McGranahan, G. (2006). Informal Water Vendors and the Poor. Available from on 31.01.2013
View ArticleLima, A. D. S., Garcia, E. O. (2011). Gestão de águas subterrâneas em ambientes insulares: caso de estudo da Ilha do Maio (Cabo Verde). In: VI Congresso sobre Planeamento e Gestão das Zonas Costeiras dos Países de Língua Portuguesa [Abstract in English].
Lima, D. M. (2013). Contribuição para Evolução do Abastecimento de Água em Zonas Rurais da Ilha de Santiago, Cabo Verde. MSc thesis, Instituto Superior Tecnico, Lisboa, Portugal. [Abstract in English].
Loan, J. Y. (2013). Water Supply System Development Project in Santiago Island. Cape Verde. Ex-ante Project Evaluation.
Marques, R.C., Simões, P., Berg, S. (2011). Water Sector Regulation in Small Island Developing States: An Application to Cape Verde. Water Policy. Available at _Regulation.pdf. https://doi.org/10.2139/ssrn.2117361
View ArticleMatos Alves, C. M., Macedo, J. R., Silva, L. C., Serralheiro, A., Faria, A. P. (1979). Estudo geológico, petrológico e vulcanológico da Ilha de Santiago (Cabo Verde). Garcia de Orta, Sér. Geol., Lisboa, 3 (1 -2), 47 -74.
Milliken, J. (2001). Qualitative Research and Marketing Management, Management Decision. 39 (1), 71-77.
View ArticleMota Gomes, A. (2007). Hidrogeologia e recursos hídricos da ilha de Santiago (Cabo Verde). PhD thesis. Departamento de Geociências. Universidade de Aveiro, 296p. [Abstract in English].
Mota Gomes, A., Lobo de Pina, A. F., Condesso de Melo, M. T., Marques da Silva, M. A. (2005). The importance of groundwater resources for the sustainable development of the Santiago Island (Cape Verde). General Proceedings: 32nd International Geological Congress, Florence, Italy, August 20-28, 2004. (Ed. Abbate, E.). International Union of Geological Sciences; European Commission).
OECD (2009). Managing Water for All. An OECD Perspective on Pricing and Financing - Key Messages for Policy Makers. Available from on 28.01.2013. https://doi.org/10.1787/9789264059498-en
View ArticlePina, A. (2014). As águas subterrâneas e a vulnerabilidade aquífera na ilha de santiago - Cabo Verde. PhD thesis UFC- Brasil. [Abstract in English].
PNUD/DDES CVI-87-001 (2005). Schéma Directeur pour la mise en valeur des resources en eau (1993 - 2005), Volume 1, Chapitre 3, pp. 3.14, Paris.
Rogers, P., Silva, R., Ramesh, B. (2002). Water is an economic good: How to use prices to promote equity, efficiency, and sustainability. Water Policy 4, 1-17 00004-1
View ArticleSantos, F. M., Almeida. P., Gomes, M., Pina, A. (2006). Hydrogeological investigation in Santiago Island (Cabo Verde) using magnetotellurics and VLF methods. Journal of African Earth Sciences, 45 (4-5), 421-430.
View ArticleSerralheiro, A. (1974). Santiago Island geology (Cabo Verde). PhD thesis, Universidade de Lisboa, Portugal [Abstract in English].
TNC (2016). Sub-Saharan Africa's Urban Water Blueprint: Securing Water Through Water Funds and Other Investments in Ecological Infrastructure. The Nature Conservancy: Nairobi, Kenya.
UNDP (2013). Preparação da IIIª Conferência Internacional sobre Desenvolvimento Sustentável nos Pequenos Estados Insulares em Desenvolvimento (prepared by Carvalho, J.). República de Cabo Verde, Relatório nacional.
UNDP (2015). An Island without water - strengthening climate-resilient management of water in Cabo Verde. [acceseds in June 2018].
View ArticleVörösmarty, C. J., Green, P., Salisbury, J., Lammers, R. B. (2000). Global water resources: vulnerability from climate change and population growth. Science, 289(5477), 284-288.
View ArticleWHO (World Health Organization) (2010).UN-Water Global Assessment of Sanitation and Drinking Water: Targeting resources for better results.
WHO (World Health Organization) (2011). Guidelines for drinking-water quality - 4th ed. WHO Library Cataloguing-in-Publication Data. ISBN 978 92 4 154815 1.
WHO/UNICEF(2012). Estimates for the use of Improved Drinking-Water Sources: Cape Verde. Available on 01.02.2013
View ArticleWHO/UNICEF (2015), WHO/UNICEF Joint Water Supply, & Sanitation Monitoring Programme. (2015). Progress on sanitation and drinking water: 2015 update and MDG assessment.
Wallingford, H.R. (2003). Handbook for the assessment of catchments water demand and use. DFID, Department for international development, HR Wallingford Limited. [accessed May 2018).
View ArticleUN (2013). List of Small Island Developing States. Availabe from 20.01.2013
View ArticleVan Damme (1981). Strategies for water supply systems in developing countries. Foundation International Reference Centre for Community Water Supply and Sanitation (IRC), Voorburg, the Netherlands. 70856-2
View ArticleVentura, J. E. (2009). A problemática dos recursos hídricos em Santiago. Proceedings of the 2nd "Congresso Lusófono de Ciência Regional, Cabo Verde, Redes e Desenvolvimento Regional, pp. 409-435. [Abstract in English].