Fatemeh Ghorbani
E-mail: tima.ghorbani@gmail.com
© 2019 Sift Desk Journals. All Rights Reserved
VOLUME: 4 ISSUE: 3
Page No: 427-439
Fatemeh Ghorbani
E-mail: tima.ghorbani@gmail.com
Yazdan Rahmatia, Masoomeh Ghorbanib, Hasan Mollanooria, Fatemeh Ghorbanic,d*
a Department of Medical Genetics and Molecular Biology, Faculty of Medicine, Iran University of Medical Sciences, Tehran, Iran.
b Department of Agronomy and Plant Breeding, Faculty of Sciences, Razi University, Kermanshah, Iran.
c Medical Biology Research Center, Health Technology Institute, Kermanshah University of Medical Sciences, Kermanshah, Iran
d Department of Biology, Faculty of Sciences, University of Sistan and Baluchestan, Zahedan, Iran
Fatemeh Ghorbani, Weighted Correlation Network Analysis of Multiple Sclerosis: Identifying Key Genes Involved in Disease Progress(2020)Journal of Computational Chemistry & Molecular Modeling 4(3)
Purpose: Multiple Sclerosis (MS) is an autoimmune inflammatory disease of the white matter of the central nervous system (CNS) characterized by demyelination and axonal loss that finally caused progressive neurodegeneration. In this study, we aimed to apply a new algorithm, weighted gene coexpression network analysis (WGCNA), to carry out a comprehensive expression data analysis.
Methods: We applied this method to datasets of MS patients obtained from the NCBI Gene Expression Omnibus. We identified network modules of co-expressed genes in the healthy subject dataset and verified their preservation in the MS dataset. Then, in the non-preserved modules, we selected hub genes that distinguishing normal from disease conditions and performed functional enrichment analyses of genes involved in these modules.
Results: We identified several genes that discriminate healthy subjects from MS patients that may play essential roles in MS development. Functional enrichment analysis revealed that they regulate leukocytes migration and its related pathways, the endocannabinoid system, and proteasome complex.
Conclusions: Our results indicated several genes essential for MS progress using WGCNA algorithm. These genes may be used as biomarkers for MS diagnosis or potential novel therapeutic targets.
Keywords: Multiple sclerosis, Gene expression, WGCNA, Systems biology, Transcriptional biomarkers
Immune system failure in the central nervous system is the main reason of multiple sclerosis (MS) as an inflammatory neurodegenerative disease (1-3). The immune system attacks to myelin sheath and starts the demyelination and axonal damage in central nervous system (CNS) (4, 5). Although many factors are proposed to associate with the MS, this autoimmune disease has unknown etiology (6).
There is evidence that environmental and genetic factors are obviously involved in MS, but their communication is complicated (7). MS is not a single gene disorder and different genes are involves in this multiple gene disease. It seems that MHC genes are the most important genes which are associated with MS. Activation of B and T cells lead to demyelination and sclerotic plaques in the brain cells. Most important cells are CD4+ Th1, Th17, T CD8+, B-lymphocytes, and activated microglia which involves in disease (8, 9). Myelin basic protein (MBP) defect also plays a role in disease (10). Previous researches emphasized on association of HLA allele DRB1*1501 with MS. HLA proteins are involved in the immune system, and this allele is responsible for almost half of the cases of MS by genetic reasons (7, 11).
Today, new approaches in genetic science make it easy to evaluating of the genes involved in the disease. Genome-wide association studies revealed that loci such as interleukin-2 receptor α, interleukin-7 receptor α, CLEC16A, CD6, CD58, IRF8, IL12A, Olig3-TNFAIP3, PTGER4, RGS1 and TNFRSF1A genes seem associated with MS (12). In addition to monitoring the sequence of the genome, the study of the expression of genes in healthy and patients also helps to diagnose the relationship between the genes and the disease. So far, many studies have been conducted on the expression profiles of healthy and MS patients and their results are available in the GEO database as datasets.
It has been recognized that the similar expression patterns may lead to similar biochemical and functional features so that genes with these similarities may create complexes or may act in similar pathways (13-15), however, microarray data just provides the expression profile of individual genes and does not reflect correlations among genes. The weighted gene co-expression network analysis (WGCNA) use differential co-expression network analysis algorithms to supply a general explanation of gene expression data by establishing gene networks based on similarities in expression profiles among genes across microarray samples (16). WGCNA can be used to find modules, the highly co-expressed genes that are closely connected in the network and form a sub-network region. It has been proven that modules: 1- conserved across phylogenies, 2- enriched in protein-protein interactions and 3- often consist of functionally related genes (13, 17-20). After finding the modules, WGCNA also enables to summarizing such modules to the most central and connected genes, that is the so-called hub genes.
In this study, we used WGCNA to constructing 2 gene networks based on normal and MS peripheral blood leukocytes expression data in GSE41890 dataset that make it possible to distinguish modules and hub genes that exhibit different network properties and may be contributed in pathological processes of disease and could serve as diagnostic biomarkers or as potential therapeutic targets.
2.1. Data selection, preprocessing and detection of outlier samples
In the present study, one expression array including GSE41890 obtained from the NCBI Gene Expression Omnibus (GEO). GSE41890 consists of 68 samples including 22 Multiple Sclerosis patients with samples both in remission and relapse and 24 healthy controls, this dataset was produced using Affymetrix Human Gene 1.0 ST Array. To normalize this dataset quantile normalization method in limma package used. For better results, we included only single measure for each gene, by the aggregate function in S4Vectors package, which gives an average measure of the probes for each gene. To evaluate the comparability of control and relaps samples, the soft Connectivity function in WGCNA package used(21). soft Connectivity evaluates two factors, 1) correlation of expression level of each gene between two datasets, 2) correlation of connectivity of each gene between two datasets. The datasets are comparable if two mentioned correlations are positive and have significance p.value. To remove outlier samples standardized connectivity (Z. K) method used and samples which had Z. K score< −2 deleted from the rest of the analysis.
2.2. Network construction and module detection
Two weighted gene co-expression networks according to control and relapse samples were made. Using pick Soft Threshold function that helps to choose proper soft-thresholding power, we selected soft thresholding power of 6 for providing scale-free topology fit index that reaches values above 0.9. After calculation of adjacencies, to minimize the effect of noise and spurious associations, adjacency results transformed to Topological Overlap Matrix (TOM). TOM of different datasets may have different statistic properties which can affect the results of comparing. Here scaling of Topological Overlap Matrices was used to mitigate the effect of different statistical properties and Quantile-quantile plot of the TOMs in control and relapse datasets to see what scaling is achieved. Results of TOM considered as input to produce dendrogram of genes, and cutree Dynamic function used for branch cutting. Minimum module size of 30, the module detection sensitivity deep Split 2 in block wise Consensus Modules function used for network construction. Finally, network modules of control and relapse datasets detected and control network modules considered as reference. The function module preservation of WGCNA package used to study the preservation of control modules in relapse samples. Zsummary as the output of module preservation function considered for detecting modules that preserved in both mentioned studies. Modules with Z score > 10 are well preserved between control and relapse samples and removed from the rest of analysis whereas Z score < 10 are less preserved and considered as the result of analysis.
2.3. Detection of hub genes and their functional annotations
Within detected module, the genes with the highest module membership scores are considered hub genes of that module. Next we carried out functional enrichment analyses of known genes in order to facilitate the interpretation of the biological mechanisms related to these genes. KEGG and STRING databases used to functional and biological interpretation of detected genes, using the KEGG database, important signaling pathways with P.value < 0.05 and combined Z value > 10 were identified. PPI network of detected genes was constructed by Search Tool for the Retrieval of Interacting Gene (STRING10.5; https://string-db.org/) with a combined score >0.4 as the cut-off point.
3.1. WGCNA prerequisites, outlier samples, batch effects, comparability
One of the key points in using the WGCNA package is the number of samples, the minimum number of samples for construction of weighted gene co-expression network is 15, the number of samples used in this study was 24 and 22 for control and relapse samples respectively, so was sufficient enough. The batch effect is not observed because only one dataset with one platform and one laboratory condition was used. As required for WGCNA package and based on the Z.K score, 5 outlier samples excluded from the control dataset (Figure 1), and also datasets comparability evaluated by the soft Connectivity function that provides positive correlation values when there is high comparability between two datasets. Our datasets were comparable because the overall gene expression correlation was (cor=1, p<1e−200) and the overall gene connectivity was (cor=0.58, p<1e−200) (Figure 2).
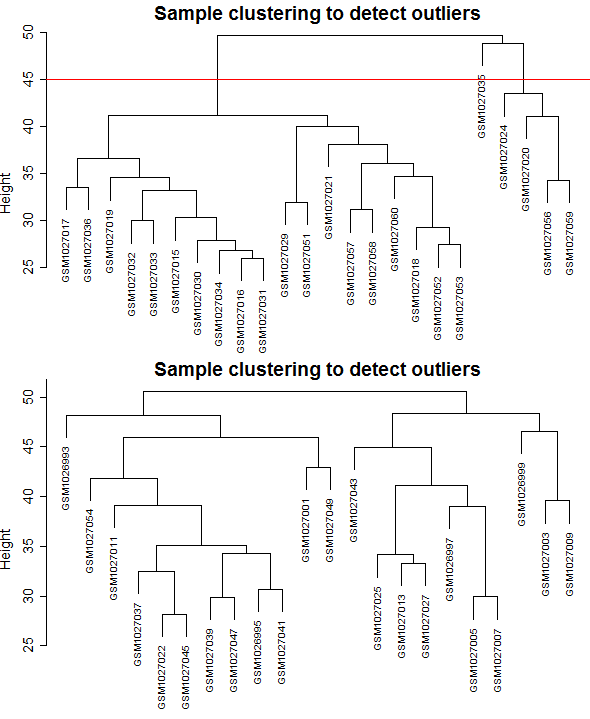
Figure 1: Clustering dendrogram of samples based on their Euclidean distance and detecting outlier samples. A) Control samples, B) Relapse samples.
Figure 2: results of softConnectivity. Correlations are positive and the p-values are significant for both datasets. In addition correlations and p-values are better for expression than for connectivity.
3.2. Identification of modules able to distinguish control from relapse datasets
Control and relapse datasets exhibited a scale-free topology because the Scale-free Topology Fit Index reached values above 0.9 for low powers (< 30), the powers were 6 for both control and relapse samples, and these results also show that there is batch-effects were not present in our datasets (Figure 3). After constructing weighted gene co-expression networks for each control and relapse expression datasets, the modules of each of these datasets identified. Based on the WGCNA package, a module is a group of strongly co-expressed genes, these genes have similar biochemical and functional properties or belong to similar pathways. By hierarchical clustering, 23 modules identified for the control dataset as the reference network, these modules have different sizes in term of the number of genes and labelled by the different colors which shows in Figure 1. By considering relapse dataset as a test network, we evaluated the preservation level across the two networks by finding modules that maintained in two datasets and modules that are not preserved in them. As expected, many of modules well preserved between two mentioned expression datasets and few of them were not preserved between them, so potentially related to the transition from control to the relapse phase of the MS disease. To quantify exactly the module preservation level, module Preservation function from WGCNA package was used. For each module, a Z-score representing the preservation level was calculated, modules with Z-score > 10 are well preserved between two datasets, whereas modules with Z-scores <10 are less preserved and can distinguish control from the relapse phase of MS condition (Figure 5).
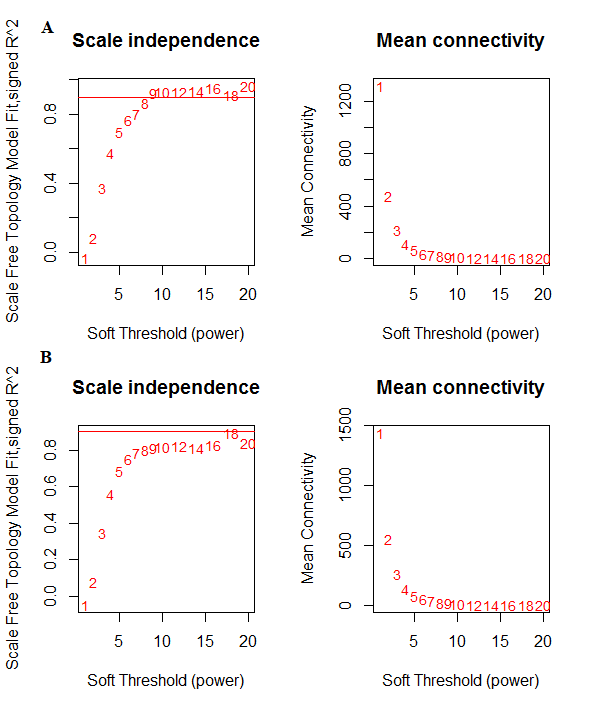
Figure 3: network topology for various soft-thresholding powers, the left panel shows the scale-free fit index and the right panel displays the mean connectivity for A) Control dataset. B) Relapse dataset
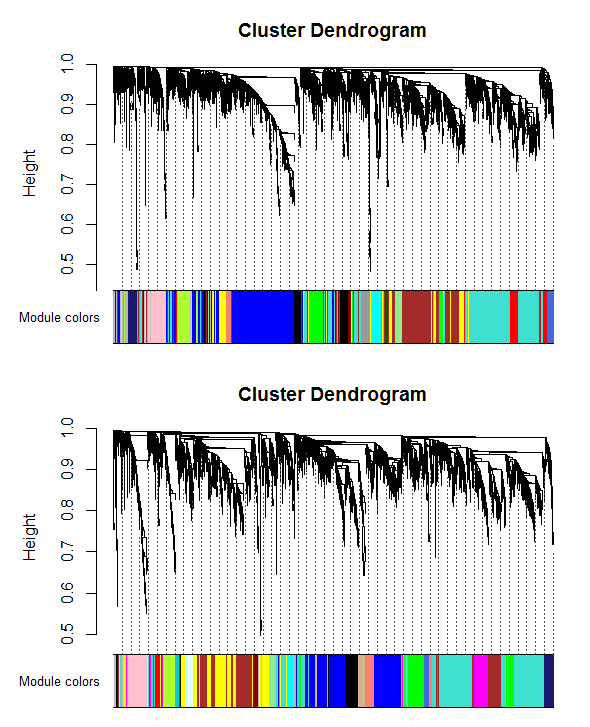
Figure 4: Clustering dendrogram of genes, with dissimilarity based on topological overlap, together with assigned module colors for A) control dataset, B) relapse dataset
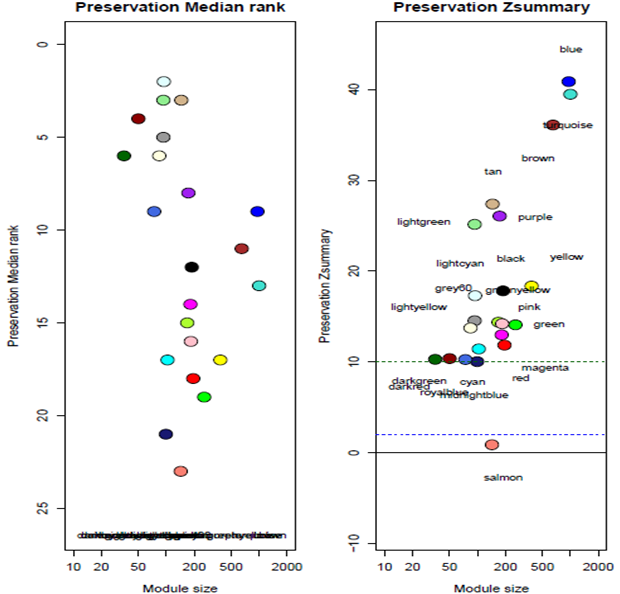
Figure 5: The medianRank and Zsummary statistics of module preservation of control modules in relapse modules (y-axis) vs. module size (x-axis).
3.3. Identification of hub genes and functional analysis
Since we found the salmon module that was not preserved between control and relapse phase of MS, it seems genes related to this module play an important role in the transition from the control to relapse phase. We set out to identify hub genes with the highest module membership scores in this module, these genes can be seen in table 1. To identify the most significant clusters of the detected genes, PPI network of them was constituted by STRING as shown in Figure 6. There are 115 nodes related to hub genes and 42 edged in the PPI network. According to the results of KEGG database analysis, the most important signaling pathways related to the transition between the control and relapse phase of disease are shown in Table 2.
Table 1: Hub genes identified in transition from control to relapse phase
|
Module |
Hub Genes |
|
Salmon |
AP3B1, NOTCH1, LSM6, NDUFA12, PSMB2, PTK2, ACTN1, CAPN3, CDC40, NDUFB5, PIK3CD, PLCB2, PSMD14, SNRPE, UTRN, TPX2 |
Table 2: the list of important signaling pathways related to hub detected genes
|
Signaling pathway |
P-value |
Combined Z Score |
Genes |
|
Regulation of actin cytoskeleton |
1.48E-04 |
46.41987445 |
FGF5;ENAH;FGD3;GSN;ACTN1;PIK3CD;ARHGAP35;PTK2 |
|
Axon guidance |
0.001873989 |
29.31920975 |
ENAH;FES;TRPC1;PIK3CD;PTK2;ROBO1 |
|
Amoebiasis |
0.004884885 |
31.23010309 |
ACTN1;PIK3CD;PLCB2;PTK2 |
|
Leukocyte transendothelial migration |
0.00837394 |
24.05749877 |
ACTN1;PIK3CD;ARHGAP35;PTK2 |
|
Inositol phosphate metabolism |
0.015739187 |
23.70537687 |
INPP5D;PIK3CD;PLCB2 |
|
Retrograde endocannabinoid signaling |
0.021311081 |
14.64989754 |
NDUFA6;NDUFA12;NDUFB5;PLCB2 |
|
Non-alcoholic fatty liver disease (NAFLD) |
0.021781788 |
14.4689709 |
NDUFA6;NDUFA12;NDUFB5;PIK3CD |
|
Fc gamma R-mediated phagocytosis |
0.027050939 |
16.76226699 |
GSN;INPP5D;PIK3CD |
|
Pancreatic secretion |
0.032686414 |
14.74904761 |
TRPC1;PRSS2;PLCB2 |
|
Phosphatidylinositol signaling system |
0.033537678 |
14.49033615 |
INPP5D;PIK3CD;PLCB2 |
|
Alzheimer disease |
0.033767455 |
11.16302716 |
NDUFA6;NDUFA12;NDUFB5;PLCB2 |
|
Glucagon signaling pathway |
0.037057307 |
13.51821301 |
PHKA1;CPT1B;PLCB2 |
|
Carbohydrate digestion and absorption |
0.038994651 |
20.77036361 |
PIK3CD;PLCB2 |
|
Proteasome |
0.040622396 |
20.05280586 |
PSMD14;PSMB2 |
Here we employed weighted gene co-expression network analysis (WGCNA), on expression data obtained from GSE41890 of MS and healthy specimens. By WGCNA, we discovered that one out of twenty network modules (salmon module) in the healthy network were not preserved in the MS network. This gene module may play a significant function in MS progress and, consequently, the hub gens within this module may serve as new diagnostic or therapeutic purposes. Afterward, we summarized the list of genes within this module by distinguishing only the hub genes or the most MS-associated genes according to WGCNA. Functional enrichment analysis of genes in salmon modules revealed that the most significant GO terms related to Leukocyte transendothelial migration and their associated events such as regulation of actin cytoskeleton and amoebiasis (probably amoeboid movement), inositol phosphate metabolism and pathway, and retrograde endocannabinoid signaling.
Leukocyte motility is requisite for trafficking inside lymphoid organs and for launching touch with antigen-presenting cells (22). MS as an autoimmune inflammatory disorder of the CNS, characterized by multifocal infiltration of auto-reactive T lymphocytes (such as CD4+ and Th17 lymphocytes), one type of leukocyte transendothelial migration, from blood circulation into the brain through the blood-brain barrier and currently this accepted as the primary step of pathogenesis in the disease (23-25). For reaching to sites of inflammation or CNS in this condition, auto-reactive T lymphocytes must first overcome endothelial cells (ECs), however, it has been surprisingly revealed that ECs support leukocytes during extravasation (26). The ECS support leukocyte extravasation by reconstruction of the endothelial actin cytoskeleton to confer the morphological alterations and accommodating leukocyte creeping on its apical surface and diapedesis beyond its cell body that facilitates leukocyte diapedesis. Actin-binding proteins (ABPs) play a focal function in the control of the cellular motility and actin cytoskeletal remodeling involved in diapedesis (27). ACTN1 (Actinin Alpha 1) is an actin-binding protein that involved cell motility and Immune Cell Transmigration (28-30). Also, based on functional enrichment, ACTN1 and some number of identified hub genes (such as PIK3CD, PTK2, and etc.) involved in leukocyte transendothelial migration, axon guidance, and amoeboid movement in addition to regulation of actin cytoskeleton that suggested these pathways are linked together. It seems that the amoeboid movement is an important mechanism in leukocyte migration or other words migration of leukocytes was occurred in a manner alike crawling amoeba because of fast cell shape alterations that are nearly exclusively induced by the cytoskeleton (31-34). UTRN that encode utrophin identified as a hub gene in our study, we suggest that because of its actin-binding activity may be involved in remodeling of the actin cytoskeleton. CAPN3 is a member of the calpain family of proteases that play a role in the regulation of cellular motility by regulation of dynamics of both integrin-mediated adhesion and actin-based membrane protrusion. Generally, adhesion and spreading; detachment of the rear; integrin- and growth-factor-mediated signaling; and membrane protrusion are the key aspects of cellular motility that Calpains family participate in them (35). Recently Kong et al. identified that CDC40 promotes proliferation, cell cycle, and migration in HCC cell lines (36).
The leukocyte migration cascade requires the activation of various signaling pathways, one of them is intracellular signaling through phosphatidylinositol 3-kinase (PI3K) (37-39). PI3K, a key signaling component involved in gradient sensing during amoeboid chemotaxis (such as leukocyte migration), coordinates polarity during cell migration (40). Among identified hub gene PIK3CD (is a class I PI3K found primarily in leukocytes) and PLCB2 (that catalyzes the hydrolysis of phosphatidylinositol 4,5-bisphosphate to the second messengers inositol 1,4,5-trisphosphate (IP3) and diacylglycerol) are involved in PI3K pathway and metabolism (41). Also, It is identified that actin remodeling in cell migration was regulated by non-canonical notch signaling through activating PI3K/AKT/Cdc42 pathway (42). PTK2 (involved in the focal adhesion kinase (FAK) signaling pathway) plays a crucial role in controlling cell motility, remodeling of the actin cytoskeleton, formation and disassembly of focal adhesions and cell protrusions (39, 43-45).
Currently, it was recognized that the nervous and immune systems share some fundamental biological principles, for example in axonal and leukocyte migration (46, 47). Also, may axon guidance proteins medaite an abnormal immune response against CNS (48). AP3B1 is a member of adaptor proteins (APs) that could mediate microtubule-mediated trafficking of lytic granules to the immune synapse (49). TPX2, a spindle assembly factor, required for normal assembly of microtubules and may participate in association with AP3B1 in microtubule-mediated trafficking of lytic granules (50). Generally, the shared hub gene among the aforementioned pathway suggests the relative communication of them.
Regarding proteasome, we identified PSMB2 and PSMD14 as members of proteasome complex that induce the production of peptides for presentation on MHC class I molecules (that presented peptides derived from endogenous proteins or proteins gained from the extracellular environment during cross-presentation) that also termed as immunoproteasome. It has known that stimulation of cells by pro-inflammatory cytokines lead to the replacement of most of their constitutively expressed proteasomes with immunoproteasomes (51). Dianzani et al indicated that extracellular proteasome-osteopontin circuit involved in MS implications through regulating cell migration. Immunoproteasomes processed osteopontin and release the active OPN fragments that lead to activate the chemotactic activity of it and boost an increased binding to chemotactic receptors that intensify its chemotactic activity towards migrating blood leukocytes (52).
Type-1 cannabinoid receptors (CB1) presented on neuronal mitochondrial membranes activate by exogenous cannabinoids and endocannabinoids and lead to restricting neuronal respiration by soluble adenylate cyclase-dependent modulation of complex I enzymatic activity (53). NDUFA12 and NDUFB5 are subunits of the multisubunit NADH: ubiquinone oxidoreductase (complex I) and probably are under the influence of endocannabinoid signaling. Preclinical data propose that cannabinoids and endocannabinoids may decelerate the progression of MS by exerting neuroprotective effects, thus modulating the endocannabinoid signaling may be potentially useful in the treatment of MS (54).
SNRPE and LSM6 gene, are components of U-class of small nuclear RNAs that play a role in pre-mRNA splicing and considering our knowledge MS is also associated with genome-wide defects in mRNA splicing. The Spurlock et al study indicated that mononuclear cells from subjects with RRMS uniquely show prevalent enhancement in the levels of polyadenylated ncRNAs such as Y1 RNA, 18S rRNA, 28S rRNA, U1, U2, and U4 snRNAs (55).
In the present study, we attempted to decipher potential molecular mechanisms in MS by using a comprehensive algorithm for system biology. The salmon module identified has been associated with the progression of MS, and functional enrichment analyses demonstrated that leukocyte transendothelial migration and its related pathways, endocannabinoid signaling, and proteasome complex involved in the progression of MS. Also, hub genes may be used as transcriptional biomarkers or potential therapeutic targets.