Introduction
The processes leading to and accompanying volcanic eruptions are characterized by ground deformation and strain changes. Detection of the strain associated with the preparatory phases and the following eruptive events is an open critical challenge. An important goal is to work toward measurements as precise as possible to enrich monitoring and volcanic surveillance. In principle, the high sensibility in detecting strain changes allows both improving the modeling of the eruptive processes and also highlighting possible precursors. The geophysical instruments with the best resolution are presently borehole strain-meters (BSM) originally designed to measure strain changes of tectonic and magmatic processes. The BSMs are very high-resolution measurement systems that complement and highly improve the modern deformation monitoring networks, reaching nominal resolution of 10–10 to 10–11, with dynamic range of 140 dB and frequency range 10–7 to >20 Hz. The oldest BSMs installed in volcano areas are the Sacks-Evertson design (Sacks et al., 1971) and the most used version, also called borehole dilatometer, measures the volumetric strain. Several tens of dilatometers now operate in different countries for geodynamic and volcano activity monitoring. In particular, they provided valuable information capturing high precision strain changes associated with the reawakening of volcanic activity, thus allowing improved understanding of the volcanic processes. Very famous cases are the eruptions at Hekla volcano (Iceland) in 1991 and 2000 which showed a similar pattern in pre- and co-eruptive strain changes (Linde et al., 1993; Sturkell et al., 2013). In 2000 the eruptive process produced again clear strain changes starting about 30 min before the surface breakout, thus allowing the successful prediction of the eruption onset with an official warning. Borehole dilatometers have also been installed on other volcano areas around the world, such Mauna Loa, Hawaii (Linde and Sacks, 1995; Johnston et al., 2001; Hurwitz and Johnston, 2003), Montserrat, WI (Voight et al., 2006; Chardot et al., 2010; Linde et al., 2010; Hautmann et al., 2014), Stromboli, Italy (Bonaccorso et al., 2012), Campi Flegrei, Italy (Amoruso et al., 2015), Izu-Oshima, Japan (Linde et al., 2016).
Mount Etna, the largest and most active volcano in Europe, is intensively and continuously monitored by different systems implemented during the last decades through permanent networks (seismic, tilt, GPS, gravimetric, magnetic, permanent cams). The installation of a network composed of four borehole dilatometers in 2011- 2014 (Bonaccorso et al., 2016) enhanced the multi-disciplinary monitoring of the volcano, providing a very high precision tool able to detect and infer different eruptive phenomena. A critical aspect is the correct calibration of the instruments after their installation. In this work we also describe the different approaches we investigated to check instrumental response.
Since, on Etna, there are now years of strain data available, the continuing activity of the volcano offers an unparalleled opportunity to take advantage of this monitoring advancement. Here we review samples of that activity and demonstrate that the strain data allow important improvements in our capability to model and understand the sources of volcanic activity.
The borehole dilatometers network revealed strain changes related to different volcanic activity that allowed us better to infer and interpret the related processes. In particular, in this work we will present the strain changes and the interpretations regarding different eruptive typologies, such as: the dike intrusion accompanying the December 24, 2018 flank eruption, the explosive activity of the 2011–2013 lava fountains from New South-East crater (NSEC) and 2015 powerful explosive sequence from Voragine crater (VOR), the summit lava flows outpouring from summit craters during March-April 2017.
For the cases related to the explosive activity (i.e., the lava fountains from NSEC crater), we show high precision strain recorded changes, not detected by other deformation monitoring systems such as GPS and shallow borehole tiltmeters. These detected strain changes allowed us to model the source discharging the magma during the explosive activity, and also to estimate the erupted volumes coming from its emptying. The borehole dilatometer data provided also important information during the two powerful explosive sequences from Voragine crater (VOR) in December 2015 and May 2016, respectively.
In the case characterized by small and repeated moderate explosive activity accompanied by overflows from the summit craters, the strain signals, appropriately filtered, showed unprecedented ultra-small changes (10–8 – 10–9), preceding and accompanying the 2017 modest explosive-effusive activity. In the case of dike propagation we report on the signals recorded during the December 2018 eruption of Etna generated by a violent intrusion, and we show that the dilatometer network was able to detect the beginning of the propagation of the dike about 2 h and 40 min before the formation of the eruptive fissures.
Besides giving an overview of the various calibration methods developed during the last decade and to update the main results obtained in various previous works (i.e., Bonaccorso et al., 2013b; Currenti and Bonaccorso, 2019), this study presents new approaches and new data with related interpretations. In particular, with regards to the explosive sequence of December 2015, a more advanced numerical model was developed than the analytical model applied in previous studies (Bonaccorso and Calvari, 2017). Moreover, the original data of the intrusion of 24 December 2018 are presented, highlighting the important related implications. All these results, obtained through the borehole dilatometer network of Mt. Etna volcano, highlighted how this type of instruments can provide valid and advanced contribution to the understanding and interpretation of different eruptive activities.
Network and Data Calibration
Network
The classical sensing unit is a liquid-filled cylindrical tube 3–4 m long, which is installed in a deep (usually > 100 m) drilled hole and coupled to the rock walls by using expansive cement. Changes in the sensing volume produce changes in position of the top of a connected bellows resulting in very high hydraulic amplification. Over time there have been technological advances, but basically the operational principle has remained the same (Sacks et al., 1971; Roeloffs and Linde, 2007). After a long preparatory phase a network of 4 borehole dilatometers has been installed on Etna (Figures 1a,b). This activity took place in two successive phases (2010–2011 and 2014) supported by two research projects financed by government national funds. The borehole dilatometers were installed in holes drilled at depths ranging from 170 (DRUV station) to 162 m (DEGI) and 110 m (DMSC and DPDN).
FIGURE 1
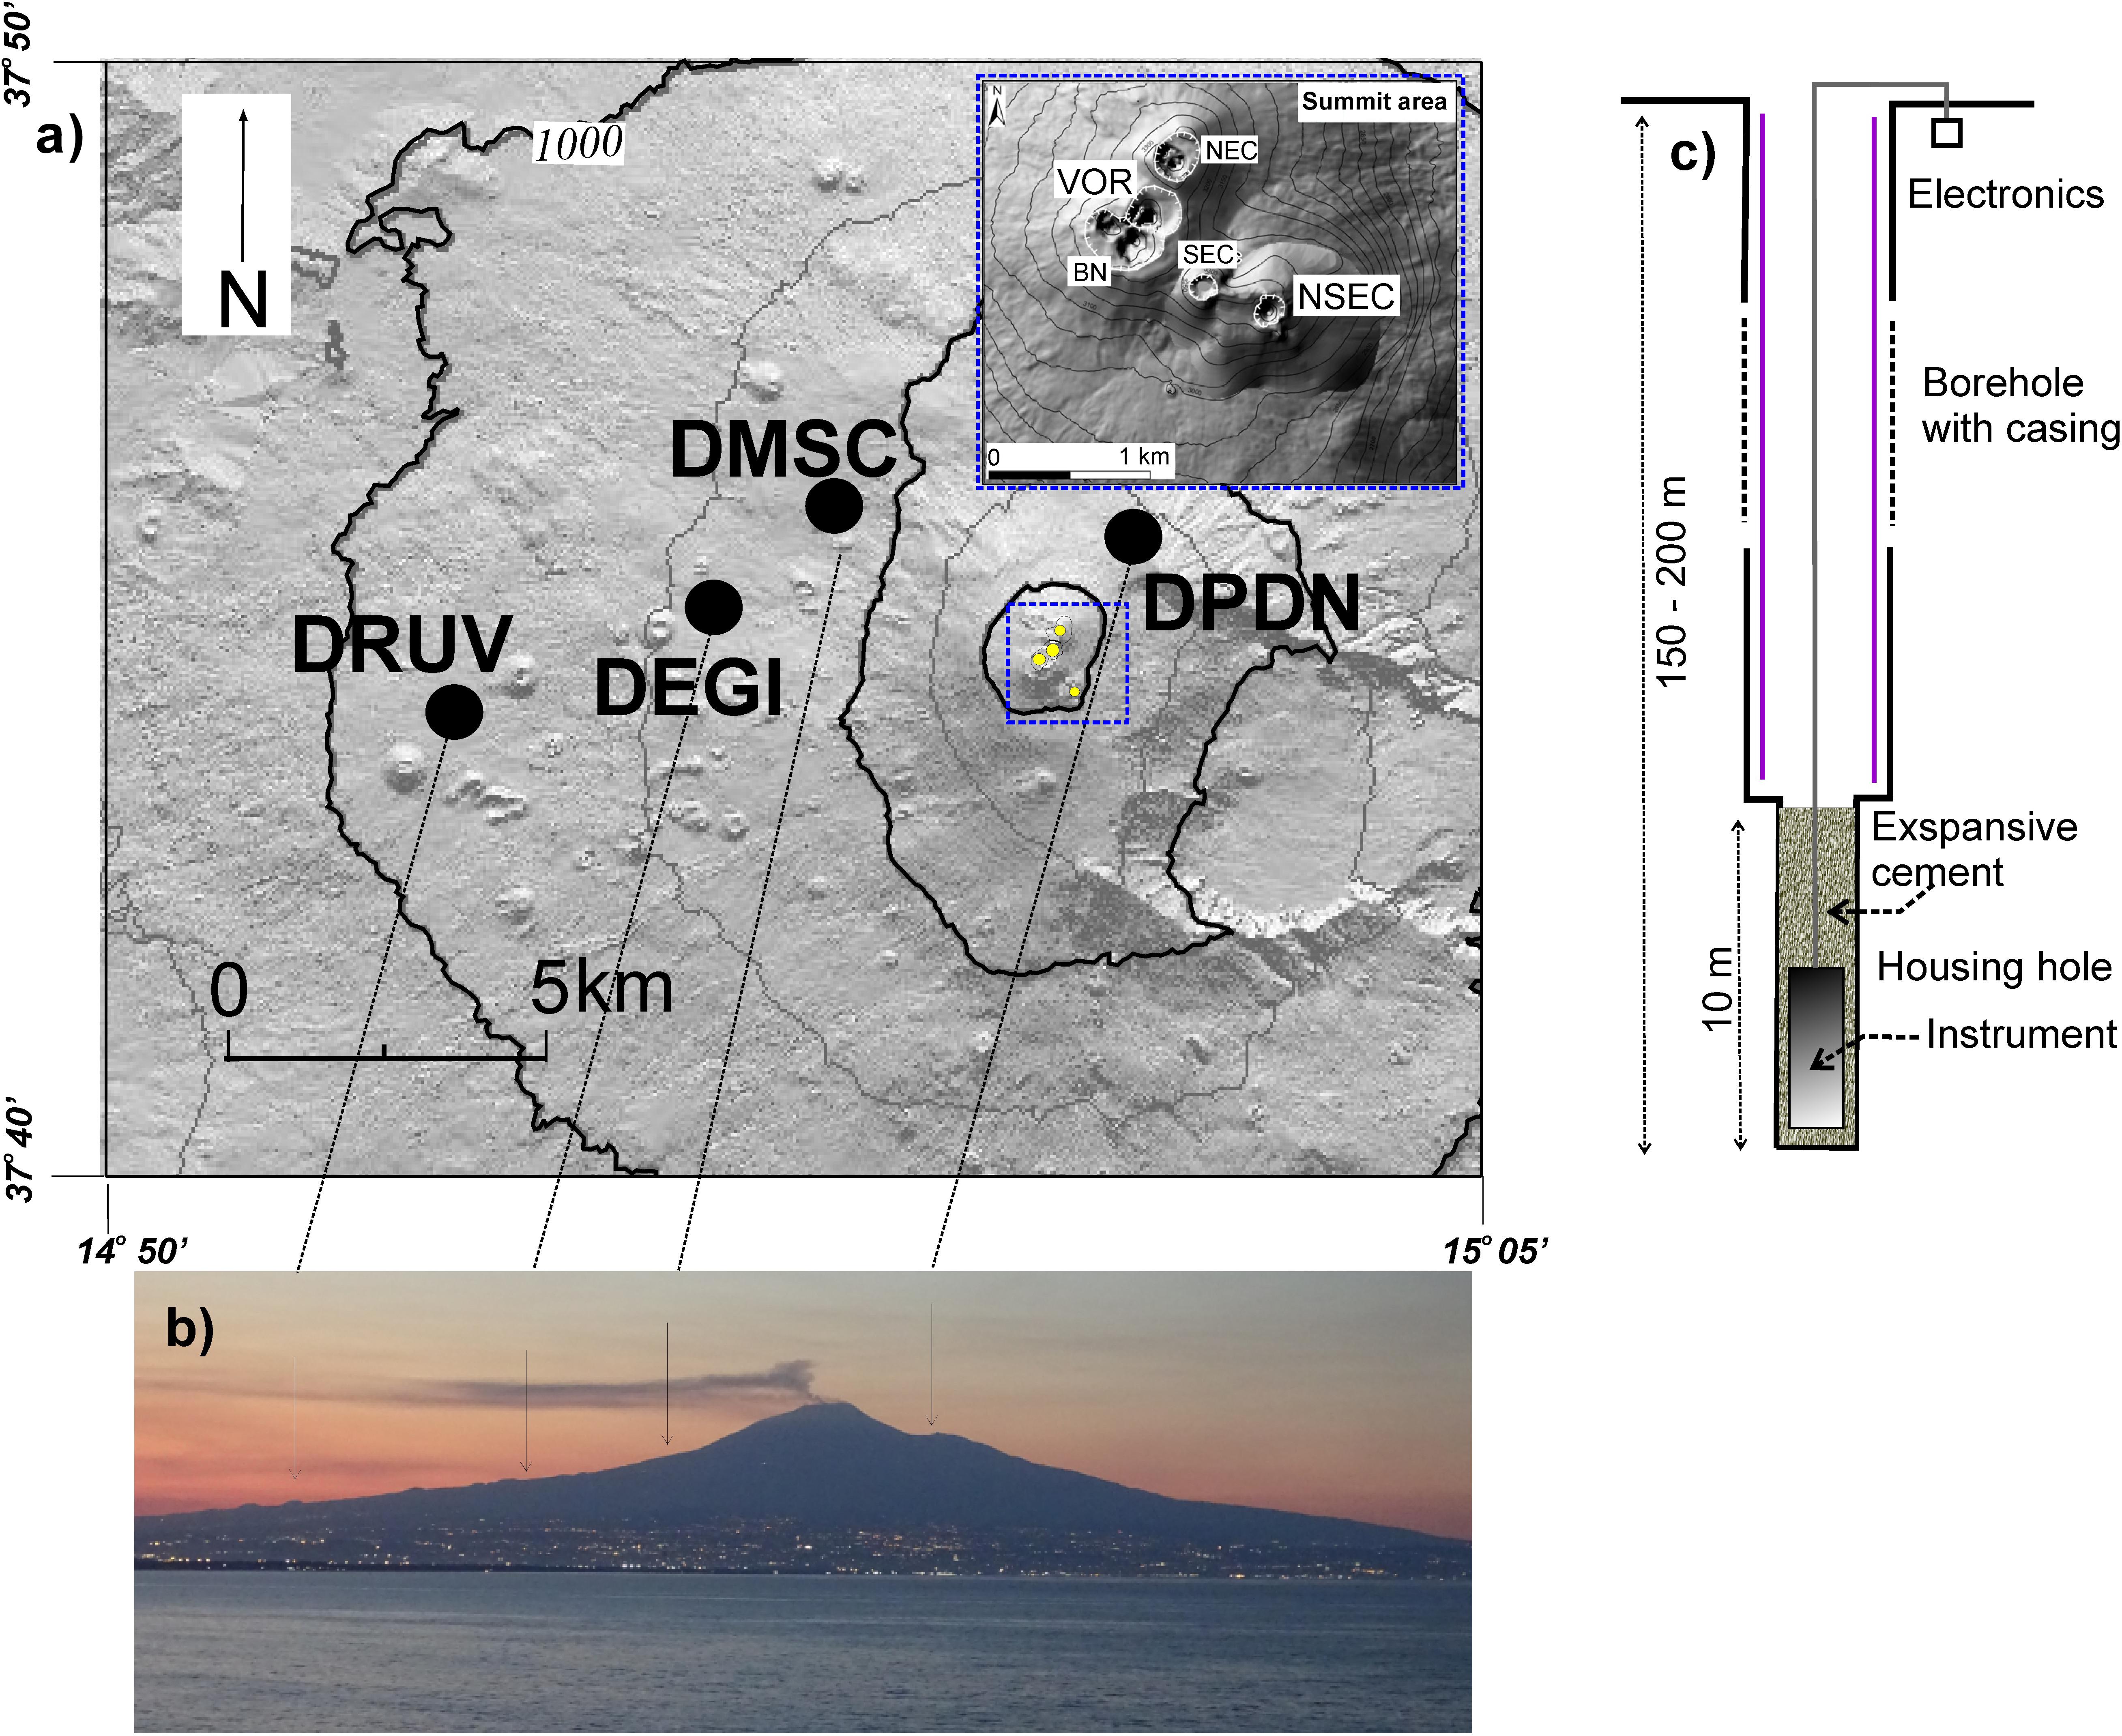
Figure 1. (a) Map of Etna volcano with the borehole dilatometer positions. In the inset is shown the detail of the summit craters. The more active of them were New South-East crater (NSEC) with 45 lava fountains in 2011–2014 and Voragine (VOR) with two powerful explosive sequence in December 2015 and May 2016 (b) Etna seen from the South. Along the W-E profile of the volcano the positions of the dilatometer stations are indicated. (c) Diagram of the installation of a borehole dilatometer.
The choice of the four sites addressed the following main requirements: (i) to locate the profile with the installations in the W flank. This sector, as is well known in the literature (i.e., Bonaccorso and Davis, 2004), is the one with deformation that better responds to the phases of accumulation (inflation) and release of magma (deflation) caused by the volcanic source respectively before and during eruptions, (ii) create a profile with the installations placed along the radial direction with increasing distances from the summit area toward the outer side of the volcano. This solution was aimed to constrain the volcano sources through the decay of their strain effects with the recording distance: for dilatational strain, the polarity of the signal reverses at a radial distance that depends on the depth of the source.
The final positioning of the sensors was in rock of different quality: very massive basalt at DRUV, massive basalt with presence of fractures at DEGI and DMSC, and welded pyroclastics at DPDN. As shown in the next section, DRUV, installed in the deeper depth and in the most massive basalt, showed the best response and sensitivity.
A scheme of the instrumental installation is reported in Figure 1c, while a detailed updated description of the dilatometer instrumental characteristics is reported in Roeloffs and Linde (2007). A description of the four installations of Etna network is reported in Bonaccorso et al. (2016).
Calibration Through Different Approaches
The Earth’s surface is extremely noisy, making the potential detection of extremely small changes (nano- to pico-strain) induced by seismic preparatory phase or by volcanic activity very difficult. Placing the sensor at depths below 100 m from the surface (usually in boreholes), and fixing it to the surrounding by depositing an expansive cement in the bottom of the hole, enables a large improvement in the signal-to-noise ratio. However, the final response and accuracy depend on various factors such as the success of the instrument-medium coupling, the quality of the rock where the instrument is installed, possible environmental disturbances (such as groundwater movements, rain pore pressures, temperature variations in depth). Therefore, after installation, it is critically important to determine the response of the instrument by using in situ calibrations.
Such calibrations are usually made by comparing the recorded strain with estimated reference signals such as the ones produced by diurnal tides, or by the traveling waves of teleseismic events. Tidal calibration is the most common method, and it consists of comparing the recorded amplitudes and phases of M2 (12.42 h) and O1 (25.82 h) tidal components with the computed theoretical values (e.g., Roeloffs, 2010; Hodgkinson et al., 2013; Langbein, 2015, and references therein). We estimated the M2 and O1 components in the strainmeter recording by using the BAYTAP-G software (Tamura et al., 1991). For these components the theoretical tidal volumetric strain was calculated by using the SPOTL package (Agnew, 1996).
The second calibration approach consists of comparing the recorded dynamic strain amplitude of long-period surface waves from strong distant earthquakes (teleseismic events, M ≥ 8) with calculated synthetic strain waveforms. Broadband synthetic seismograms can be computed based upon normal-mode theory (Gilbert, 1971; Gilbert and Dziewonski, 1975). A first application on strain signals at Etna was performed after the first installation of DEGI and DRUV stations (Bonaccorso et al., 2016).
The critical point is that both of these calibration methods require a model for expected tide and teleseismic waves, respectively, to produce the theoretical strain to compare with the recorded one. However, in principle, the effect of distortion on the local strain field could affect the general model. To overcome this aspect, recently Currenti et al. (2017) proposed a new approach based on direct comparison of the strain recorded by the borehole dilatometer with the seismic strain of teleseismic waves recorded from a nearby broadband seismic array around the dilatometer site. This method was applied to DRUV, considered as a reference station since the coupling with the surrounding medium is very good, as confirmed by the excellent detection of tidal and seismic waves.
It is noteworthy that the different approaches obtained comparable coefficient values at different investigated frequency bands: (i) in the diurnal and semidiurnal period for tidal analysis, (ii) in the range 100–200 s for theoretical seismic strain comparison, and (iii) in periods less than 40 s through the comparison with strain estimates from broadband seismic signals (Figure 2). To the best of our knowledge, DRUV is the only borehole dilatometer in which three different calibration approaches have been tested by comparing recorded signals with theoretical tides, with synthetic straingrams from distant strong earthquakes, and with direct strains calculated from the recorded seismic waves.
FIGURE 2
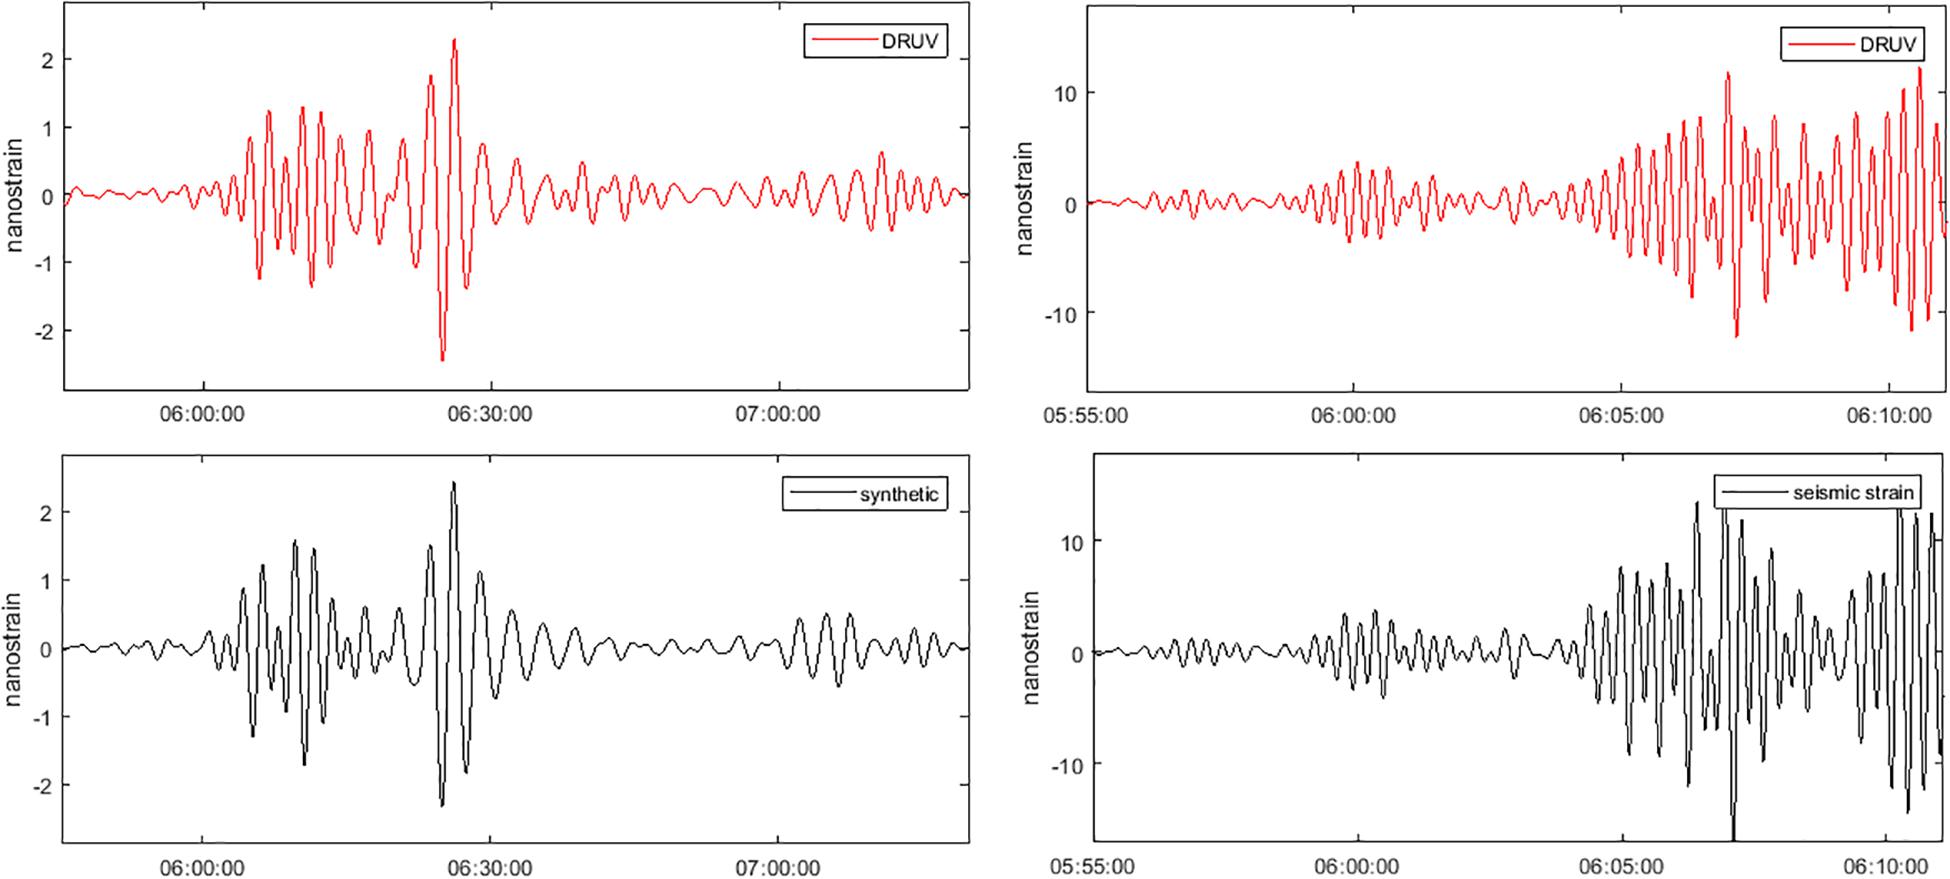
Figure 2. (Left) calibration through the Sea of Okhotsk (Western Pacific Ocean) M8.4 earthquake of 24 May 2013. At the top (red signal) the DRUV recorded strain signal, sampling 1 s, low-pass filtered 100 s < P < 200 s (counts). At the bottom (black signal) the synthetic strain (Bonaccorso et al., 2016) filtered in the range period 100 s < P < 200 s (nanostrain). (Right) Comparison between dynamic volumetric strain for the 24 May 2013, Mw8.3 Sea of Okhotsk event from inversion of the seismic displacements (black) from a nearby seismic broadband array and dilatometer signal at DRUV (red) filtered at 16–33 s (0.03–0.06 Hz). In both approaches we obtained the same calibration coefficient, such as the one obtained by the tide comparison, of 0.005 counts/nanostrain.
Probably due to a shallower installation depth and to the less massive quality of the rock around the hole’s bottom, the dilatometers installed in the second phase (DMSC and DPDN) showed a lower sensitivity than that at DRUV. This was testified by the weak presence of tidal wave components and the poor correspondence between the recorded and the synthetic teleseismic signals at these two stations. To overcome this problem and calibrate the dilatometers at DMSC and DPDN, Bonaccorso et al. (2016) calculated the signal energy ratios with respect to DRUV. They applied the discrete Fourier transform to the signals and computed the power spectral density to define the amplitude ratios of DMSC and DPDN signals.
In order to calibrate less accurate stations a further, simple but very effective, approach is the direct comparison of the strain signals recorded during the passage of teleseismic waves.
The comparison should be made with a station having a very accurate and stable response over time, as in our case the DRUV site. We can estimate the relative sensitivities of the two sites by comparing surface wave amplitudes from distant very large earthquakes. This relative comparison method can be a valid approach especially for assessing the response of stations installed from shorter time and that, due to post-installation adjustment, may show a less stable response. An application example is that of the M6.8 earthquake of 25 October 2018 from Greece (Figure 3). This shows that the sensitivity of the younger stations DMSC and DPDN is lower than that for DRUV by a factor of 0.075 and 0.15 (±10–15%), respectively.
FIGURE 3
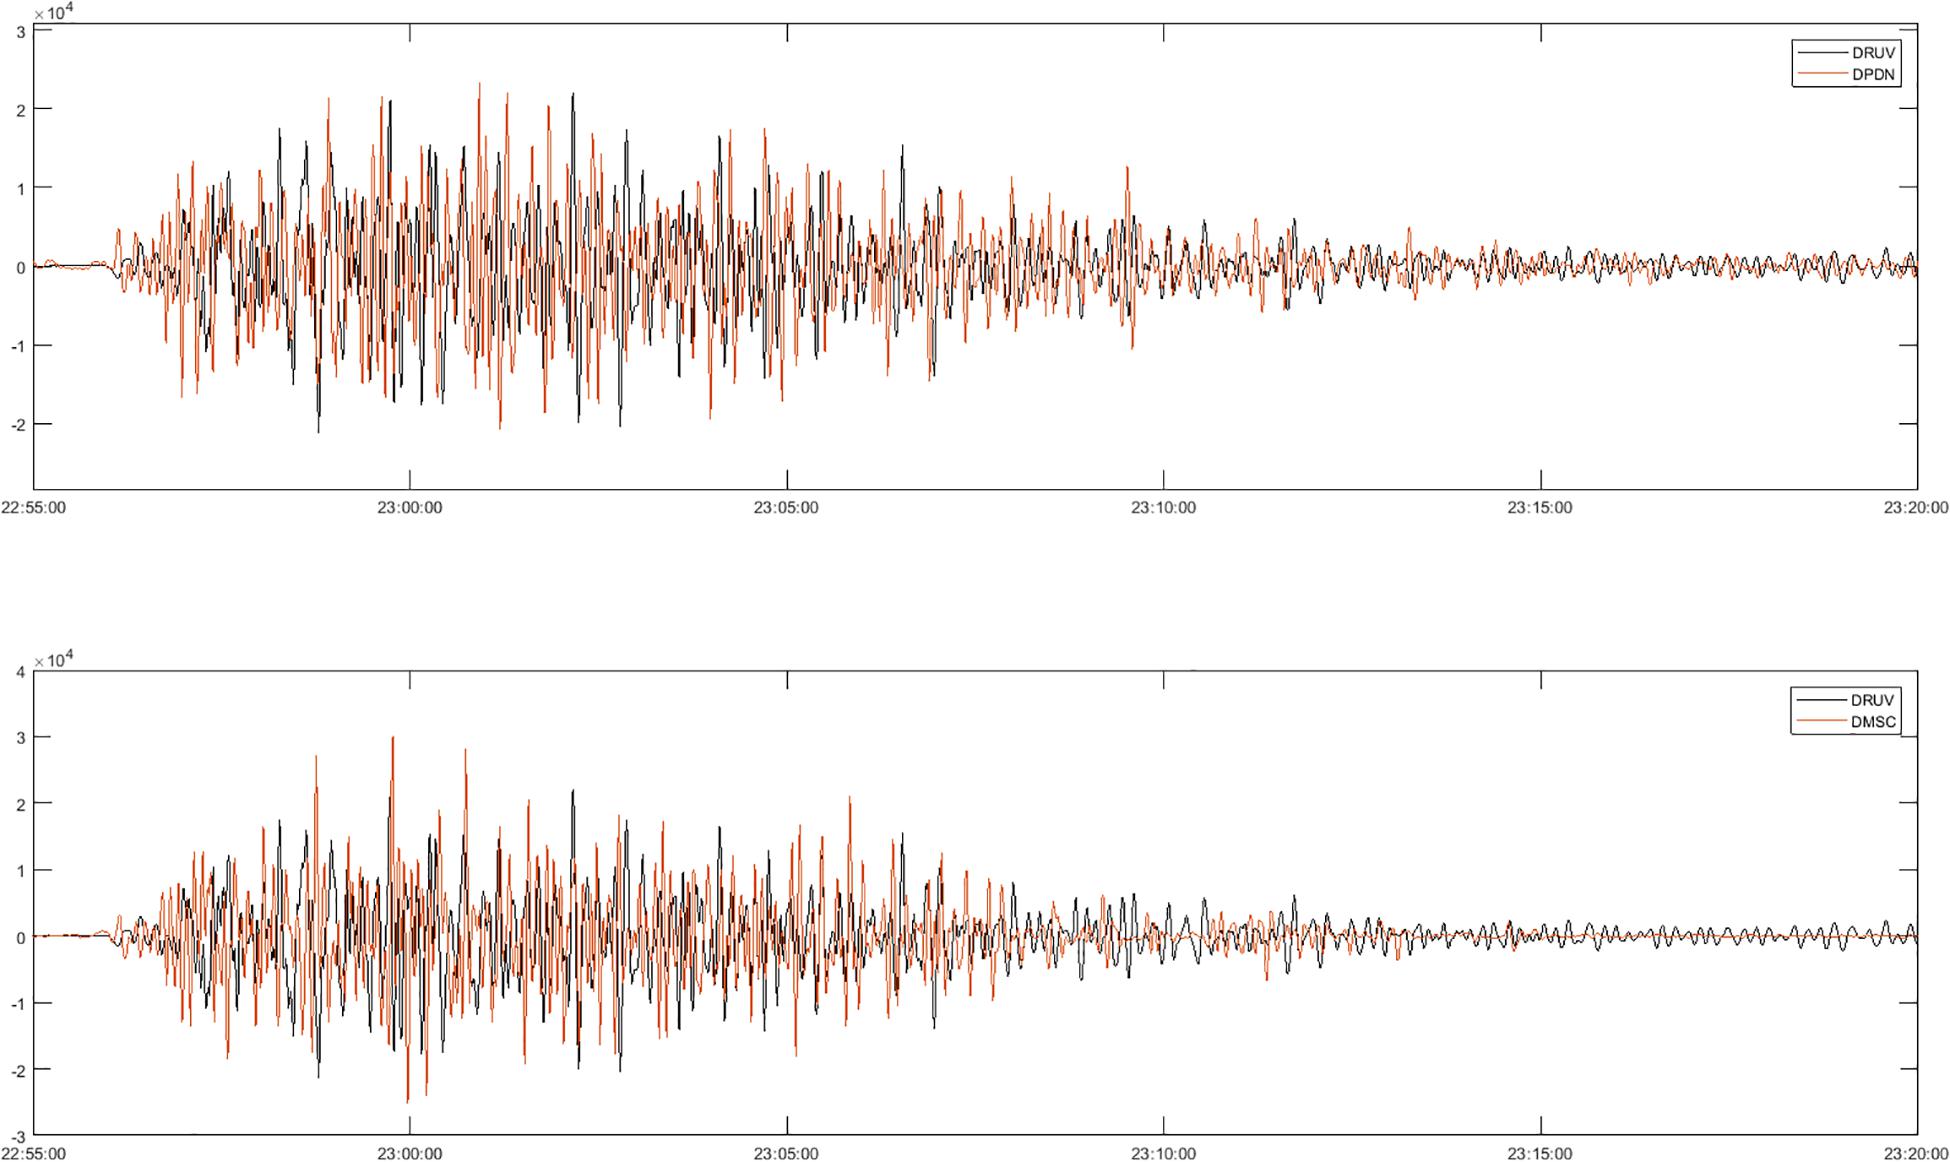
Figure 3. Example of relative calibration approach used to check the DMSC and DPDN response with reference to DRUV by using the teleseismic event M6.8 of 25 October 2018 from Peloponnese, Greece. DRUV signal is in counts. DMSC and DPDN signals recorded in counts have to be multiplied by 15 and 30, respectively, to obtain a good overlap with DRUV signal. In this case the relative comparison with DRUV gave coefficient of 0.075 and 0.15 counts/nanostrain for DMSC and DPDN, respectively.
Borehole Strain and Explosive Activity: Lava Fountains (2011–2013, 2014) and Violent Explosive Sequences (2015, 2016)
Lava Fountains From NSEC Crater
The fire or lava fountain style of volcanic activity is characterized by near steady discharge of magma, which is erupted into a mixture of released gas and pyroclastics (e.g., Wilson and Head, 1981; Head and Wilson, 1987; Calvari et al., 2018). Lava fountains at Etna show often a high explosive power with the formation of a several kilometer high eruptive column. After the flank eruption of 2008–2009, Mt. Etna was characterized by a lively eruptive activity. From January 2011 to December 2013, a sequence of 44 such events took place from a pit crater on the east flank of one of the four summit craters of Etna (the South-East Crater, SEC), forming a new summit cone [the New South-East Crater, NSEC (Behncke et al., 2014; De Beni et al., 2015)]. After moderate lava effusion from the NSEC toward NE during January–April and July–August 2014, on 28 December 2014, a further lava fountain episode occurred (Gambino et al., 2016). Lava fountain episodes from the NSEC showed almost similar characteristics: the height of the lava fountain reaching 300–1,000 m, ash columns reaching 5–9 km, and associated 4–6 km long lava flows descending the eastern flank of the volcano. After the 2011–2014 NSEC lava fountains, two powerful explosive sequences of 4 and 3 events were erupted from the main central crater Voragine (VOR) on 3–5 December 2015 and 18–21 May 2016, respectively. The December 2015 impressive sequence of close events of lava fountains with the associated ash fall-out caused problems for the infrastructure of the town of Catania and other villages around Etna, and the episodes also caused frequent temporary closures of the Catania international airport. A complete review of the eruptive activity during 2011–2015 is reported in Calvari et al. (2018).
During the 2011–2013 NSEC lava fountains the permanent GPS and the borehole tiltmeter networks did not record significant changes. However, due to the high sensitivity of the borehole dilatometers, clear strain changes were revealed (Bonaccorso et al., 2013a, b, 2014). The duration of the strain change coincides with the duration (few hours) of the lava fountain. For each episode the strain change was detected during the eruptive event, starting suddenly at the lava fountain onset and continuing until the end of the eruption (Figure 4). This supports the interpretation that the explosion occurred suddenly without producing any clear strain precursor. The high rate of emitted magma caused the contraction of the shallow source that produced the observed strain during the eruption.
FIGURE 4
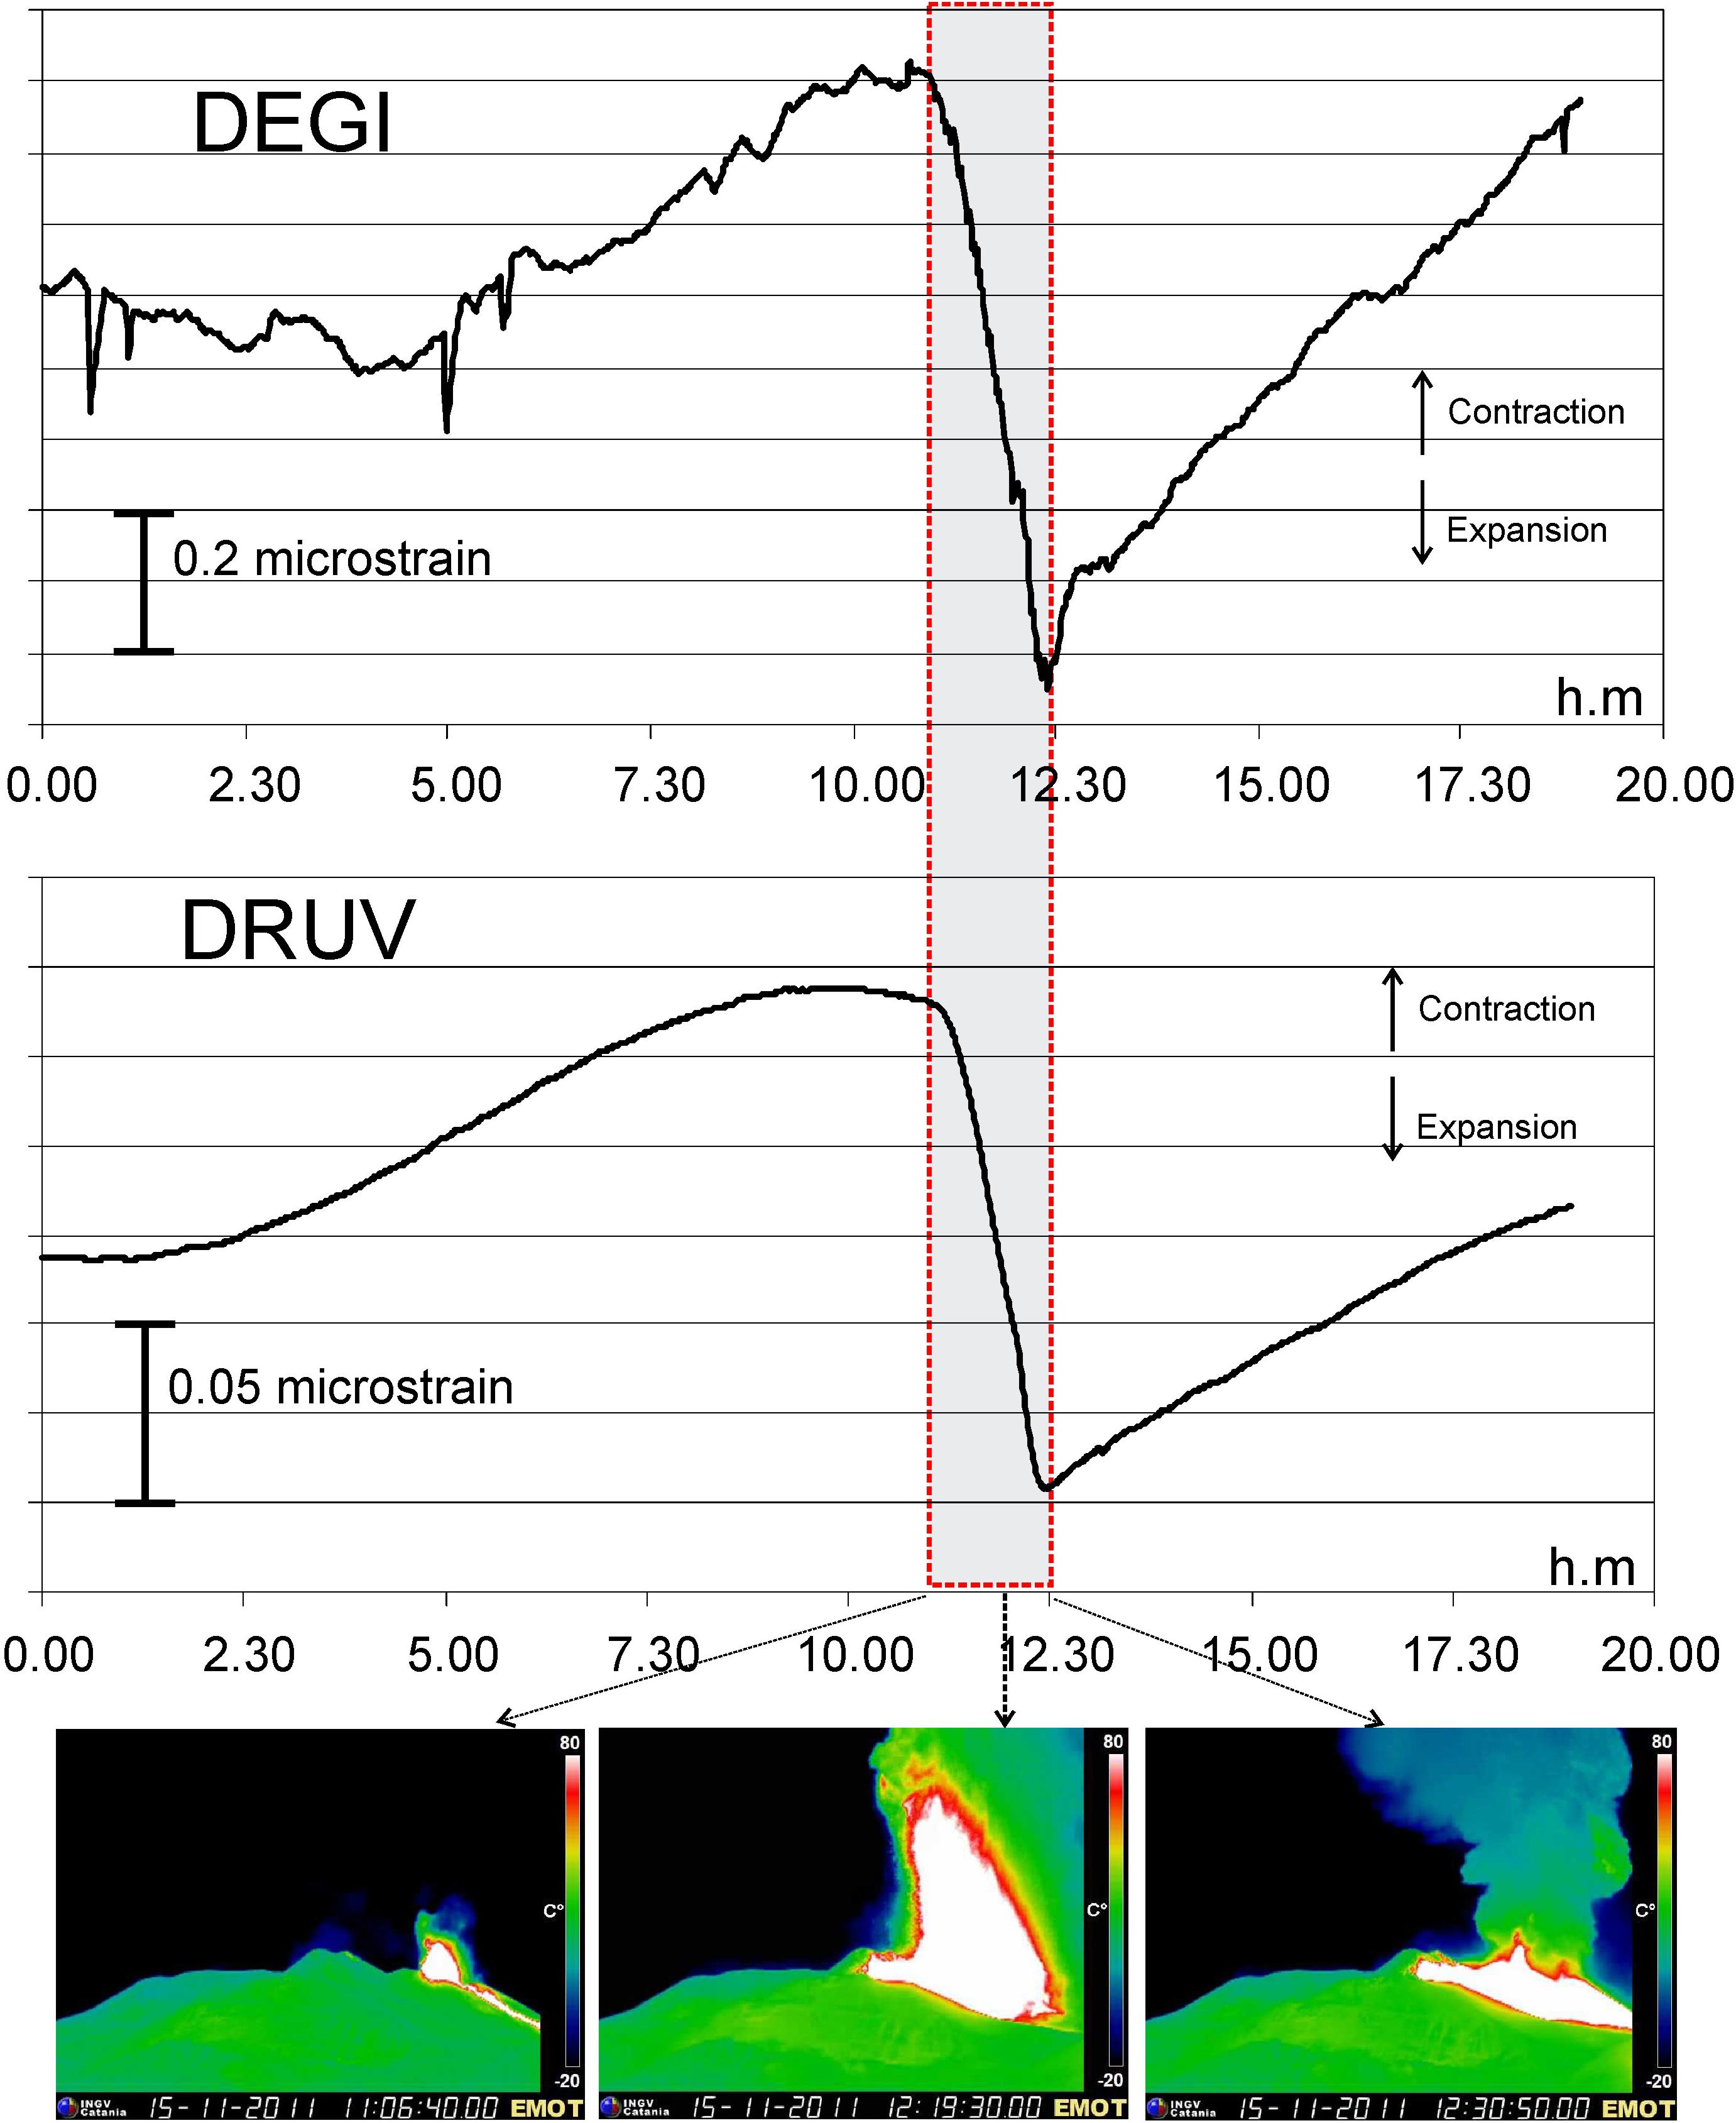
Figure 4. Strain recorded at DEGI and DRUV stations during the lava fountain on 15 November 2011. Negative change means expansion and positive contraction of the medium around the instrument, respectively. At the bottom the frames from the thermal cam of Montagnola (South flank, 2700 m a.s.l.) are shown. During all recorded lava fountains of 2011–2014 he strain signals recorded at DRUV and DEGI stations showed negative changes (medium expansion around the sensor).
The first installed DEGI and DRUV stations always recorded negative changes, i.e., expansion of the medium around the sensor, of the same order of magnitude of ∼0.8 microstrain (DEGI) and ∼0.15 microstrain (DRUV), thus of the same small order of magnitude of the strain induced by the lunar tide or by distant teleseismic event (M∼8). An example of DRUV signal of 11 April 2012 showing the recording of the M 8.6 and M 8.2 tele-seismic events from Sumatra, and the change associated with the lava fountain is reported in Figure 5. During strong degassing accompanying strombolian activity (but without high rates of emitted magma such as that from a sustained lava fountain) the recorded strain signals showed no changes. Strain suddenly changed only during the lava fountain, which emitted a huge quantity of magma in few hours, rapidly emptying the shallow reservoir. This implies that the strain is sensitive to the magma output and the source emptying (e.g., Bonaccorso et al., 2013b, 2016). Similar conclusions were also obtained from strain changes recorded during the frequent Vulcanian eruptions at Sakurajima volcano (Iguchi, 2016). Based on this consideration, Bonaccorso et al. (2013b) used the precise strain changes recorded during the lava fountains to infer characteristics of the deflating source by using a finite element method (FEM) approach able to take into account both the real topography and the medium heterogeneities (Figure 6). The numerical computations estimated a source at about 0 km b.s.l., slightly elongated vertically (ellipsoid aspect ratio of 0.5). The computational domain of the elastostatic model takes into account the real topography and the elastic medium heterogeneity. In Figure 6 the color scale indicates the values of rigidity modulus in GPa (Patanè et al., 2003). A detailed description of the model setup can be found in Currenti et al. (2010). This source represents the shallow storage where bubble-rich magma is trapped and then violently released through lava fountains and which underwent a volume change of ∼2 × 10⁶ m3 that, considering the magma compressibility at that shallow depth, infers a mean total emitted magma volume of ∼2.5 × 10⁶ m3 (Bonaccorso et al., 2013b).
FIGURE 5
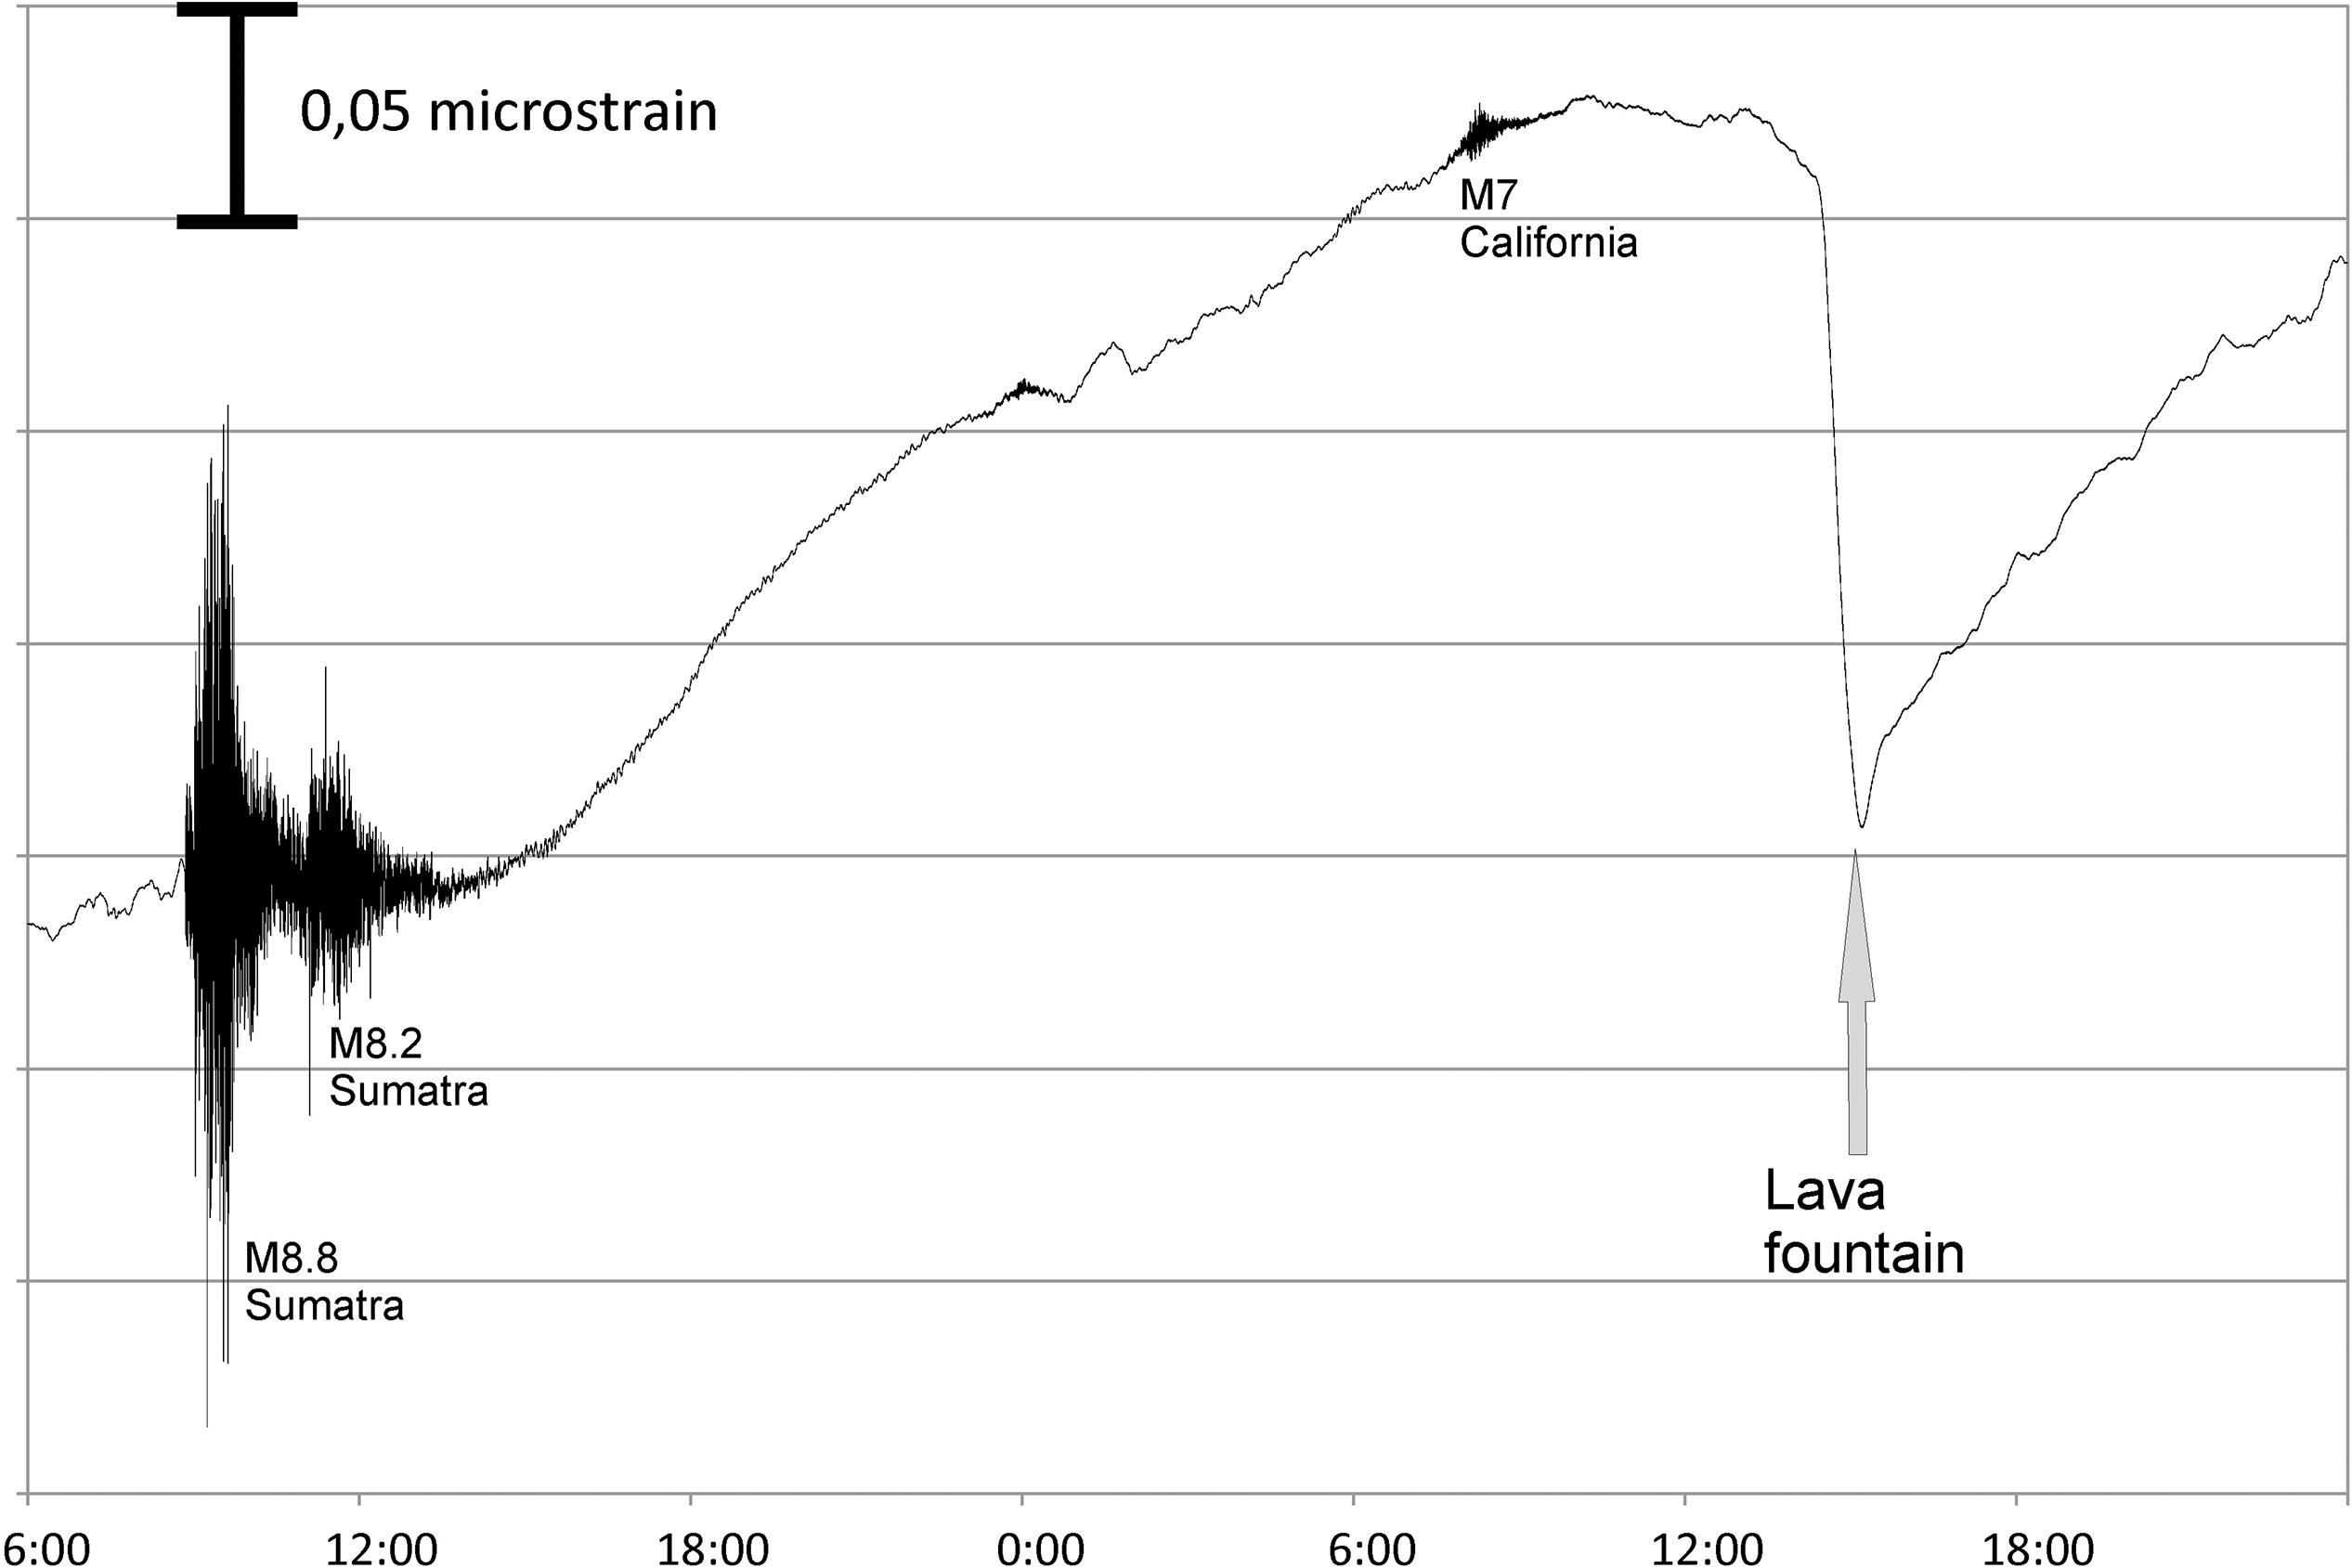
Figure 5. Strain recorded at DRUV from on 11 (6:00) to 12 (24:00) April 2012. The signal records the M8.8 and M8.2 teleseismic events from Sumatra of 11 April, the M7 from California and the lava fountain of 12 April.
FIGURE 6
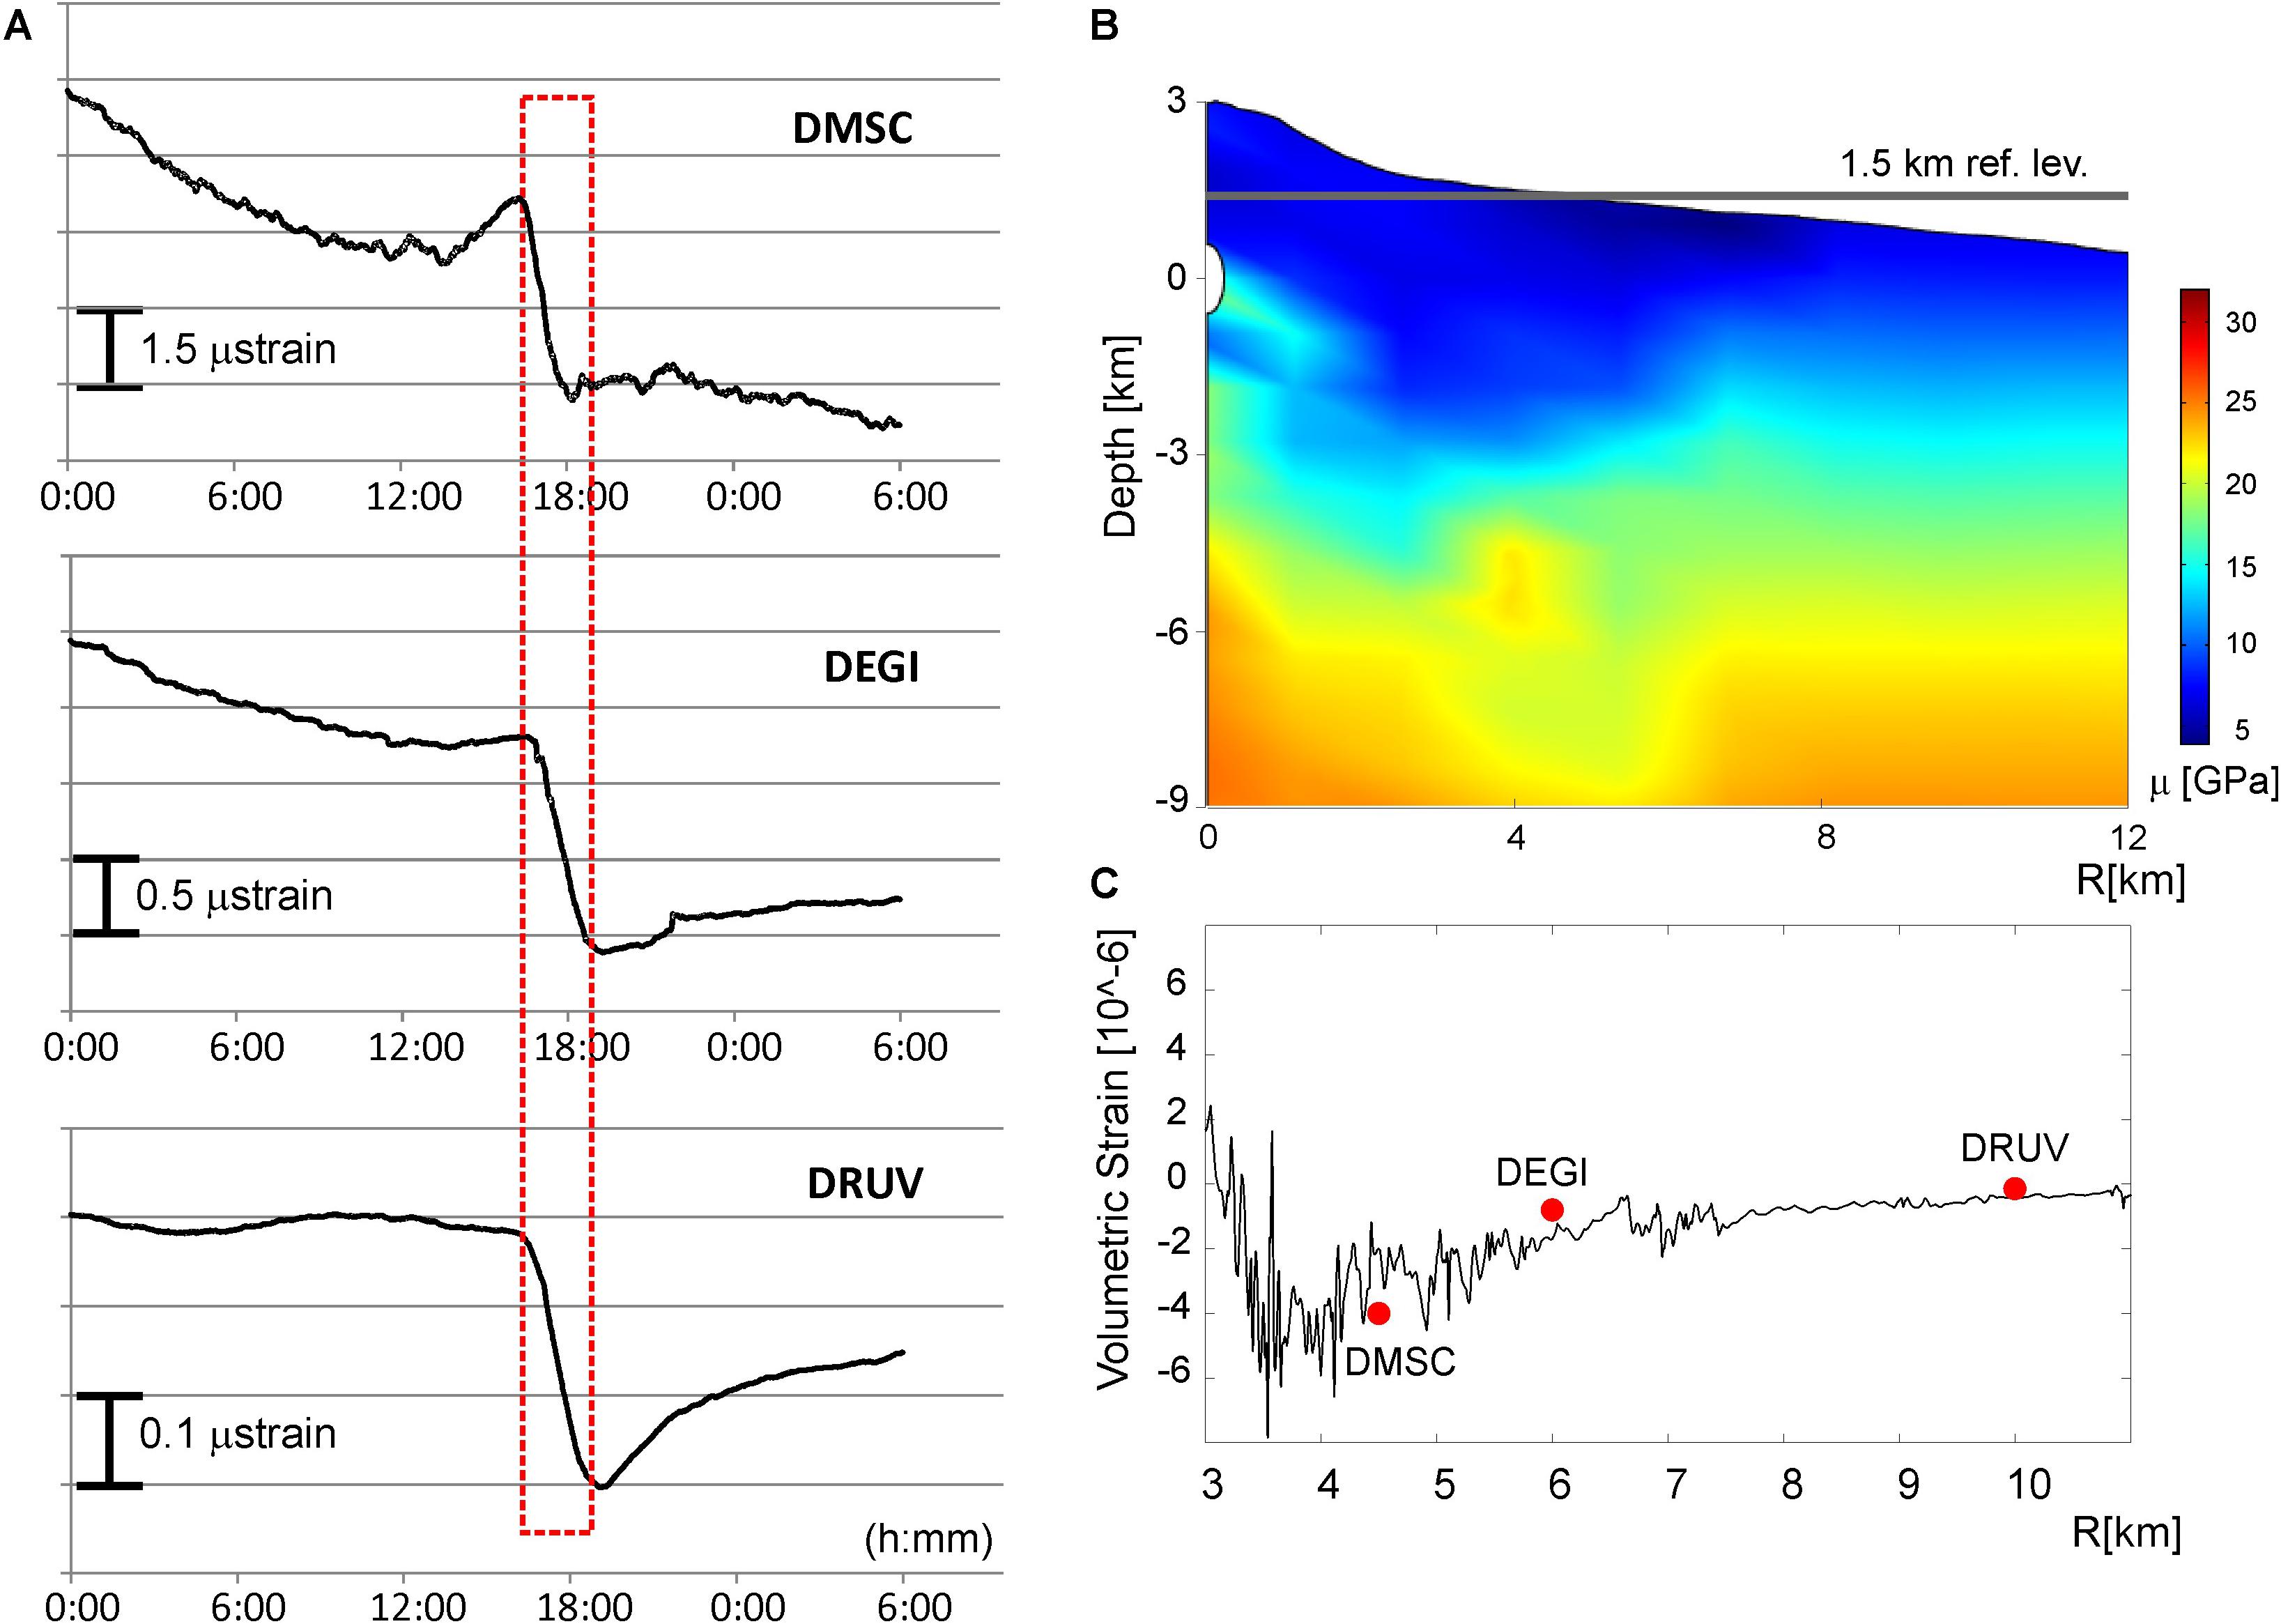
Figure 6. (A) Strain signals recorded at DRUV, DEGI and DMSC borehole dilatometers from 28 (0:00) to 29 (06:00) December 2014. The stations showed a clear negative change (expansion of the surrounding medium associated with the explosion decompression) that starts at 16:15 UT and ends at about 19:05 UT. The PDN station, located close to the central craters, was affected by an ENE-WSW trending eruptive fissure in the summit area (Gambino et al., 2016) that fed two distinct small lava flows. (B) Numerical solution of strain changes obtained from a finite element method (FEM) along a radial direction for an elongated depressurizing source located at about 0 m a.s.l. (see text for description). (C) The observed amplitude strain changes at DRUV, DEGI, and DMSC are also shown (red circles).
Explosive Sequences From VOR Crater
The 44 lava fountains from SEC occurred over a span of 3 years (January 2011 – December 2013) with time intervals of weeks between the events. Between 3 and 5 December 2015 four powerful lava fountains took place at the Voragine, the main and oldest Mt. Etna summit crater. These episodes produced impressive eruptive columns with plume clouds and ash fallout extending to more than 100 km away (Figure 7a). A similar sequence of three events, slightly less powerful than the ones of December 2015, occurred again in 18–21 May 2016. During the sequence of December 2015 the borehole dilatometers recorded very clear strain changes. The first event of 3 December was the most powerful and produced the largest strain changes: DRUV, DEGI and DMSC recorded −0.35, −1.9, and 0.5 micro-strains, respectively (Figure 7b). These were 1.5 – 2 times bigger than the mean changes recorded during the 2011–2013 lava fountains from NSEC. The signals at the two more distant stations from the summit area (DRUV and DEGI) showed negative strain changes (strain down = expansion), indicating an expansion of the surrounding medium, such as the previous signals during the NSEC lava fountains. However the station closest to the summit area (DMSC), which during the last NSEC paroxysm of 03 December 2014 showed a negative strain change, this time recorded positive change indicating a compression of the medium surrounding this station.
FIGURE 7
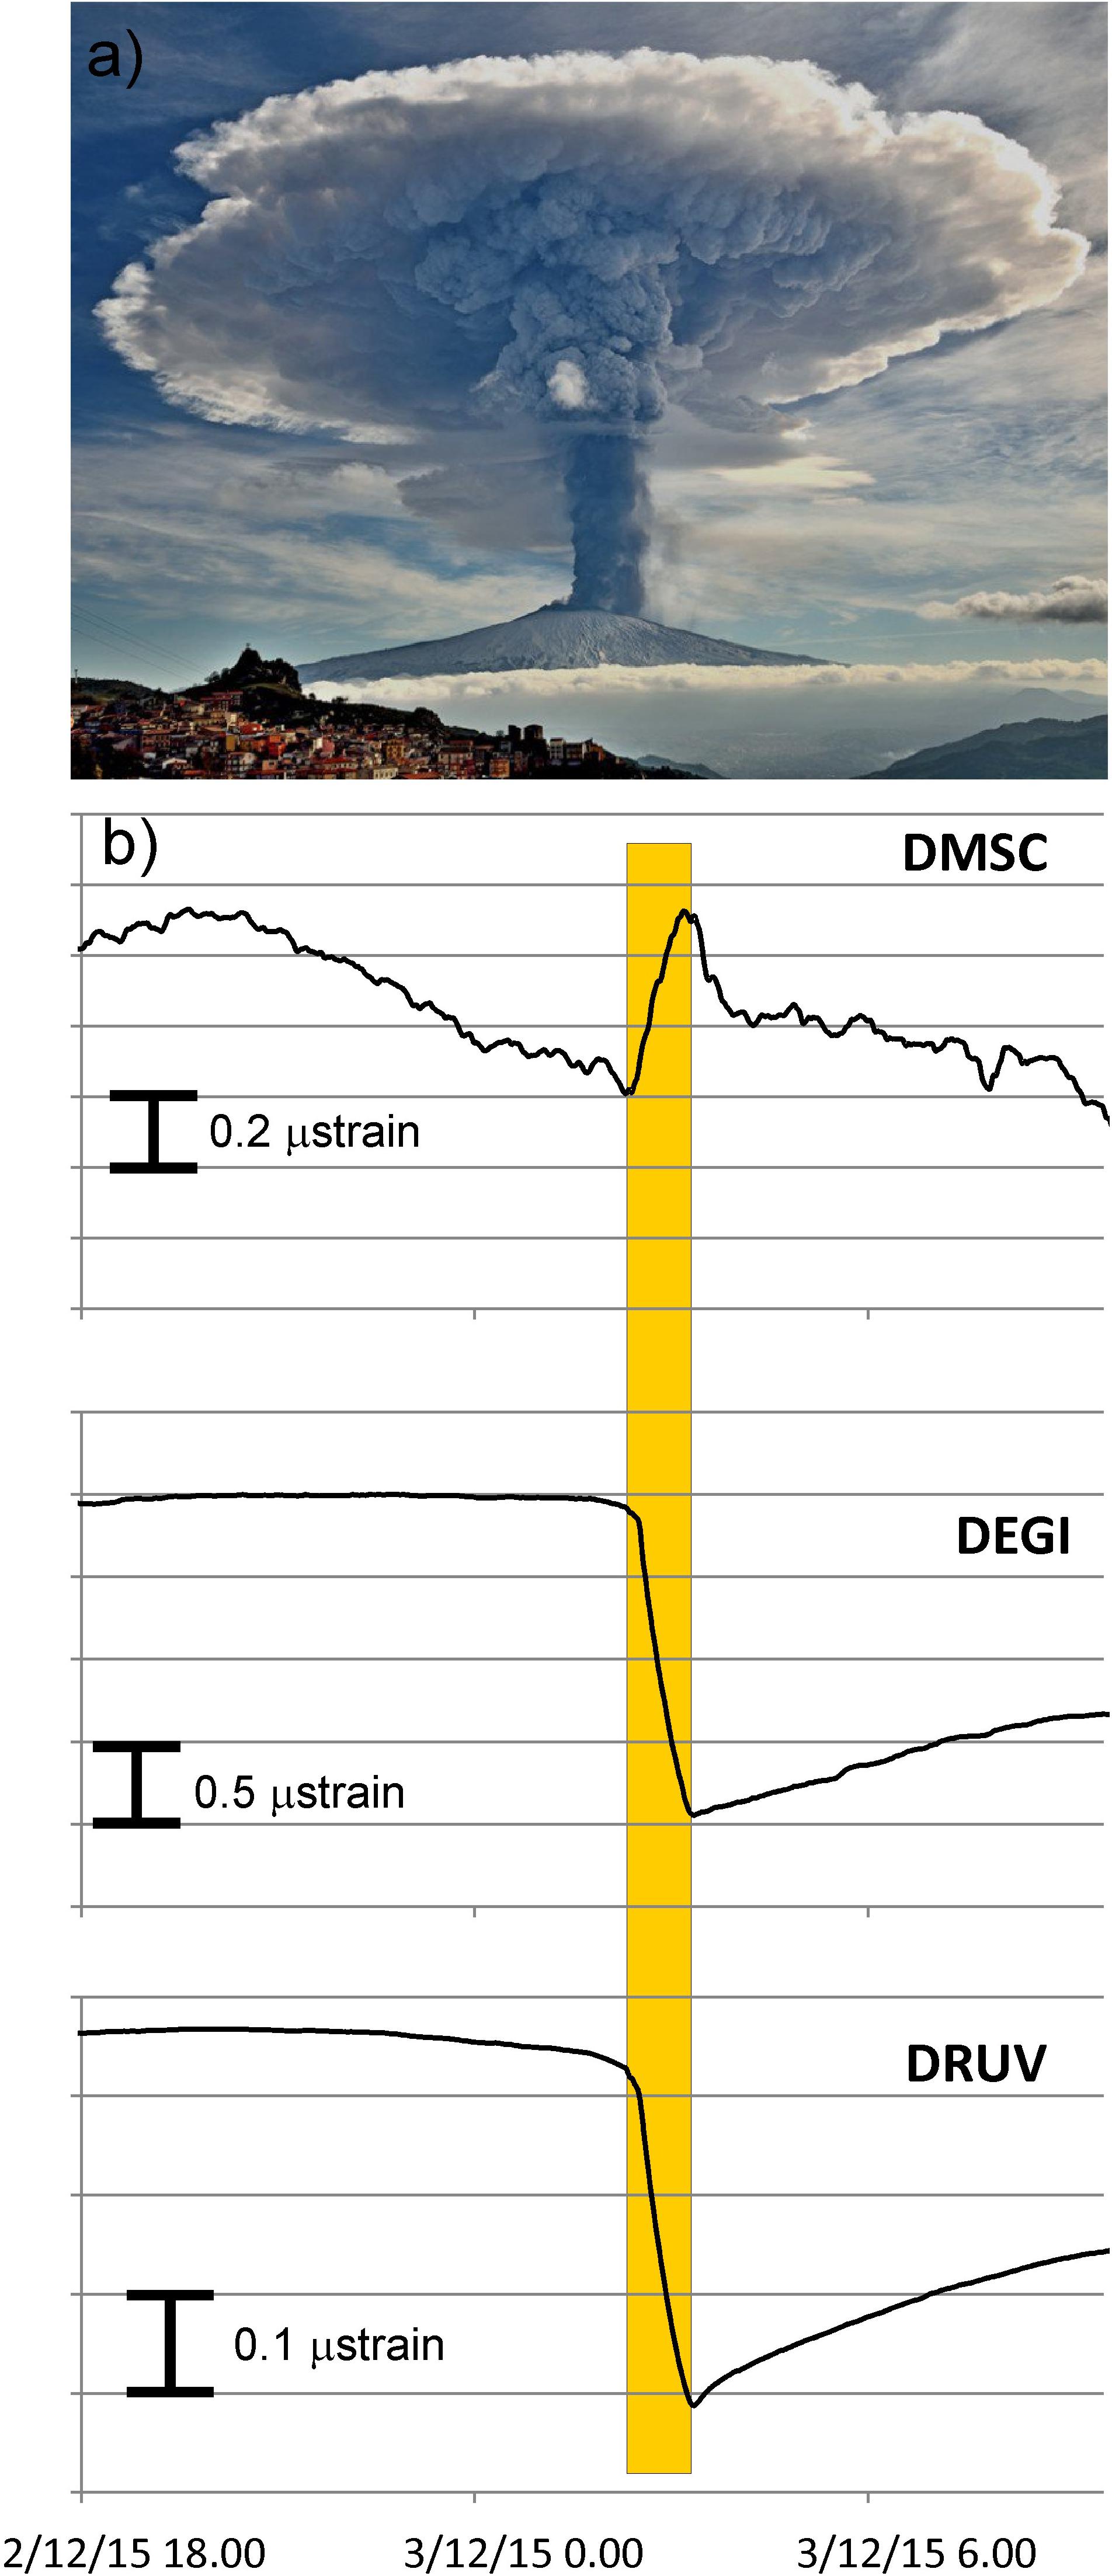
Figure 7. (a) photo of the lava fountain of 4 December 2015 morning (second event of the sequence) from Voragine crater taken from N (photo courtesy of Veronica Testa). (b) Strain signals recorded at DMSC, DEGI, and DRUV. The vertical box marks the 3 December lava fountain activity (first event of the sequence).
The cumulated effect of these four powerful events was also detected by the GPS permanent network that recorded a deflation of the volcano edifice over the first week of December 2015 covering the explosive sequence (Aloisi et al., 2017; Cannata et al., 2018).
From the strain pattern of the 03 December episode Bonaccorso and Calvari (2017) inferred a deflating source located at 3.3 km depth with a negative volume change of 8.5 × 10⁶m3 that is about three times larger than the one produced during the NSEC lava fountains.
The analytical solution for a spherical source in a half-space shows that the volumetric strain field changes sign at where r is the horizontal distance of the recording point from the source and d is the depth of the source. DEGI and DMSC stations record a negative and positive strain change, respectively. The radial distance between the source and the stations is about 6.2 and 4.8 km for DEGI and DMSC, and thus for a source positioned underneath the Voragine crater (as indicated by the inversion of GPS data) its depth should lie between 3.4 and 4.3 km. Considering an average reference surface at an altitude of 1.5 km a.s.l. (namely the horizontal plane at the average altitude of the volcano), the source depth is in the range 1.9–2.8 km b.s.l. This is shallower than the source depth estimated by GPS inversion data in Aloisi et al. (2017) and in Cannata et al. (2018), where the deflation source at a depth of 4.8 – 5.2 km b.s.l. undergoes a volume change of about 3.2 × 10⁶ m3. To determine if topographic effects can account for these discrepancies, we performed numerical simulations. We computed the strain field generated by the source inferred in Aloisi et al. (2017) and Cannata et al. (2018), and verified that its depth is too deep to justify the change in sign between DEGI and DMSC. We computed the normalized strain field by varying the source depth and found that the strain field change in sign is between DEGI and DMSC when the source depth is in the range 1–2 km b.s.l. Moreover, we show that strain field is also perturbed by elastic medium heterogeneity (Figure 8).
FIGURE 8
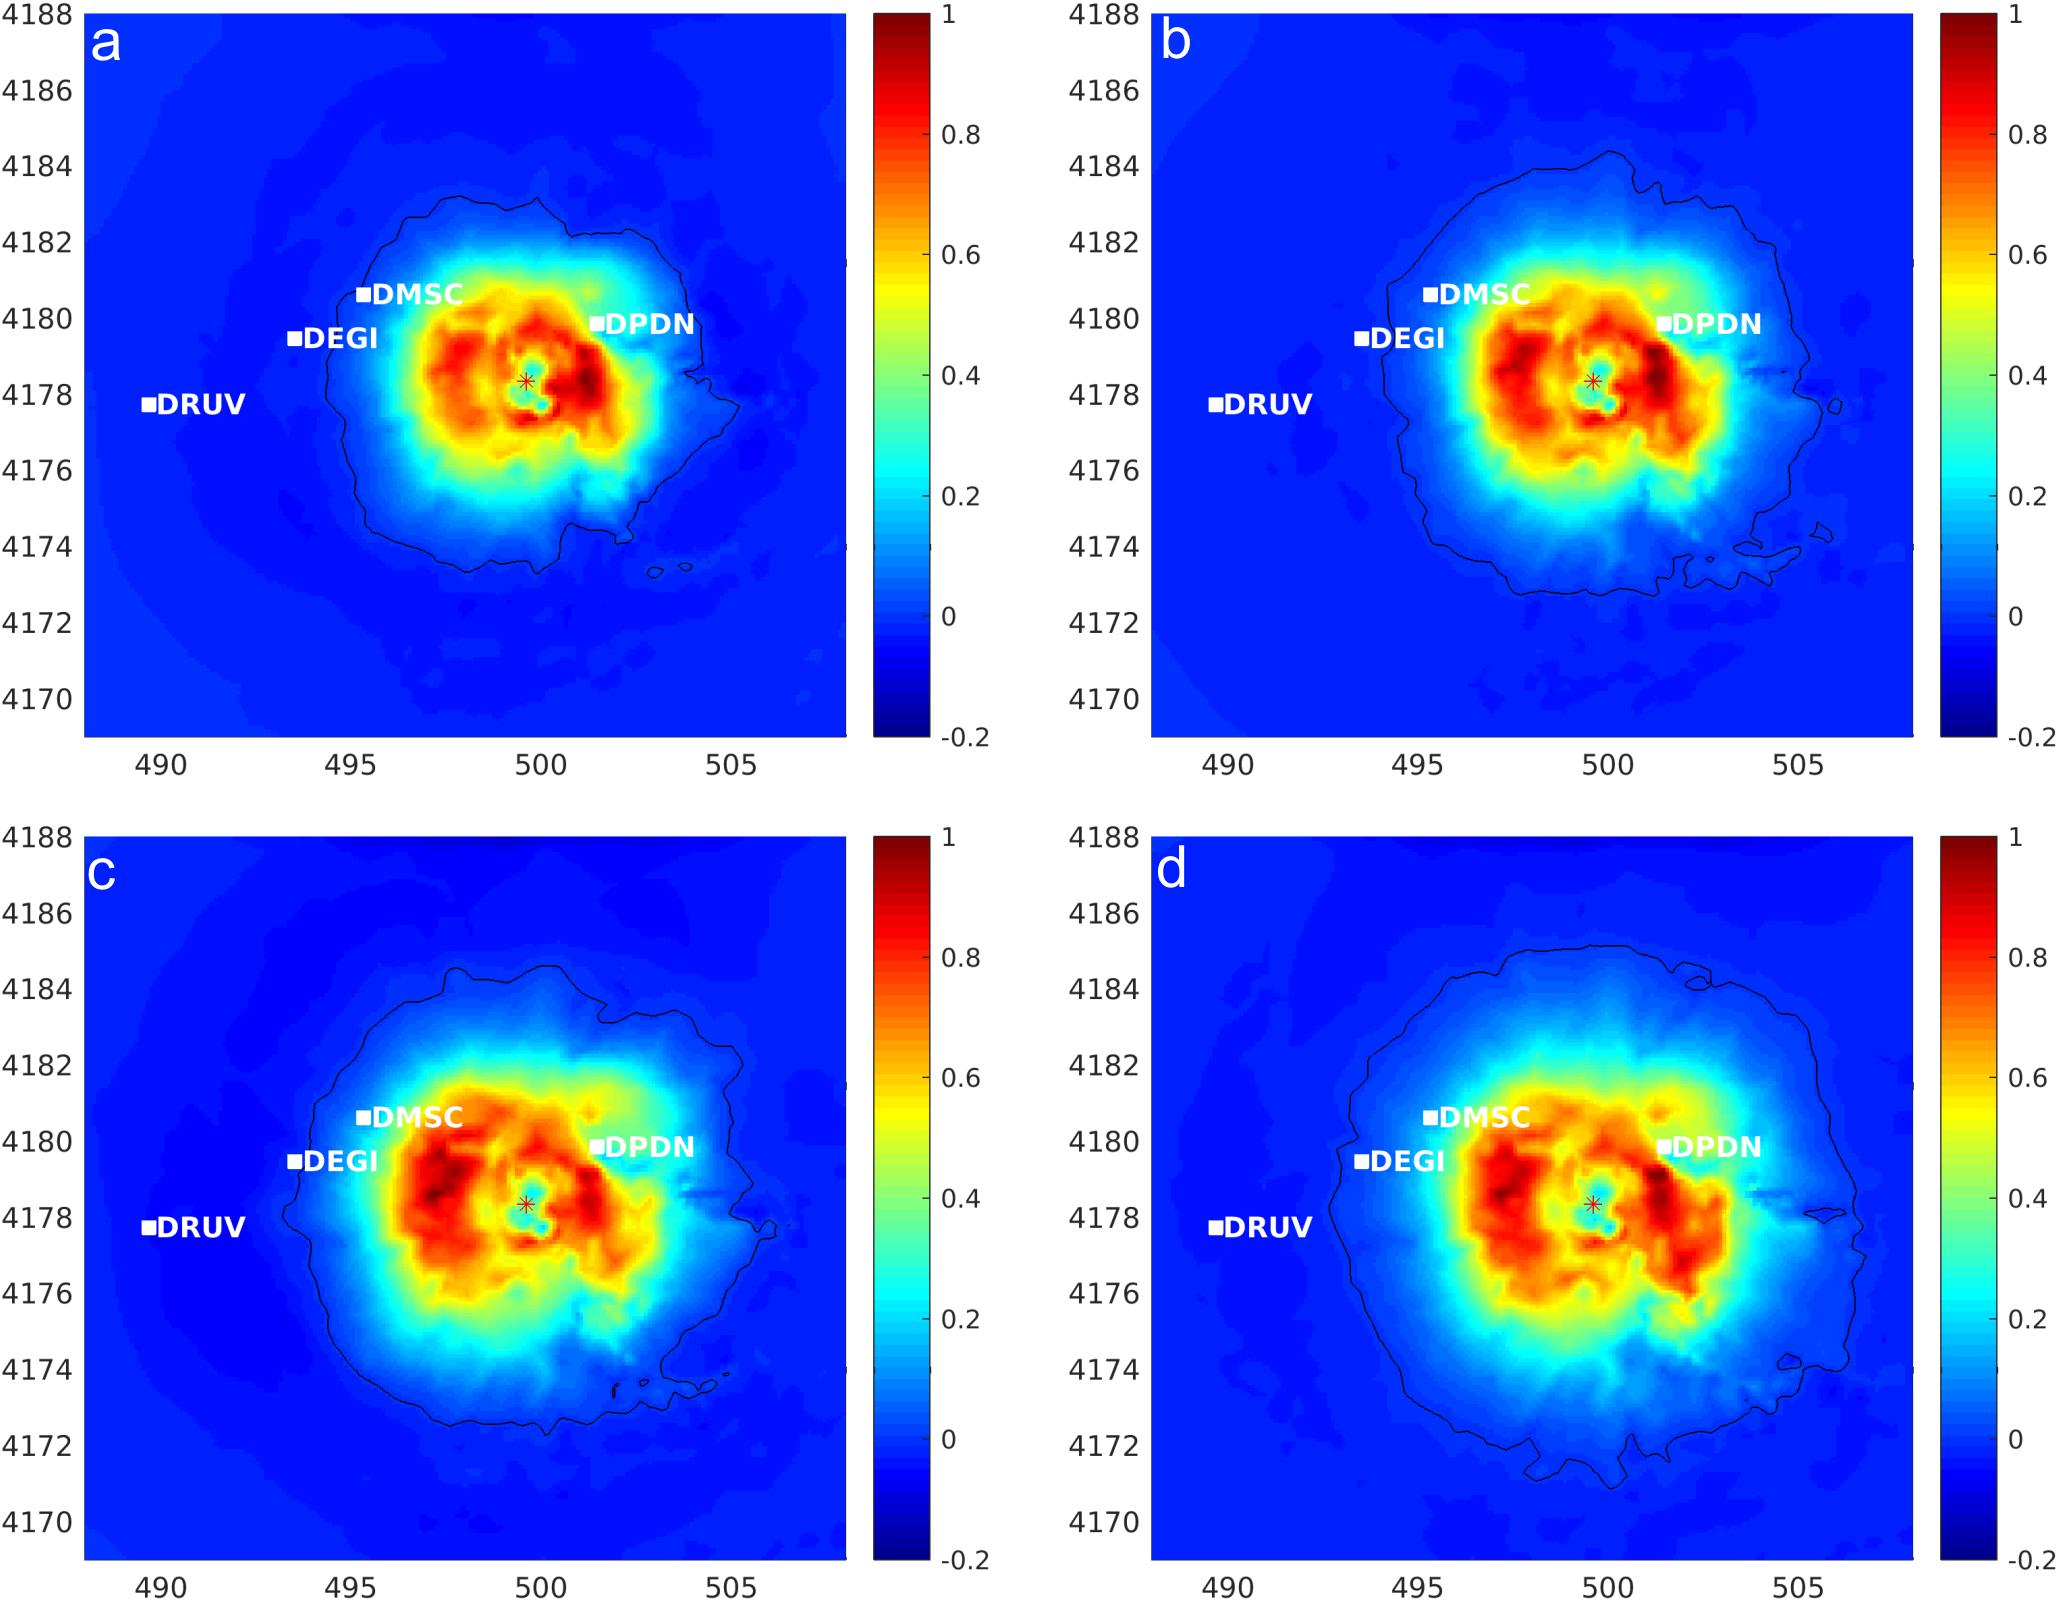
Figure 8. Normalized volumetric strain changes induced by deflation of the source determined from inversion of GPS changes (Aloisi et al., 2017) from 2 to 6 December 2015. The computations are performed using a FE model (Currenti et al., 2010) which considers the Etna volcano topography and heterogeneous (a,c) and homogeneous (b,d) elastic medium properties. Source depth was varied from 1 km (a,b) to 2 km (c,d) b.s.l. to estimate the extension of the volumetric strain pattern. Black contour line refers to the zero level.
The comparison between the solutions using a spherical source (Aloisi et al., 2017) and an ellipsoidal source (Cannata et al., 2018) shows that the source geometry is a minor factor. Based on these considerations we conclude that the deflating source supplying the 2015 VOR activity is deeper than the source active during the NSEC events. The discrepancy in the depth estimations obtained from the interpretation of GPS and strain data may result from the different analyzed time-scales. GPS daily time series record the total deflation of the magmatic source encompassing the overall period from 2 to 6 (Aloisi et al., 2017) and 9 (Cannata et al., 2018) December, whereas strain changes enabled us to follow rapid transient deflations related to the short-term discharge of magma through each fountaining event. Moreover, strain data allows observation of the replenishment of the magmatic source soon after the end of the paroxysm event which rebalances the pressure inside the chamber. During a paroxysm event, it is reasonable to assume that, in addition to the deflating magmatic source, the main conduit also undergoes significant deformation, making the deformation pattern more difficult to interpret. Here, the conclusion, to be investigated further in a specific study, is that superposition of the deeper deflating source and the stretching of the conduit may lead to an average shallower source.
Borehole Strain and Summit Effusive Episodes (2017)
Generally, long-term inter-eruptive inflations and co-eruptive deflations have been observed in different worldwide volcanos from the analysis of various geodetic data such as GPS, DInSAR and leveling. However, due to the limited sensitivity of these geodetic techniques (millimeters to few centimeters), usually they are not able to detect ground deformation caused by short-term small volcanic events such as small lava overflows from the summit craters. In February-April 2017 the eruptive activity of Mt. Etna was characterized by five distinct eruptions (lasting from 2 days to 2 weeks) characterized by Strombolian activity and weak lava flows from the summit crater area. The explosive activity was much less powerful than the previous lava fountains in 2011–2016, but the repeated effusive activity generated lava flows directed toward the southern flank, the main center of tourism, thus raising serious concern. Currenti and Bonaccorso (2019) analyzed the borehole strain-meter data to highlight the detection of cyclic ultra-small volumetric strain changes (∼10–8 – 10–9), preceding and accompanying that 2017 moderate explosive-effusive eruptive activity (Figure 9). Additionally the authors combined strainmeter data analysis with a physical model to obtain critically important information on magma storage conditions in terms of estimation of the magma volume accumulated during the recharging and then emitted during the eruptive phase. This was the first time that nanostrain changes were recorded during an inter-eruptive period, providing a clear indication of recharging and expansion of the shallow magma reservoir before small eruptions.
FIGURE 9
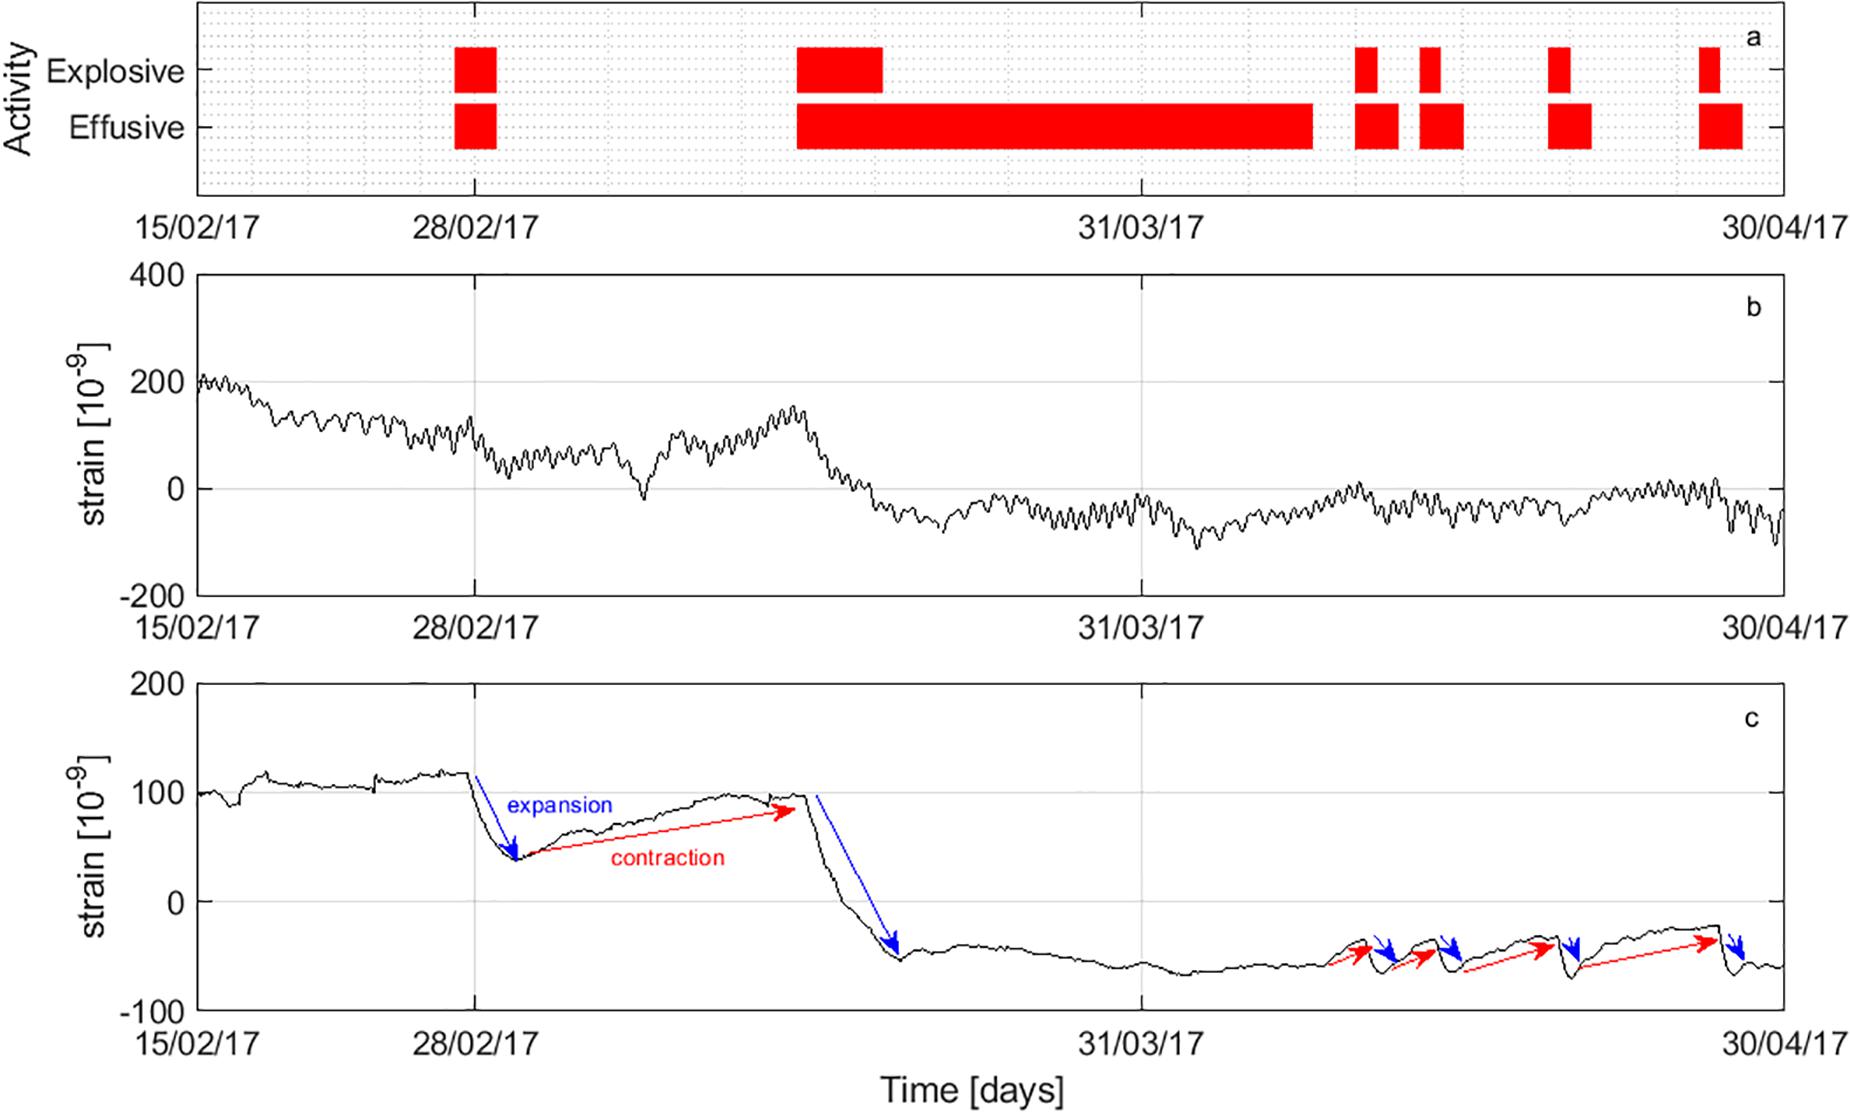
Figure 9. (a) Gant chart of the summit eruptive activity during February – April 2017. (b) Raw strain data at DRUV station from 15 February to 30 April 2017 (a negative strain change corresponds to expansion of the surrounding medium). (c) Residual volumetric strain variations after filtering processing. Co-eruptive events are marked by negative strain changes (blue arrows), small cyclic recharge pulses are clearly recognized in the filtered strain data (red arrows) and precede the onset of the eruptive events.
Borehole Strain and Dike Intrusion and Eruption (24–26 December, 2018)
After several episodes of explosive activity during 2011–2015 and summit eruptive activity with modest overflows during March–April 2017, the volcano suddenly experienced a violent dike penetration during the early morning of 24 December 2018. The intrusion reached the surface at 11:10 UT generating an eruptive fissure at the base of the NSEC characterized by explosive activity and lava flows emission. During the following hours the fissure propagated about 1.5 km to the SE feeding small lava flows directed eastwards inside the natural depression, Valle del Bove, in the upper eastern flank. The eruption finished 2 days later on the evening of 26 December, emitting 1.4 ± 0.5 Mm3 as summit outflows and 0.85 ± 0.3 Mm3 of lateral flows as calculated from satellite spectroradiometer of MODIS and Sentinel-2 (Laiolo et al., 2019). During the early morning of 24 December the dike penetration was accompanied by a seismic swarm initially located beneath the central volcano. The seismicity continued in the following days and also local faults in the SW and SE flanks were activated (De Novellis et al., 2019). The near real time stations of the permanent GPS detected fast and significant changes in the short interval from 09:50 UT to the eruptive fissure opening (11:10 UT). The cumulated displacements of several centimeters were used to infer a shallow vertical dike representing the upper ∼2 km of the intrusion that produced the marked changes at the permanent stations (Aloisi and The INGV-OE, 2019). The overall deformation pattern as seen from satellite DInSAR data suggest the action of a larger intrusion. By using data from Sentinel-1 acquired in the time interval 22–28 December Bonforte et al. (2019) found a main dike vertically elongated 3.7 km and rising to near sea level. With the same data De Novellis et al. (2019) suggest the presence of two dikes, a shallower one and a deeper one. The limit of the DInSAR data is the large window of the measure time interval (near a week) for calculating the ground deformation. During the days following the 24 December intrusion, in response to the tensile action, the entire portion of the East flank started to slide toward E (Aloisi and The INGV-OE, 2019), resulting in local seismicity. Therefore, the DInSAR measured the sum of different effects (intrusion and flank sliding), and this biases the modeling of the source of the December 24 intrusion. An ongoing study is focused on modeling the real time data (continuous GPS, tilt, strain) to determine more accurately the source that propagated during the ∼2 h and 40 min of intrusion before the eruption onset and to better infer the shape and mechanism of the dike rising during the morning of 24 December. Here we simply highlight the main advantages provided by the borehole dilatometer data.
Strain variations started between 8:20 and 8:30 (Figure 10). The effect of the intrusion propagation, which precedes the beginning of the eruptive activity by about 2 h and 40 min, is highlighted in an extremely clear manner by the signals of the borehole dilatometers. Thanks to the high sensitivity of strain signals, significant variations are detected 1 h and 30 min before those recorded at GPS stations, thus providing a significantly earlier warning time than can be provided by displacement measurements. All the signals have a first phase of marked variation up to about 11:10, when there was eruptive activity at the craters and the opening of the eruptive fissure. The strain variations continue in a second phase, albeit in a very attenuated way, until 16:30.
FIGURE 10
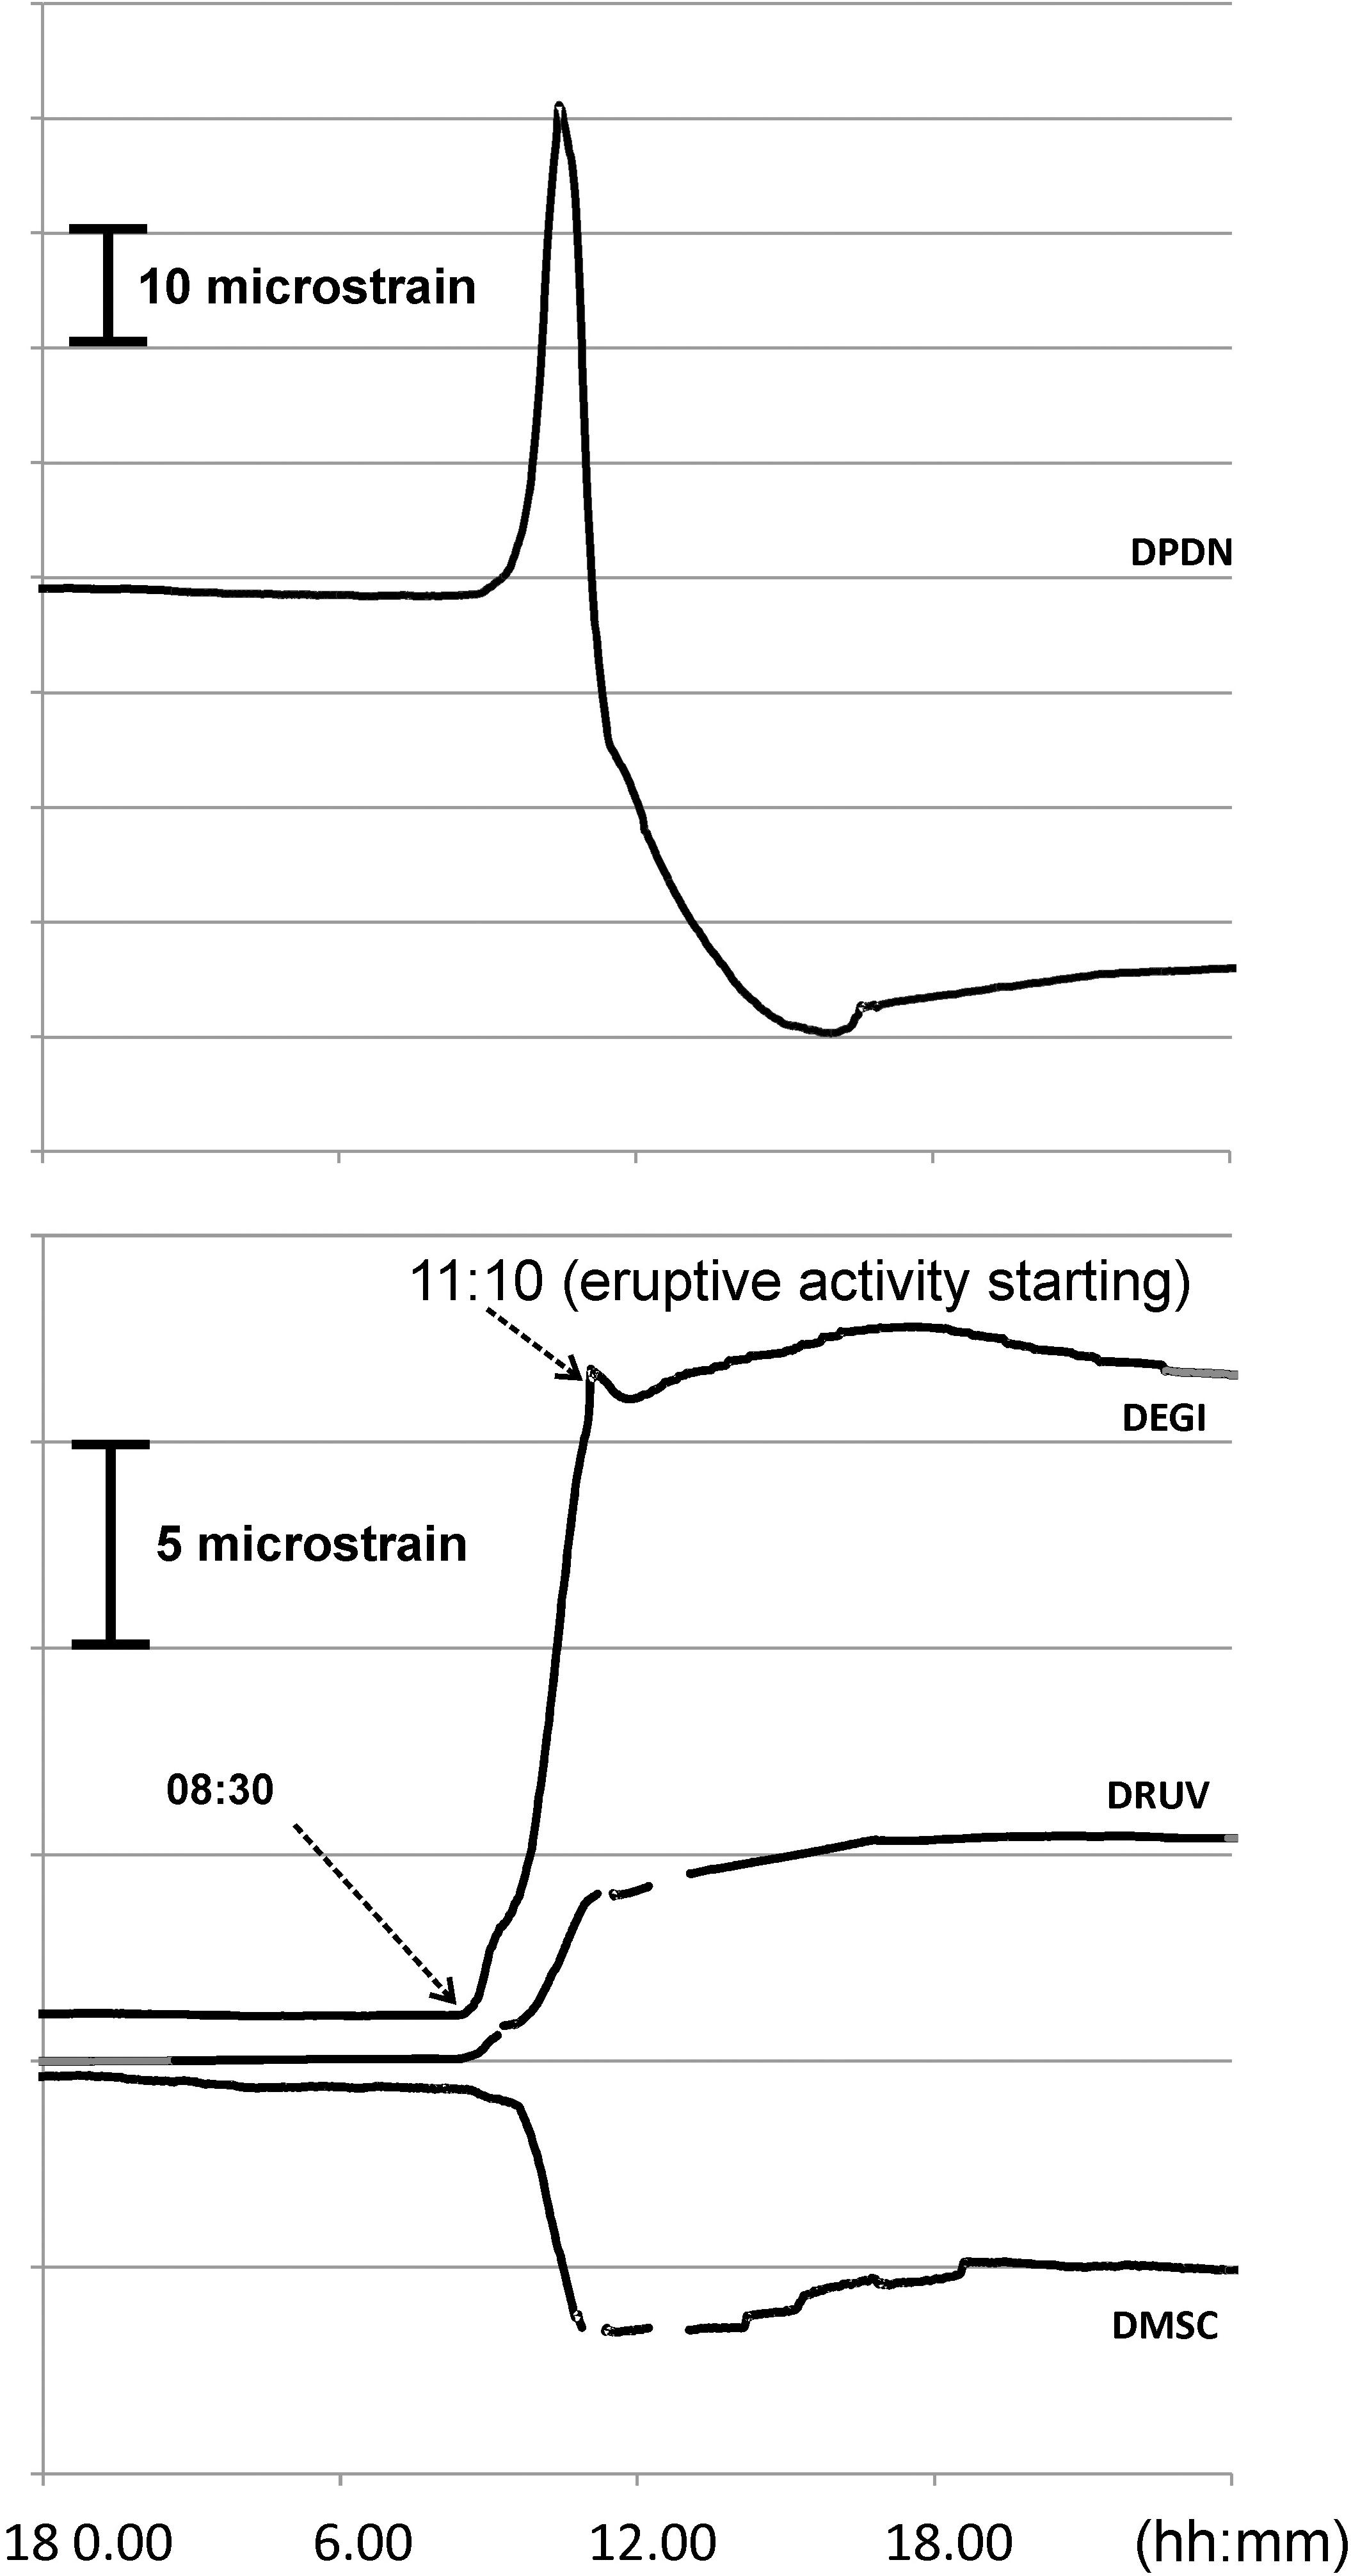
Figure 10. Etna 24 December 2018 dike intrusion. Clear strain changes start at 8:30. The visible eruptive activity started in the summit area at 11:10.
The recorded variations have large amplitudes, being 10–15 times greater than the changes recorded in DRUV and DEGI during the multiple 2011–2013 lava fountains. Furthermore, DRUV and DEGI show a continuous positive variation of strain signals (compression of the medium surrounding the instrument) which is the opposite sign to that recorded during all the 2011–2016 lava fountains. This aspect indicates that from the beginning of this phenomenon a different source, more powerful than lava fountains, is acting (i.e., the tensile action of the dike) rather than the one which fed the previous lava fountains (i.e., the emptying of a shallow reservoir).
In summary, in the case of 2018 eruption the aspects indicated above support two important considerations of extreme utility: ⇒ Signals of borehole dilatometers record marked variations in the 2 h and 40 min prior to eruptive activity. This aspect is a crucial contribution to the definition of the early warning.
⇒ The strong positive variations (compression) recorded up to 10 km away from the crater summit area (∼5–10 microstrain recorded at DEGI and DRUV, 6 and 10 km from the craters) require the a powerful tensile action which immediately allows the interpretation of an intrusive dike source.
An ongoing separate study is employing the integration of the real time data (continuous GPS, tilt, strain) to provide the most robust constraints on the source that propagated during the ∼3 h of intrusion before the eruption start and to infer characteristics of the dike rising during the morning of 24 December.
Discussion
The experience from the Etna dilatometer network, supported by other deformation data collected in the last decade during which there has been a variety of volcanic activity, has shown that the borehole strain signals are a powerful tool to reveal significant variations (not detectable by displacement measuring techniques) with high sensitivity in the short term (from hours to months) that usually accompany rapid eruptive processes such as intrusions, explosive and effusive activity. In the case of the feeding dike that deforms the entire volcanic edifice and leads to dangerous flank eruption, such as the intrusion of the eruption of 24–26 December 2018, the role of dilatometers was remarkable for the recognition and interpretation of the early-warning of the initial phase of the intrusion propagation. On 24 December 2018 the dilatometer signals showed significant variations starting at 8:20 UT, well in advance of other geophysical signals. The first earthquake heralding the seismic swarm started at around 8:30, the continuous GPS showed significant changes starting at 09:50. The strain changes recorded from 8:30 indicated clearly that an intrusion was in progress. This was a result of the high sensitivity (order 10–10) and dynamic range of the strainmeter, which provided early and very clear variations (of the order 10–5, 50–100 times greater than those usually accumulated during a fountain of lava), together with the fact that the variation of the signal of the more distant stations (DRUV and DEGI) had a positive change (compression due to a tensile action), while for the lava fountains the sign of the much smaller variation was negative (decompression by emptying of shallow storage).
In the case of explosive activity, such as the lava fountain episodes, the high sensitivity of the borehole dilatometers resulted in recorded changes that cannot be observed by other geodetic techniques, usually of lesser sensitivity, such as GPS or InSar. This has made it possible to enhance two extremely important points for monitoring and surveillance activities. The first point concerned the excellent detection and timing of the beginning and end of lava fountains, regardless of the weather conditions that could obscure detection by the cams network. The tremor can anticipate the beginning of a fountain by a few minutes or several hours, but if there is no visibility for the cam, due to bad weather conditions, we cannot be sure if the lava fountain activity started and, in case, when. Moreover, the seismic tremor could increase also for high strombolian activity even without the transition to lava fountain activity. For the 2011–2016 lava fountains, the recorded strain signal not once failed to provide precise timing of their occurrence. The pattern of the strain signal, as shown in the example of Figure 2, has always been repeated for all the fountains. This point is fundamental since it contributes to the correct alert that INGV sends to the aviation authorities from its ‘permanent’ (24/7) surveillance room. The second point is that the accurate strain changes allowed us to model the position and volume change of the deflating source feeding the lava fountains. The data provided constraints on the amount of total volume (pyroclastics plus lava flows) emitted by the fountain directly during its eruptive course. The negative variation of the strain during the lava fountains is related to the amount of total magma volume emptied during the paroxysmal activity that in turn is related to the volume change of the depressurizing storage. For the lava fountains, the first estimate of the total average volumes of the NSEC fountains was obtained through the strain data inferring a value of 2.5 × 10⁶ m3 (Bonaccorso et al., 2013b). This result was subsequently verified by other methods; in particular, repeated GPS surveys carried out both from a distance and on the NSEC cone itself, comparison photographs, and the two aerophotogrammetric surveys confirmed that the average total DRE (density rock equivalent) volume of magma emitted during each of the 2011–2013 NSEC lava fountains, including both pyroclastic products and lava flows, was 2.5 × 10⁶ m3 per event (De Beni et al., 2015). These amounts of emitted volumes during the lava fountains period demonstrate that this kind of activity efficiently drained and equilibrated the incoming magma which, over the last 40 years has been stable at 0.8 – 0.9 m3/s (Harris et al., 2011; Bonaccorso and Calvari, 2013). The mean average output rate produced in 2011–2013 by the 44 NSEC lava fountains was about 1 m3/s confirming a near perfect balance between expected and erupted magma volumes at Etna volcano in that period. In other words, this means that in 2011–2013 the tens of lava fountains were a process that ensured a complete release of the incoming magma without allowing its possible large and dangerous accumulation inside the volcano, and therefore this excludes the possibility that this exceptional explosive activity could be a precursor of an imminent large flank eruption.
A further critical point was the contribution of the strain data to the understanding of the evolution of violent explosive sequences. On 3–5 December 2015 the explosive activity, composed of four main lava fountains episodes, caused enormous disruption to urban areas and also forced the closure of the international airport of Catania. The recorded strain showed constant DRUV/DEGI strain amplitude ratio over time for the sequence of the four fountains, this aspect indicating that the source position during the four episodes was stable (Bonaccorso and Calvari, 2017). However, the main concerns were both the violence of the explosive activity manifested since the first episode of December 3 and, after the second and third episodes of December 4, above all the short time intervals that showed the sequence between one episode and another. Here, the crucial issue was to understand what evolution would have had the explosive sequence and when it would have ended. This aspect was not at all addressed by other types of data, and for example the seismic tremor in the second and third episodes, although the sequence intensity was decreasing and as volumes emitted, showed an increase in the magnitude of the tremor (Figure 11A). This critical question was addressed by the gradual exponential attenuation of the strain amplitude changes (Figures 7, 11B) that indicated progressively lower volumes involved in the eruptive sequence and therefore that the sequence was becoming exhausted.
FIGURE 11
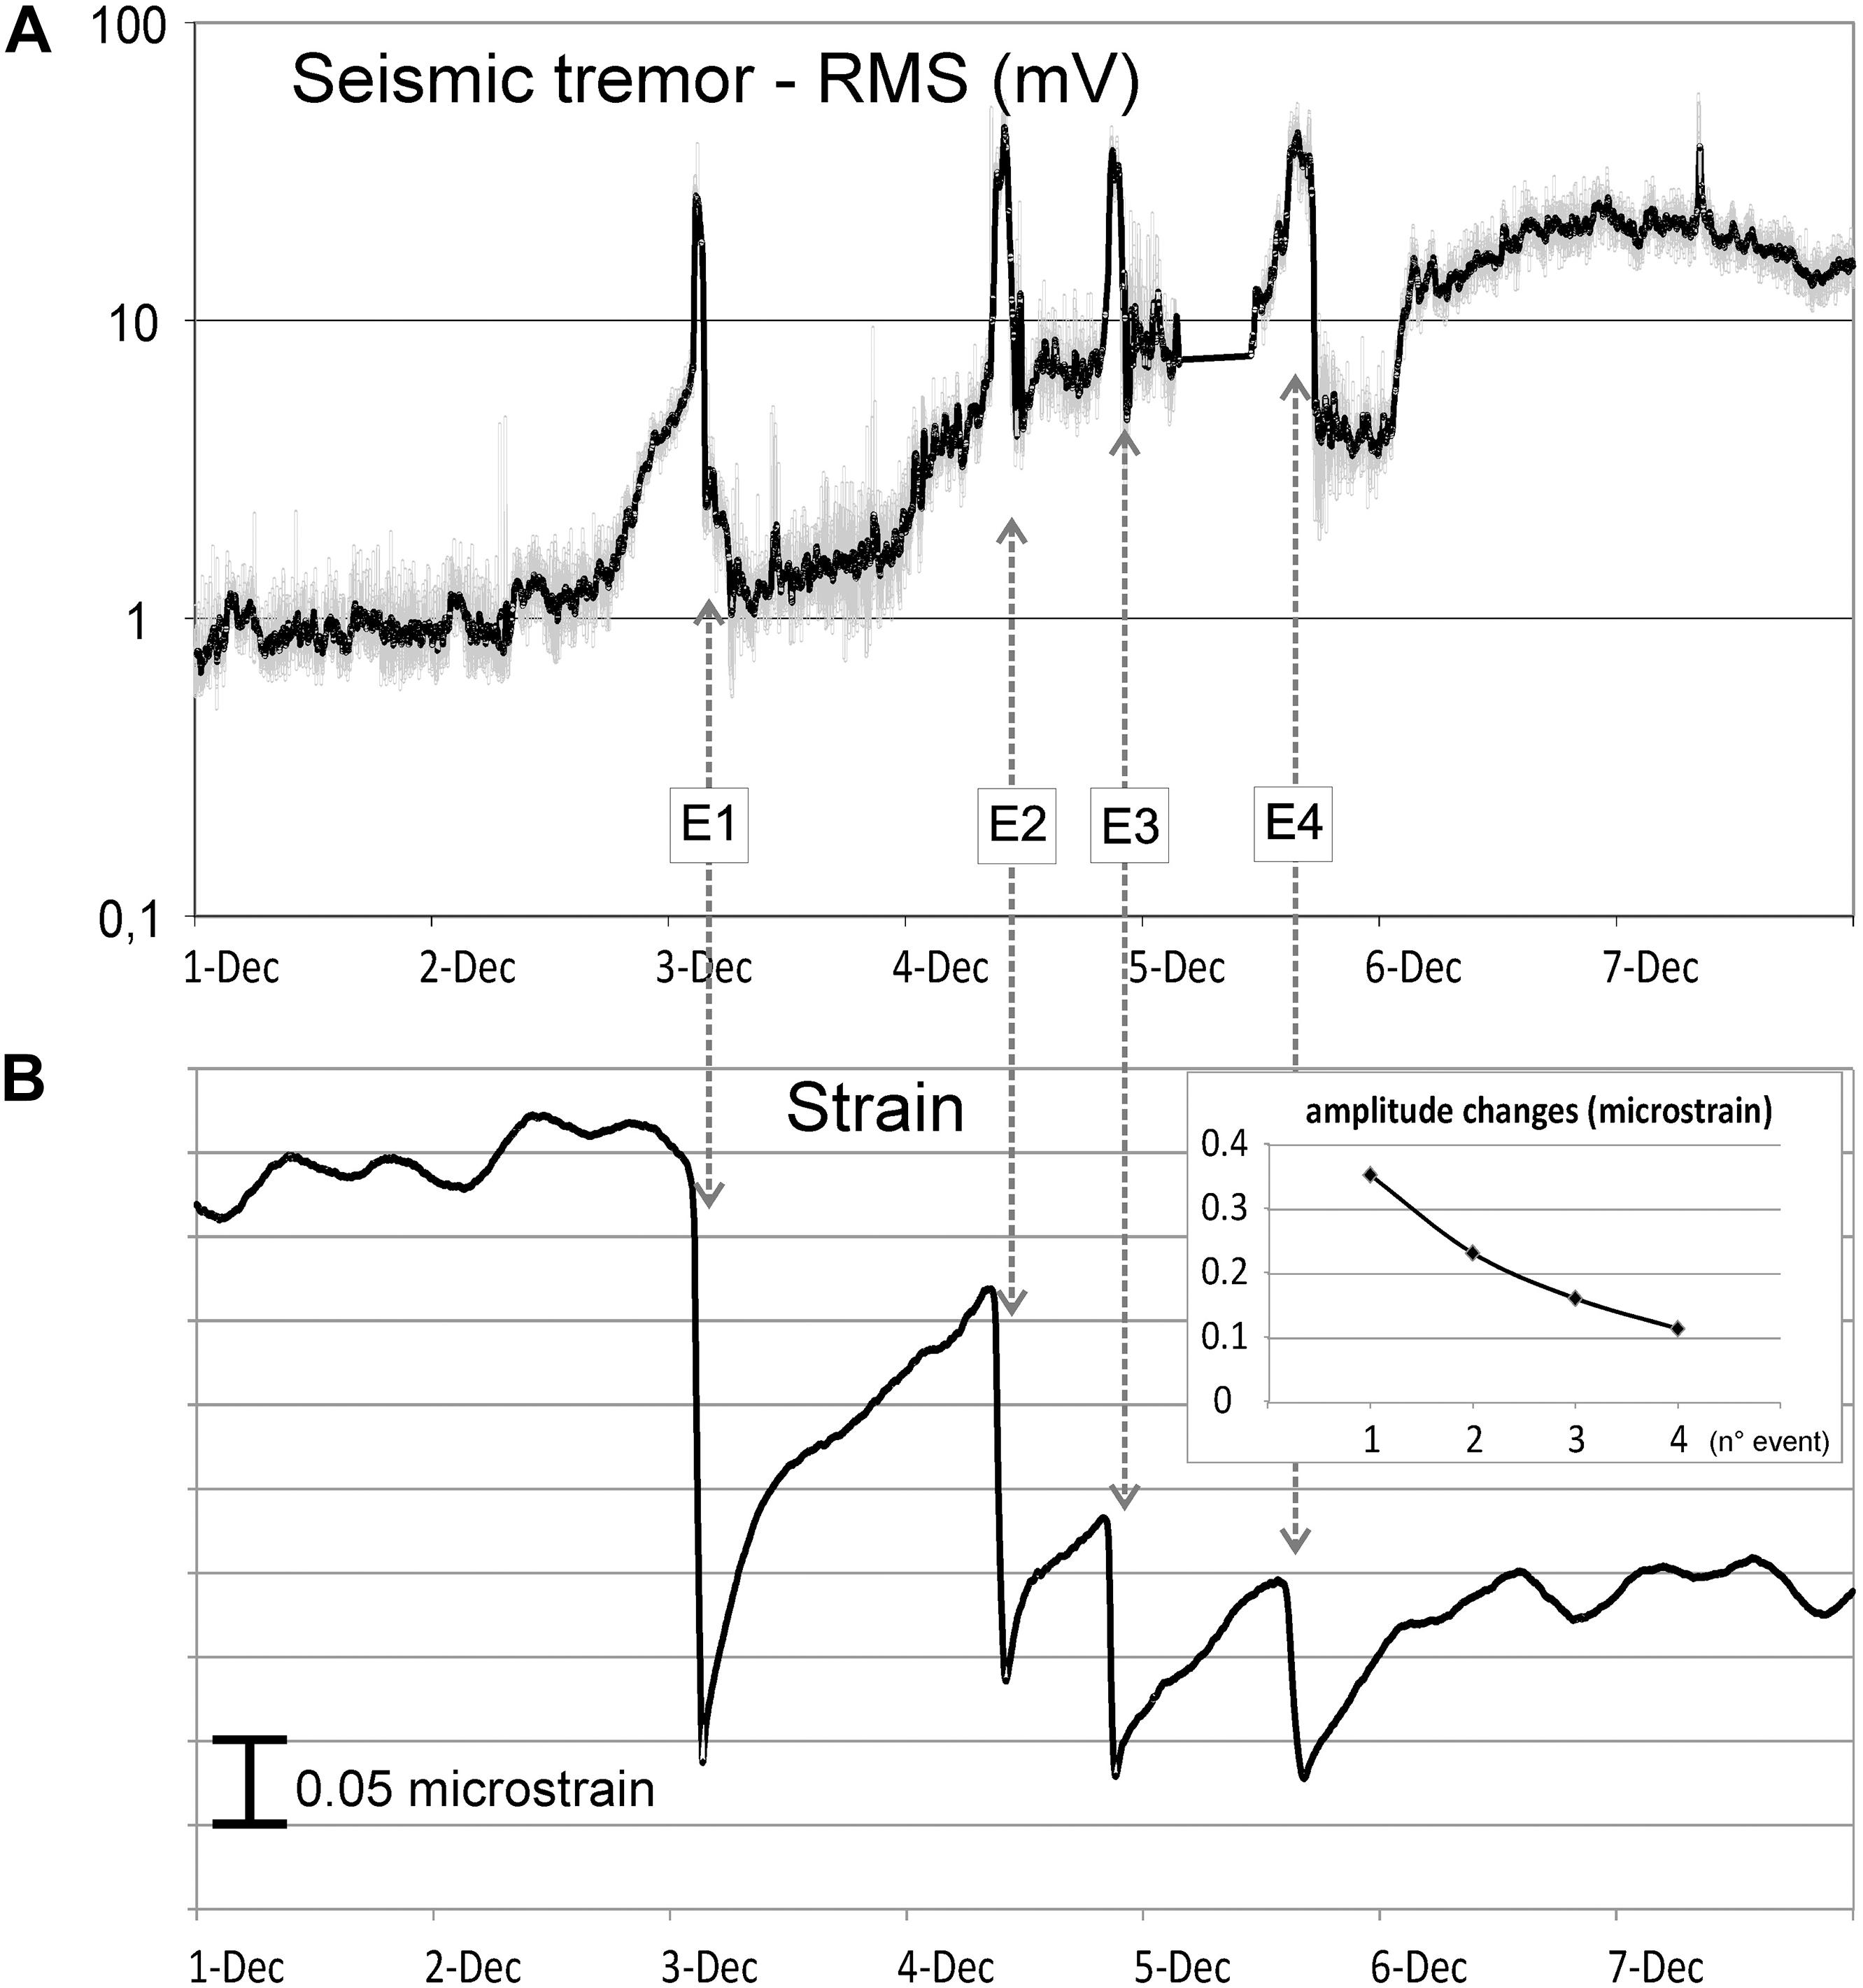
Figure 11. (A) RMS of the seismic signal recorded at the ESLN in the mean southern flank from 1 to 8 December 2015 (after Aloisi et al., 2017). (B) Strain recorded at DRUV dilatometer in the same time interval. The four lava fountain events are indicated by the vertical arrows. In the inset the pattern of the amplitude changes cumulated during each events is reported.
In addition to the variations associated with rapid and violent magma ascents such as the explosive activity of lava fountains or that associated with dike-intrusion, the strain data also provide information on recharging and discharging phases related to modest and weak effusive activity from the summit craters such as for the case of the 2017 events. The strain showed a clear indication of the expansion of the shallow magma reservoir, which is replenished with new magma from depth. In this case, the DRUV data offered a unique insight into the shallow magma storage condition, which until now has not been possible with other techniques. In principle, if interpreted in near-real time, the high-precision strain changes may set some constraints on the rate and intensity of the inter-eruptive inflation and, hence, may assist in estimating the magma volume that could be erupted; this would be extremely helpful in hazard mitigation, especially in a situation of frequent eruptive activity in areas visited by numerous tourists. In this specific case the result was mainly possible thanks to the extremely high precision of DRUV. This aspect highlights that it is very important to be able to obtain installations that can exploit the most of the enormous potential of dilatometers. In the case of DRUV it was installed at about 180 m and, importantly, in highly massive basaltic rocks.
Here we have been able to take advantage of a unique opportunity to use borehole strain data to examine different types of eruptions (lava fountains, explosive sequences, moderate explosive-effusive activity, violent dike) and for each to provide specific useful insights. A summary scheme of the different case studies and the advantages obtained by the high precision borehole strain data is shown in Table 1.
TABLE 1
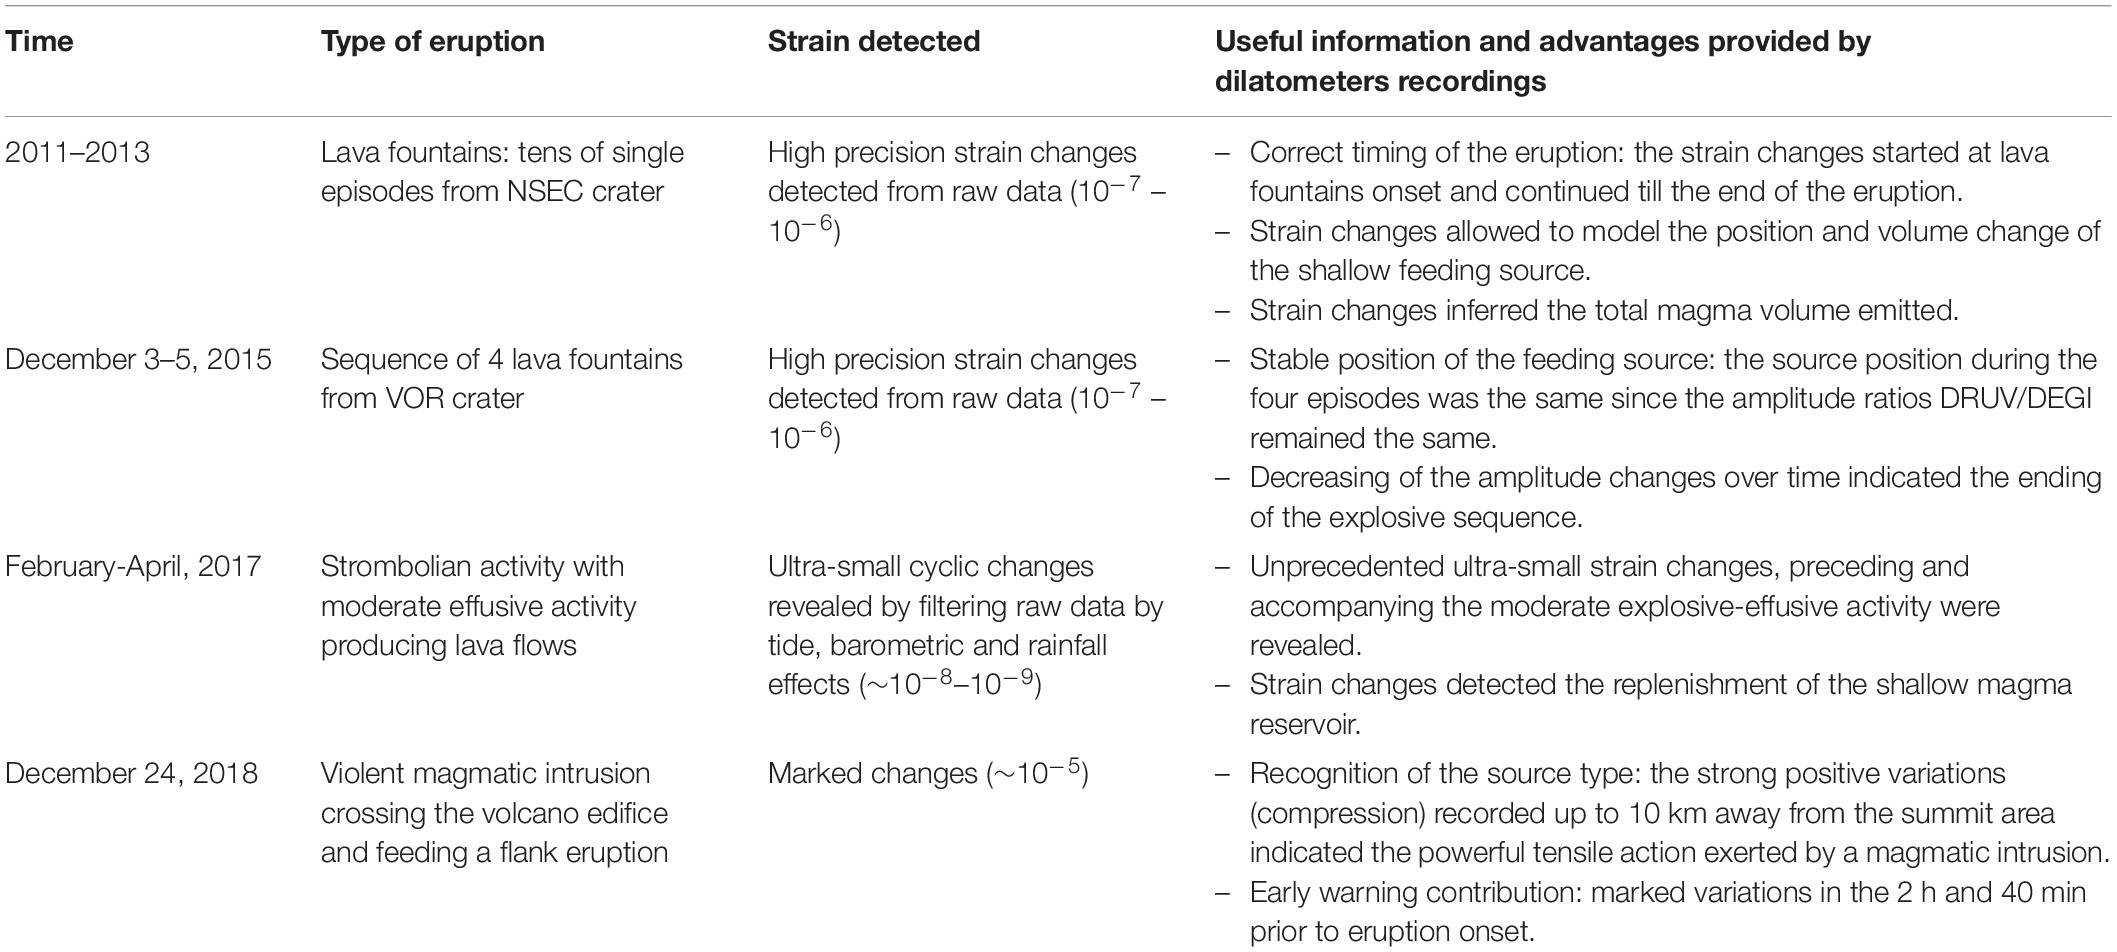
Table 1. Main useful information and advantages provided by high precision borehole dilatometer recordings during different types of eruptions.
Conclusion
The network composed of the borehole dilatometers stations allowed us to study different types of eruptive activity during the lively and diversified activity occurred at Etna during recent years. This has added new valuable information useful for understanding the eruptive phenomena. In particular, the results were achieved thanks to the high sensitivity obtained in some installations, especially DRUV. In our experience in the volcanic environment, at the base of such excellent performance are: the importance of deep installations (about 180 m of depth); very massive rock hosting the sensor; and robust final calibrations in situ verified with different independent methods.
For some eruptive phenomena such as lava fountains from the NSEC (2011–2014) and the modest overflow of 2017 the small strain variations (10–8 – 10–9) detected by the borehole dilatometers were the only deformation signals that provided a clear observation of variations in the recorded signals and therefore allowed modeling of the source. The existence of these unique signals before the eruptive phases therefore contributes to assess the hazard. In cases of explosive sequences, such as that of 3–5 December 2015, it has proved to be a fundamental tool for tracking the decrease and the equilibrium return of the volcanic state. During the violent dike-intrusion of 24 December 2018 the marked strain signals gave two valuable pieces of information that contribute to a much improved capability for early warning: (i) significant changes ∼2 h:40 m before the start of the activity and before the changes detected by GPS, and (ii) compressive strain at the distal stations which indicated a clear tensile mechanism due to the intrusive action. All these elements provide a powerful contribution of great interest and repercussion for the surveillance implications on an active volcano, and therefore represent useful tools both for the study of processes and for surveillance. The study here proposed, besides containing new results, concerns different types of eruptions (lava fountains, explosive sequences, moderate explosive-effusive activity, violent dike intrusion), and therefore has broad implications also for other active volcanoes.
Data Availability Statement
The datasets generated for this study are available on request to the corresponding author.
Author Contributions
All authors have contributed to install and implement the network, to calibrate the instrumentation, and to analyze the data. AB and GC conceived and designed the study. AB coordinated and shared the writing of the manuscript. GC performed the numerical modeling. AB, GC, and AL contributed in writing the manuscript. All authors contributed to the discussion of the results.
Funding
The Etna borehole strainmeter network benefited by the financial support of the Italian FIRB project “Development of new technologies for the protection and defense of the territory from natural hazards” (acronym FUMO) and PON project “Development of research centers for the study of volcanic areas at high risk and their geothermal potential in the context of Mediterranean geological and environmental dynamic” (acronym VULCAMED).
Conflict of Interest
The authors declare that the research was conducted in the absence of any commercial or financial relationships that could be construed as a potential conflict of interest.
Acknowledgments
We sincerely thank colleagues M. Acierno and B. Schleigh of the Carnegie Institution of Washington—Department Terrestrial Magnetism who implemented the instrumentation and all support components, and contributed significantly to the instrumental setup and installations. We would like to thank O. Kamigaichi (Japan Meteorological Agency) who gave us the Fortran code for the calculation of the theoretical strain from teleseismic wave. We would also like to thank the two reviewers, the Associate Editor JV, and the Editor in Chief V. Acocella for their constructive comments, which helped us to improve the manuscript. The data used in this paper are from the Istituto Nazionale di Geofisica e Vulcanologia (INGV) monitoring system and are subject to its data policy. Contact the corresponding author about access to the data.
References
Agnew, D. C. (1996). SPTL: Some Programs for Ocean-Tide Loading, SIO Ref. Ser. 96-8. La Jolla, CA: Scripps Institution of Oceanography.
Aloisi, M., Jin, S., Pulvirenti, F., and Scaltrito, A. (2017). The December 2015 Mount Etna eruption: an analysis of inflation/deflation phases and faulting processes. J. Geodyn. 107, 34–45. doi: 10.1016/j.jog.2017.03.003
Aloisi and The INGV-OE (2019). The Dec 24, 2018 eruptive intrusion at Etna volcano revealed and imaged by multi-disciplinary deformation networks (borehole tiltmeters, borehole strainmeters, continuous GPS, mobile GPS. InSAR). Geoph. Res. Abstracts 21:EGU2019-7429.
Amoruso, A., Crescentini, L., Scarpa, R., Bilham, R., Linde, A. T., and Sacks, I. S. (2015). Abrupt magma chamber contraction and microseismicity at Campi Flegrei, Italy: cause and effect determined from strainmeters and tiltmeters. J. Geophys. Res. Solid Earth 120, 5467–5478. doi: 10.1002/2015JB012085
Behncke, B., Branca, S., Corsaro, R. A., De Beni, E., Miraglia, L., and Proietti, C. (2014). The 2011–2012 summit activity of Mount Etna: birth, growth and products of the new SE crater. J. Volcanol. Geotherm. Res. 270, 10–21. doi: 10.1016/j.jvolgeores.2013.11.012
Bonaccorso, A., and Calvari, S. (2013). Major effusive eruptions and recent lava fountains: balance between expected and erupted magma volumes at Etna volcano. Geophys. Res. Lett. 40, 6069–6073. doi: 10.1002/2013GL058291
Bonaccorso, A., and Calvari, S. (2017). A new approach to investigate an eruptive paroxysmal sequence using camera and strainmeter networks: lessons from the 3–5 December2015 activity at Etna volcano. Earth Planet. Sci. Lett. 475, 231–241. doi: 10.1016/j.epsl.2017.07.020
Bonaccorso, A., Calvari, S., Currenti, G., Del Negro, C., Ganci, G., Linde, A., et al. (2013a). From source to surface: dynamics of Etna’s lava fountains investigated by continuous strain, magnetic, ground and satellite thermal data. Bull. Volcanol. 75:690. doi: 10.1007/s00445-013-0690-9
Bonaccorso, A., Currenti, G., Linde, A., and Sacks, S. (2013b). New data from borehole strainmeters to infer lava fountain sources (Etna 2011–2012). Geophys. Res. Lett. 40, 3579–3584. doi: 10.1002/grl.50692
Bonaccorso, A., Calvari, S., Linde, A., and Sacks, S. (2014). Eruptive processes leading to the most explosive lava fountain at Etna volcano: the 23 November 2013 episode. Geophys. Res. Lett. 41, 4912–4919. doi: 10.1002/2014GL060623
Bonaccorso, A., Calvari, S., Linde, A., Sacks, S., and Boschi, E. (2012). Dynamics of the shallow plumbing system investigated from borehole strainmeters and cameras during the 15 March 2007 Vulcanian paroxysm at Stromboli volcano. Earth Planet. Sci. Lett. 357, 249–256. doi: 10.1016/j.epsl.2012.09.009
Bonaccorso, A., and Davis, P. M. (2004). “Modeling of ground deformation associated with recent lateral eruptions: mechanics of magma ascent and intermediate storage at Mt. Etna,” in Etna: Volcano Laboratory, Vol. 143, eds A. Bonaccorso, S. Calvari, M. Coltelli, C. Del Negro, and S. Falsaperla, (Washington, DC: AGU), 293–306. doi: 10.1029/143gm18
Bonaccorso, A., Linde, A., Currenti, G., Sacks, S., and Sicali, A. (2016). The borehole dilatometer network of Mount Etna: a powerful tool to detect and infer volcano dynamics. J. Geophys. Res. Solid Earth 121, 4655–4669. doi: 10.1002/2016JB012914
Bonforte, A., Guglielmino, F., and Puglisi, G. (2019). Large dyke intrusion and small eruption: the December 24, 2018 Mt. Etna eruption imaged by Sentinel-1 data. Terra Nova 31, 405–412. doi: 10.1111/ter.12403
Calvari, S., Cannavò, F., Bonaccorso, A., Spampinato, L., and Pellegrino, A. G. (2018). Paroxysmal explosions, Lava fountains and Ash Plumes at Etna Volcano: eruptive PRocesses and Hazard implications. Front. Earth Sci. 6:107. doi: 10.3389/feart.2018.00107
Cannata, A., Di Grazia, G., Giuffrida, M., Gresta, S., Palano, M., Sciotto, M., et al. (2018). Space-time evolution of magma storage and transfer at Mt. Etna volcano (Italy): the 2015–2016 reawakening of Voragine crater. Geochem. Geophys. Geosyst. 19, 471–495. doi: 10.1002/2017GC007296
Chardot, L., Voight, B., Foroozan, R., Sacks, S., Linde, A., Stewart, R., et al. (2010). Explosion dynamics from strainmeter and microbarometer observations, Soufrière Hills Volcano, Montserrat: 2008–2009. Geophys. Res. Lett. 37:L00E24. doi: 10.1029/2010GL044661
Currenti, G., and Bonaccorso, A. (2019). Cyclic magma recharge pulses detected by high-precisionstrainmeter data: the case of 2017 inter-eruptive activity at Etna volcano. Sci. Rep. 9:7553. doi: 10.1038/s41598-019-44066-w
Currenti, G., Bonaccorso, A., Del Negro, C., and Scandura, D. (2010). Elastoplastic modeling of volcano ground deformation, with application on Mt Etna. Earth Planet. Sci. Lett. 296, 311–318. doi: 10.1016/j.epsl.2010.05.013
Currenti, G., Zuccarello, L., Bonaccorso, A., and Sicali, A. (2017). Borehole volumetric strainmeter calibration from a nearby seismic broadband array at Etna volcano. J. Geophys. Res. 122, 7729–7738. doi: 10.1002/2017JB014663
De Beni, E., Behncke, B., Branca, S., Nicolosi, I., Carluccio, R., D’Ajello Caracciolo, F., et al. (2015). The continuing story of Etna’s New Southeast Crater (2012–2014): evolution and volume calculations based on field surveys and aerophotogrammetry. J. Volcanol. Geother. Res. 303, 175–186. doi: 10.1016/j.jvolgeores.2015.07.021
De Novellis, V., Atzori, S., De Luca, C., Manzo, M., Valerio, E., Bonano, M., et al. (2019). DInSAR analysis and analytical modeling of mount Etna displacements: the December 2018 volcano-tectonic crisis. Geophys. Res. Lett. 46, 5817–5827. doi: 10.1029/2019GL082467
Gambino, S., Cannata, A., Cannavò, F., La Spina, A., Palano, M., Sciotto, M., et al. (2016). The unusual 28 December 2014 dike-fed paroxysm at Mount Etna: timing and mechanism from a multidisciplinary perspective. J. Geophys. Res. Solid Earth 121, 2037–2053. doi: 10.1002/2015JB012379
Gilbert, F. (1971). Excitation of normal modes of the Earth by earthquake sources. Geophys. J. R. Astronom. Soc. 22, 223–226. doi: 10.1111/j.1365-246x.1971.tb03593.x
Gilbert, F., and Dziewonski, A. M. (1975). An application of normal mode theory to the retrieval of structural parameters and source mechanisms from seismic spectra. Philos. Trans. 278, 187–269. doi: 10.1098/rsta.1975.0025
Harris, A. J. L., Steffke, A., Calvari, S., and Spampinato, L. (2011). Thirty years of satellite-derived lava discharge rates at Etna: implications for steady volumetric output. J. Geophys. Res. 116:B08204. doi: 10.1029/2011JB008237
Hautmann, S., Witham, F., Christopher, T., Cole, P., Linde, A. T., and Sacks, S. I, et al. (2014). Strain field analysis on Montserrat (W.I.) as tool for assessing permeable flow paths in the magmatic system of Soufriere Hills Volcano. Geochem. Geophys. Geosyst. 15, 676–690. doi: 10.1002/2013GC005087
Head, J. W. III, and Wilson, L. (1987). Lava fountain heights at Pu’u ‘O’o, Kilauea, Hawaii: indicators of amount and variations of exsolved magma volatiles. J. Geophys. Res. 92, 715–713.
Hodgkinson, K., Langbein, J., Liu, B., Henderson, O., Mencin, D., and Borsa, A. (2013). Tidal calibration of plate boundary observatory borehole strainmeters. J. Geophys. Res. 118, 447–458. doi: 10.1029/2012JB009651
Hurwitz, S., and Johnston, M. J. S. (2003). Groundwater level changes in a deep well in response to a magma intrusion event on Kilauea Volcano, Hawai’i. Geophys. Res. Lett. 30:2173. doi: 10.1029/2003GL018676
Iguchi, M. (2016). Method for real-time evaluation of discharge rate of volcanic ash – case study on intermittent eruptions at the Sakurajima volcano, Japan –. J. Disaster Res. 11, 4–14. doi: 10.20965/jdr.2016.p0004
Johnston, M. J. S., Lisowski, M., Hill, D. P., and Power, J. (2001). Mechanics of volcanic activity in Long Valley and Kilauea/Mauna Loa volcanic areas from multi-parameter borehole measurements. Trans. Am. Geophys. Un. 82: F1309.
Laiolo, M., Ripepe, M., Cigolini, C., Coppola, D., Della Schiava, M., Genco, R., et al. (2019). Space- and ground-based geophysical data tracking of Magma Migration in shallow feeding system of Mount Etna Volcano. Remote Sens. 11:1182. doi: 10.3390/rs11101182
Langbein, J. (2015). Borehole strainmeter measurements spanning the 2014 Mw6.0 South Napa Earthquake, California: the effect from instrument calibration. J. Geophys. Res. 120, 7190–7202. doi: 10.1002/2015JB012278
Linde, A. T., Agustsson, K., Sacks, I. S., and Stefansson, R. (1993). Mechanism of the 1991 eruption of Hekla from continuous borehole strain monitoring. Nature 365, 737–740. doi: 10.1038/365737a0
Linde, A. T., Kamigaichi, O., Churei, M., Kanjo, K., and Sacks, S. (2016). Magma chamber recharging and tectonic influence on reservoirs: the 1986 eruption of Izu-Oshima. J. Volcanol. Geotherm. Res. 311, 72–78. doi: 10.1016/j.jvolgeores.2016.01.001
Linde, A. T., and Sacks, S. (1995). “Continuous monitoring of volcanoes with borehole strainmeters,” in Mauna Loa Revealed: Structure, Composition, History, and Hazards, eds J. M. Rhodes and J. P. Lockwood, (Washington, DC: AGU), 171–185. doi: 10.1029/GM092p0171
Linde, A. T., Sacks, S., Hidayat, D., Voight, B., Clarke, A., Elsworth, D., et al. (2010). Vulcanian explosion at Soufrière Hills Volcano, Montserrat on March 2004 as revealed by strain data. Geophys. Res. Lett. 37:L00E07. doi: 10.1029/2009GL041988
Patanè, D., De Gori, P., Chiarabba, C., and Bonaccorso, A. (2003). Magma ascent and pressurization of Mt. Etna’s volcanic system. Science 299, 2061–2063. doi: 10.1126/science.1080653
Roeloffs, E. A. (2010). Tidal calibration of Plate Boundary Observatory borehole strainmeters: roles of vertical and shear coupling. J. Geophys. Res. 115:B06405. doi: 10.1029/2009JB006407
Roeloffs, E. A., and Linde, A. T. (2007). “Borehole observations and continuous strain and fluid pressure,” in Volcano Deformation Geodetic Measurments Tecniques, ed. D. Dzurisin, (Berlin: Springer), 305–322. doi: 10.1007/978-3-540-49302-0_9
Sacks, I. S., Suyehiro, S., Evertson, D. W., and Yamagishi, Y. (1971). Sacks-Evertson strainmeter, its installation in Japan and some preliminary results concerning strain steps. Pap. Meteorol. Geophys. 22, 195–208. doi: 10.2467/mripapers1950.22.3-4_195
Sturkell, E., Agustsson, K., Linde, A. T., Sacks, S. I, Einarsson, P., Sigmundsson, F., et al. (2013). New insights into volcanic activity from strain and other deformation data for the Hekla 2000 eruption. J. Volcanol. Geotherm. Res. 256, 78–86. doi: 10.1016/j.jvolgeores.2013.02.001
Tamura, Y., Sato, T., Ooe, M., and Ishiguro, M. (1991). A procedure for tidal analysis with a Bayesian information criterion. Geophys. J. Int. 104, 507–516. doi: 10.1111/j.1365-246X.1991.tb05697.x
Voight, B., Linde, A. T., Sacks, I. S., Mattioli, G. S., Sparks, R. S. J., Elsworth, D., et al. (2006). Unprecedented pressure increase in deep magma reservoir triggered by lava-dome collapse. Geophys. Res. Lett. 33:L03312. doi: 10.1029/2005GL024870