Introduction
According to the IPCC AR5, with the increase of global populations and economies, the man-made emissions of greenhouse gases have remained rising and reached the industrial history peak at the beginning of the 21st century (IPCC, 2013). The global mean temperature at the end of the 21st century will probably be 1.5°C higher than that in 1899–1990 under the influence of current emission trends (Arnette, 2017).
China, which is located in East Asia, has a vast territory, abundant climate zones and complex topography (Guo et al., 2017a). Owing to the stronger regional seasonal wind led by global warming, more moisture in the atmosphere will be transported to land areas from ocean, then resulting in more extreme precipitation events in China recently (Hui et al., 2018). For example, ten million residents were displaced and billion dollars economy cost was caused by the Yangtze River flood in 1998 (Chen and Zong, 2000). The serious urban waterlogging events in Beijing in 2012 caused thousands people death and 11.6 billion economic losses (Zhang D.L. et al., 2013).
As one of the effective energies to alleviate the greenhouse effect caused by fossil energy, renewable energy is in a fast-growing demand. Renewable energy has taken 18.2% in world total energy consumption in 2016 (REN21, 2018). In the meantime, the development of renewable energy in China is also rapidly developed. Renewable energy generation, which is up to 1676 TWh, has taken 30% in total national power generation in 2017 (CREO, 2018). Relative to other types of renewable energy, owing to the lowest cost, easier to control and manage and lower intermittent and uncertainly means, hydropower is a kind of the most widely used renewable energies (Panwar et al., 2011; Chu and Majumdar, 2012; Jiang et al., 2018). In 2017, the new generating capacity of hydropower in China is 9.12 GW, and the total installed capacity reached 341 GW. The hydropower generation has taken almost 20% of total power generation, which is far more than the generation of wind energy (5%) and solar energy (2%). Therefore, more hydropower is planned by China’s government to generate electricity and replace fuel energy (IHA, 2018).
Hydropower is sensitive to climate change, especially for precipitation. Based on the change of runoff, Ali et al. (2018) evaluated and predicted the power generation of seven large hydropower stations in India. Results illustrated that the specific future climate may increase hydropower generation by about 25%. Liu et al. (2016) thought runoff and reservoir storage has a great influence on hydropower, then Generation Hydropower Potential (GHP) and Development Hydropower Potential (DHP) are tested based on 8 Global Hydro Models (GHMs), indicating that GHP will have a 3–6% increase between 2070 and 2099. Obviously, precipitation has a direct influence on basin runoff change, which will finally affect hydropower generation (Berghuijs et al., 2014; Wasko and Sharma, 2017). Based on the observed data, Chilkoti et al. (2017) found that generation of hydropower stations and the precipitation have close links, the generation of hydropower stations may rise 39% when the precipitation rise 43%. Above all, climate change has a more direct impact on precipitation, but few studies are analyzing the influence of precipitation changes under the context of global warming on hydropower generation (Guo et al., 2018). Hence, it is significant to explore the relationship between precipitation changes and hydropower generation, and the results could provide some suggestions and measures to the government policy makers in hydropower to response the climate change better.
In this study, stepwise cluster analysis (SCA) statistic method is used to downscale future climate data from PRECIS regional climate model (RCM). Then, the hydropower response model driven by precipitation (HRMDP) is established. Finally, a hydropower station in Dadu River basin is taken as a case to quantitatively analyze future climate change influence on hydropower generation.
Data and Methods
As shown in the Figure 1, four analysis steps are divided in this paper. The first step is collecting precipitation and power generation data, which include large-scale HadGEM2-ES climate data, observation of meteorological stations and generation data of hydropower stations. Then, the statistical downscaling simulation in precipitation using SCA method is conducted. Specifically, some independent variables in large scale grids in PRECIS RCM, such as precipitation, temperature, humidity and pressure are extracted firstly, afterward, the precipitation in station scale is simulated and projected by the SCA statistic downscaling method. The third step is the establishment of a HRMDP based on the hydropower potential (HP). In the end, we use the projected precipitation under RCP4.5 and RCP8.5 climate emission scenarios to drive the HRMDP to analyze the change in hydropower in the case.
FIGURE 1
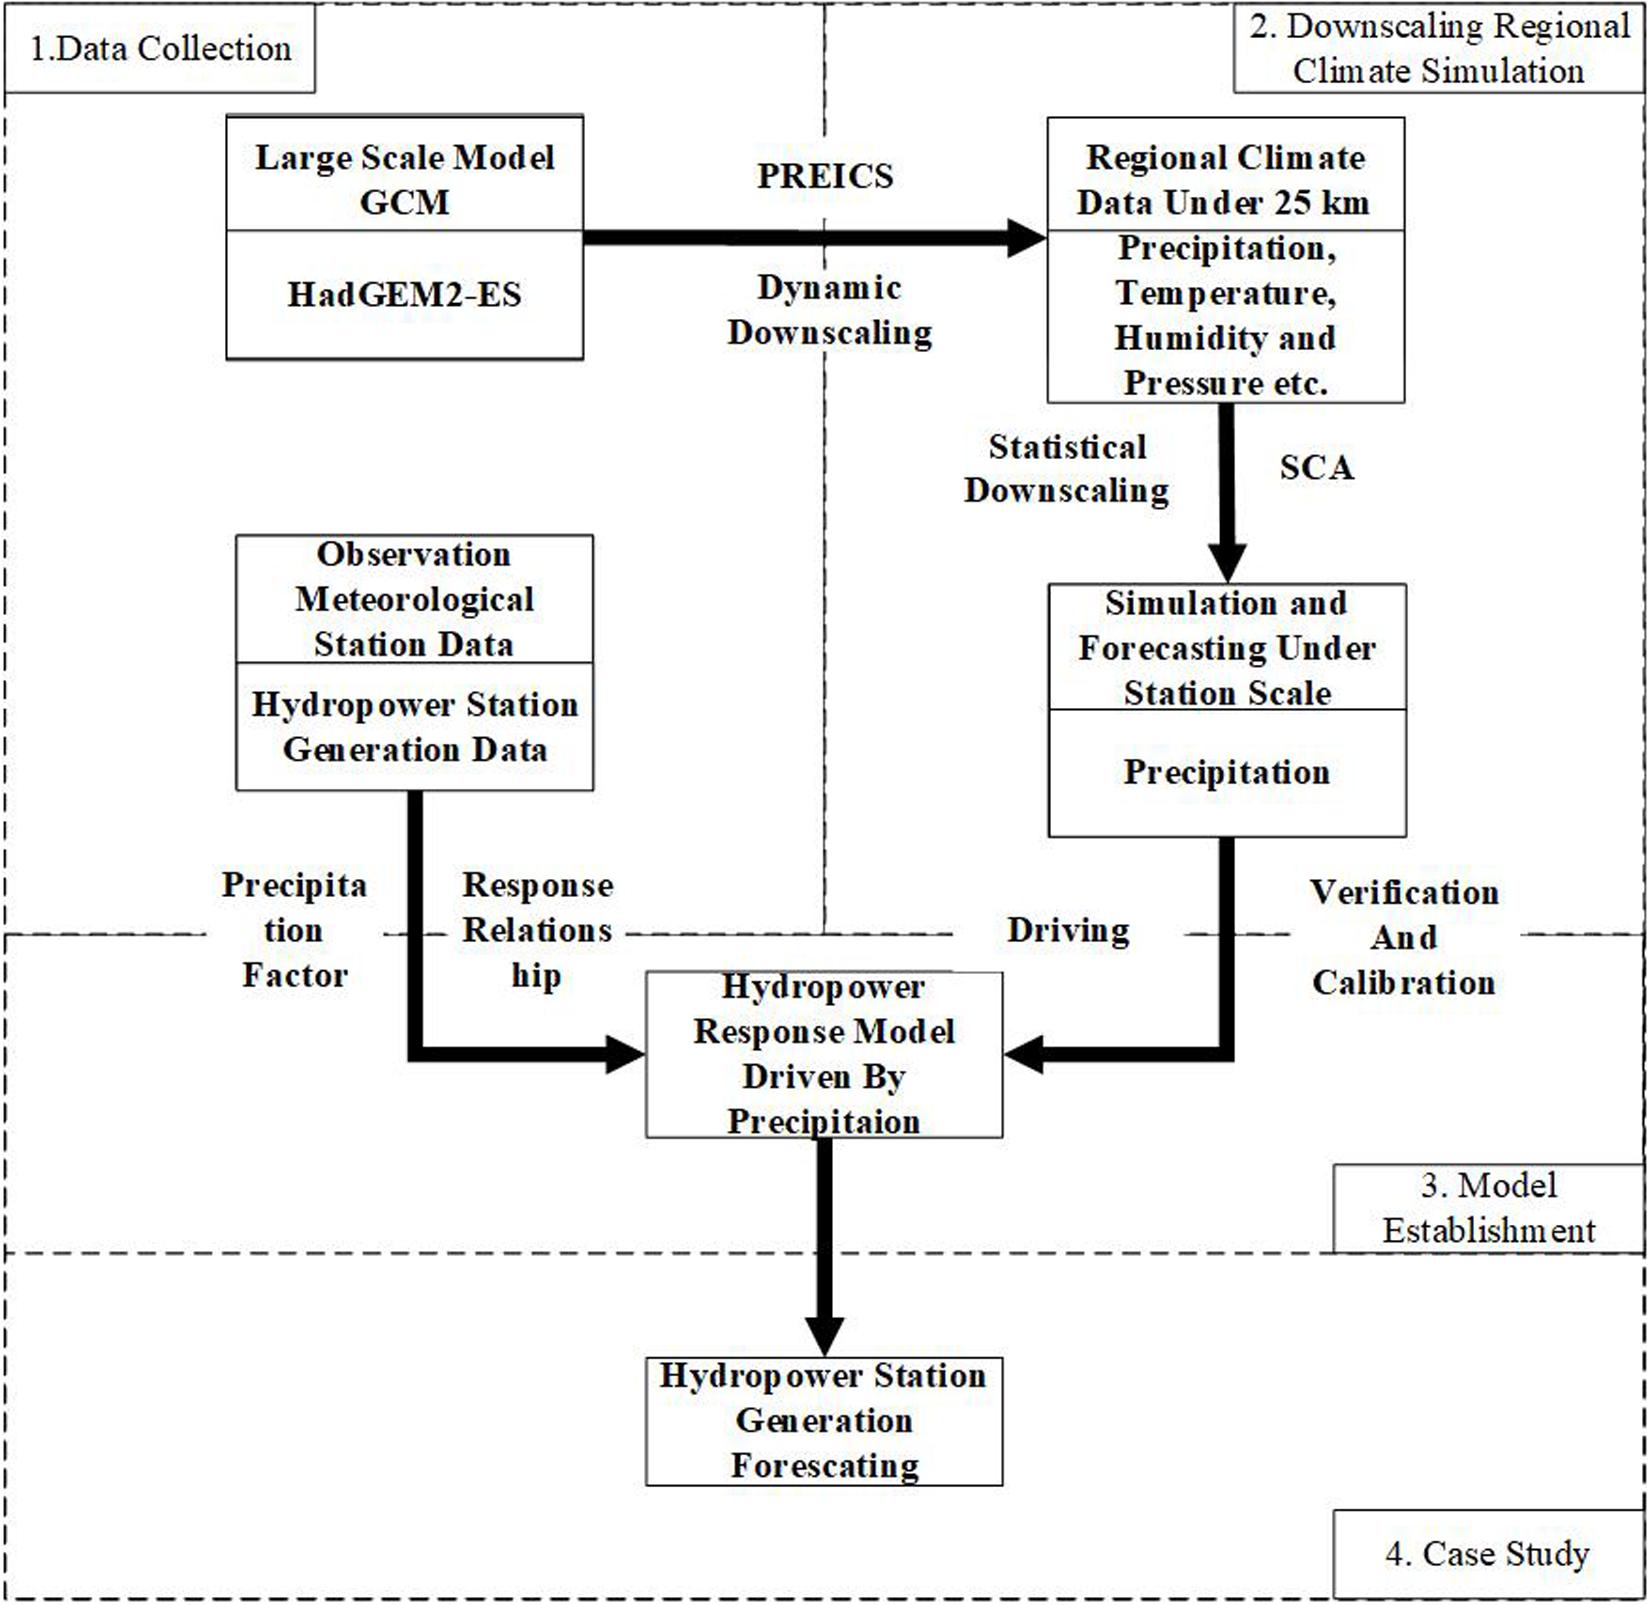
Figure 1. Study flow chart.
Hydropower Response Model Driven by Precipitation
In general, hydropower generation has a close relationship to precipitation. The increase in precipitation will lead to an increase in power generation, and continuous non-precipitation will cause a decrease in power generation (Chilkoti et al., 2017). Figure 2 shows that the daily precipitation and daily power generation of station A in Dadu River basin. The high power generation can be found in a high precipitation period (such as from June to September), while low power generation in low precipitation periods (such as from January to April and December). At the same period, power generation shows an increasing trend with increasing precipitation, and vice versa. According to Figure 2, we can find that there is a certain relationship between precipitation and power generation, and the power generation is sensitive to the change of precipitation.
FIGURE 2
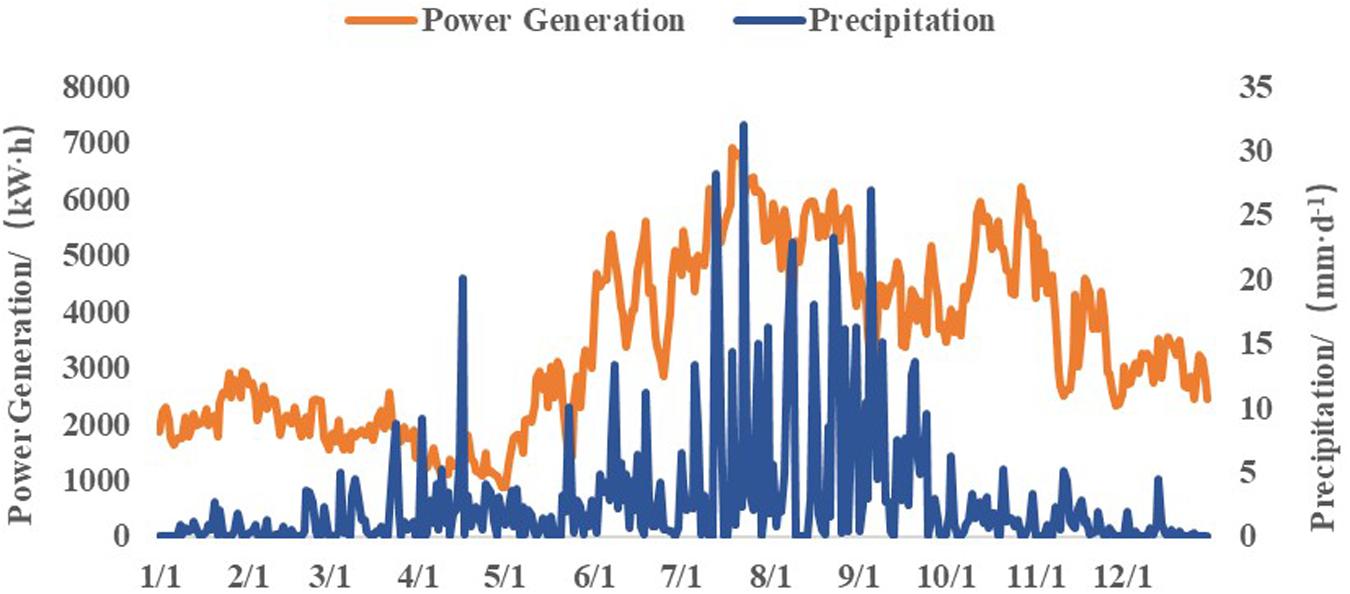
Figure 2. Daily precipitation and power generation of a hydropower station in Dadu River basin.
Before establishing the hydropower response model, a new conception – HP is introduced. Hydropower potential is the perfect state power generation which only considers the precipitation as the influence condition, it can be calculated by daily precipitation without considering the actual generating capacity. In this paper, HP mainly depends on the daily precipitation. In addition, continually precipitation factor and non-precipitation factor also have influence on HP, which respectively represents the increased coefficient of power generation in the period of continue precipitation and the decline coefficient of power generation in the period of non-precipitation. The detailed calculation method is as follows:
Notations:
HPn – HP in the day n, kWh; Rn – Precipitation in the day n, mm; σ1 – The increasing coefficient of generation in the period of continue precipitation, dimensionless; σ2 – The decline coefficient of generation in the period of non-precipitation, dimensionless; Pn – The power generation in the day n, kWh; j – The number of days in some periods.
Hydropower potential represents the optimal power generation under the current precipitation status. Station power generation is not only restricted by natural factors but also influenced by human society factors (such as power policies and plans). Hence, the controllable coefficient, which represents human characteristics, is added to the formula. Formula b is used to restrict the power generation of actual production, and finally achieves the amount of constrained power generation.
Notations:
HPmax – Maximum HP during this period, kWh; HPmin – Minimum HP during this period, kWh; Pmax – Maximum power generation of generator set under the power plan of this period; Pmin – Minimum power generation of generator set under the power plan of this period; PF,n – The constrained power generation in day n of the period; δ – The controllable factor, which affected by actual power plan, power policy and more, and it shows as power generation fluctuates at a certain range.
Regional Climate Model
The future precipitation forecasting data are from two climate numerical simulations, which includes HadGEM2-ES and PRECIS. The former is a global climate model (GCM) and is used as the initial and boundary field data to drive the RCM PRECIS for dynamic downscaling. Developed by the UK’s The Met Office Hadley Centre, PRECIS is a high-resolution (25 km) RCM and it has been widely used in regional climate simulations and extreme events forecasting (Xu et al., 2009; Kerkhoff et al., 2014; Saini et al., 2015; Guo et al., 2017b, 2018; Hui et al., 2018).
SCA Statistical Downscaling Method
Although the results from RCMs can simulate the climate change of the whole region or basin, the higher-resolution simulations (i.e., station scale) still cannot be met through dynamical downscaling. Therefore, based on the results of RCM, statistical downscaling can be achieved by establishing the numerical statistical relation between the large-scale circulation fields and station-scale climate variables (i.e., precipitation). There are rich methods to be applied, the statistical downscaling has been widely applied in climate change influence analysis on precipitation and hydrology (Bellouin et al., 2011; Jones et al., 2011; Wang et al., 2015). However, it is necessary to select an appropriate statistical downscaling method to reflect the discrete and random characteristics for precipitation. The SCA uses a cluster tree to illustrate the relationship between the large-scale atmosphere fields and high spatial-resolution variables, especially in effectively dealing with the stochastic and non-linear relationships. Through the integration of missing data detection, correlation analysis, model calibration, cluster tree mapping and other auxiliary function modules, SCA can rapidly develop downscaling scenarios of local weather variables under current and future climate forcing, and performs well in predicting precipitation during the verification (Chen et al., 2011; Yang et al., 2016).
As shown in Figure 3, the first step in the SCA statistical downscaling is to select large-scale forecast factors. Following previous studies, the variables, including mean sea level pressure, surface airflow strength, surface wind direction, near-surface temperature, surface specific humidity, surface relative humidity, surface divergence, surface meridional velocity and more are selected as initial variables (Duan and Mei, 2013; Li and Yan, 2017). According to correlation analyze, Near-surface temperature, Surface relative humidity and Mean sea level pressure are selected as independent variables in statistical downscaling (Wood et al., 2004; Perkins et al., 2007; Liu et al., 2011). The meteorological station precipitation data are selected as dependent variable. Then, the independent variables of statistical downscaling are constituted as X matrix. The dependent variable is constituted as Y matrix. And using R Studio to create site scale precipitation SCA statistical downscaling training model, and build the clustering tree predictor to establish the quantitative relationship between precipitation and large-scale prediction factors.
FIGURE 3
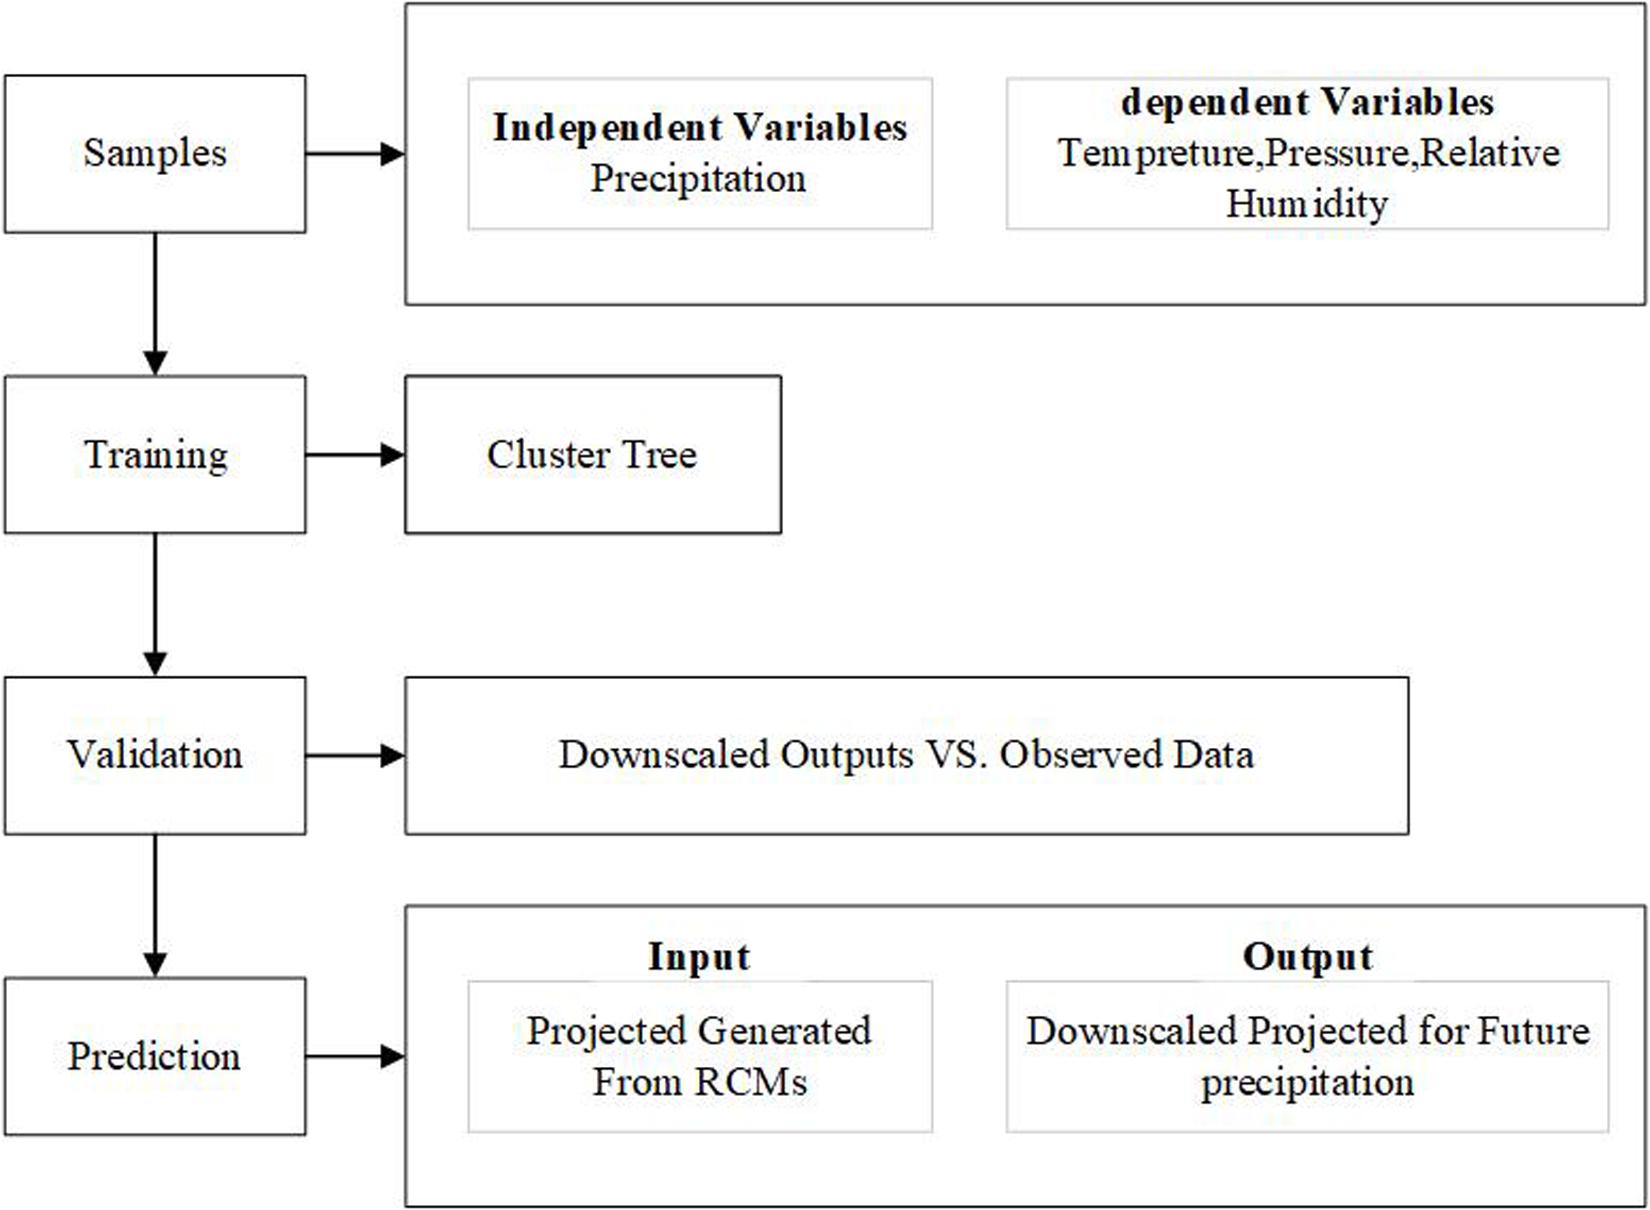
Figure 3. Stepwise cluster analysis downscaling flow chart.
Data
The data used for validation is divided into the following categories:
1. Climate simulation data. The future climate data from PRECIS are used to drive the power forecasting model. Its initial field and boundary field data as the driving data is from HadGEM2-ES(GCM). HadGEM2-ES is a coupled AOGCM with atmospheric resolution of N96 (1.875° × 1.25°) with 38 vertical levels and an ocean resolution of 1° (increasing to 1/3° at the equator) and 40 vertical levels. HadGEM2-ES also represents interactive land and ocean carbon cycles and dynamic vegetation with an option to prescribe either atmospheric CO2 concentrations or to prescribe anthropogenic CO2 emissions and simulate CO2 concentrations as described. An interactive tropospheric chemistry scheme is also included, which simulates the evolution of atmospheric composition and interactions with atmospheric aerosols. The model time step is 30 min (atmosphere and land) and 1 h (ocean) (Jones et al., 2011). The PRECIS is able to run at two different horizontal resolutions: 0.44° × 0.44° (approximately 50 km × 50 km) and 0.22° × 0.22° (approximately 25 km × 25 km), with 19 atmospheric levels in the vertical using a hybrid coordinate system (Guo et al., 2017b).
2. Climate Observation data. The CN05 precipitation data set is used to validate the precipitation results of GCM and RCM. CN05 is a dataset consisting of daily mean, maximum, and minimum temperature on a 0.25 × 0.25° grid has been constructed over mainland China for the 45-years period of 1961–2005. CN05 is derived from interpolating observations from 751 stations distributed throughout the entire Chinese territory except Taiwan. The interpolation follows basically the same approach used in generating the CRU dataset, whereby a gridded climatology is calculated first, and then a gridded anomaly is added to obtain the final data (Xu et al., 2009).
3. Meteorological station data. The observation is used to validate the results of RCM and build the HRMDP. It is from the real-time monitoring stations, including daily precipitation, near-surface temperature, surface relative humidity and surface wind speed.
4. Hydropower station data. The daily power generation data is used to calibrate and verify the simulation results of the power forecasting model.
Case Study
The Dadu River basin which shown in Figure 4, is located between 99°42’E–103°48’E and 28°15’N–33°33’N and lies in the transition area of Tibet Plateau and Sichuan Basin. Dadu River basin meets the Minjiang River in Leshan. It is the largest tributary of the Minjiang River and the secondary tributary of the Yangzi River. Dadu River Basin has an abundant hydro resource, which has 7.74 × 10⁴ km2 basin area and a total of 149 tributaries. The mainstream, which is 1062 km long and 48.8 km3 annual net flow, and has 33730 MW water resource reserve. The annual precipitation of Dadu River Basin is about 800–1000 mm, and the precipitation from May to October takes up 80% of the whole year (Yang et al., 2017). As a key hydropower development area in China, Dadu River basin has many large power stations.
FIGURE 4
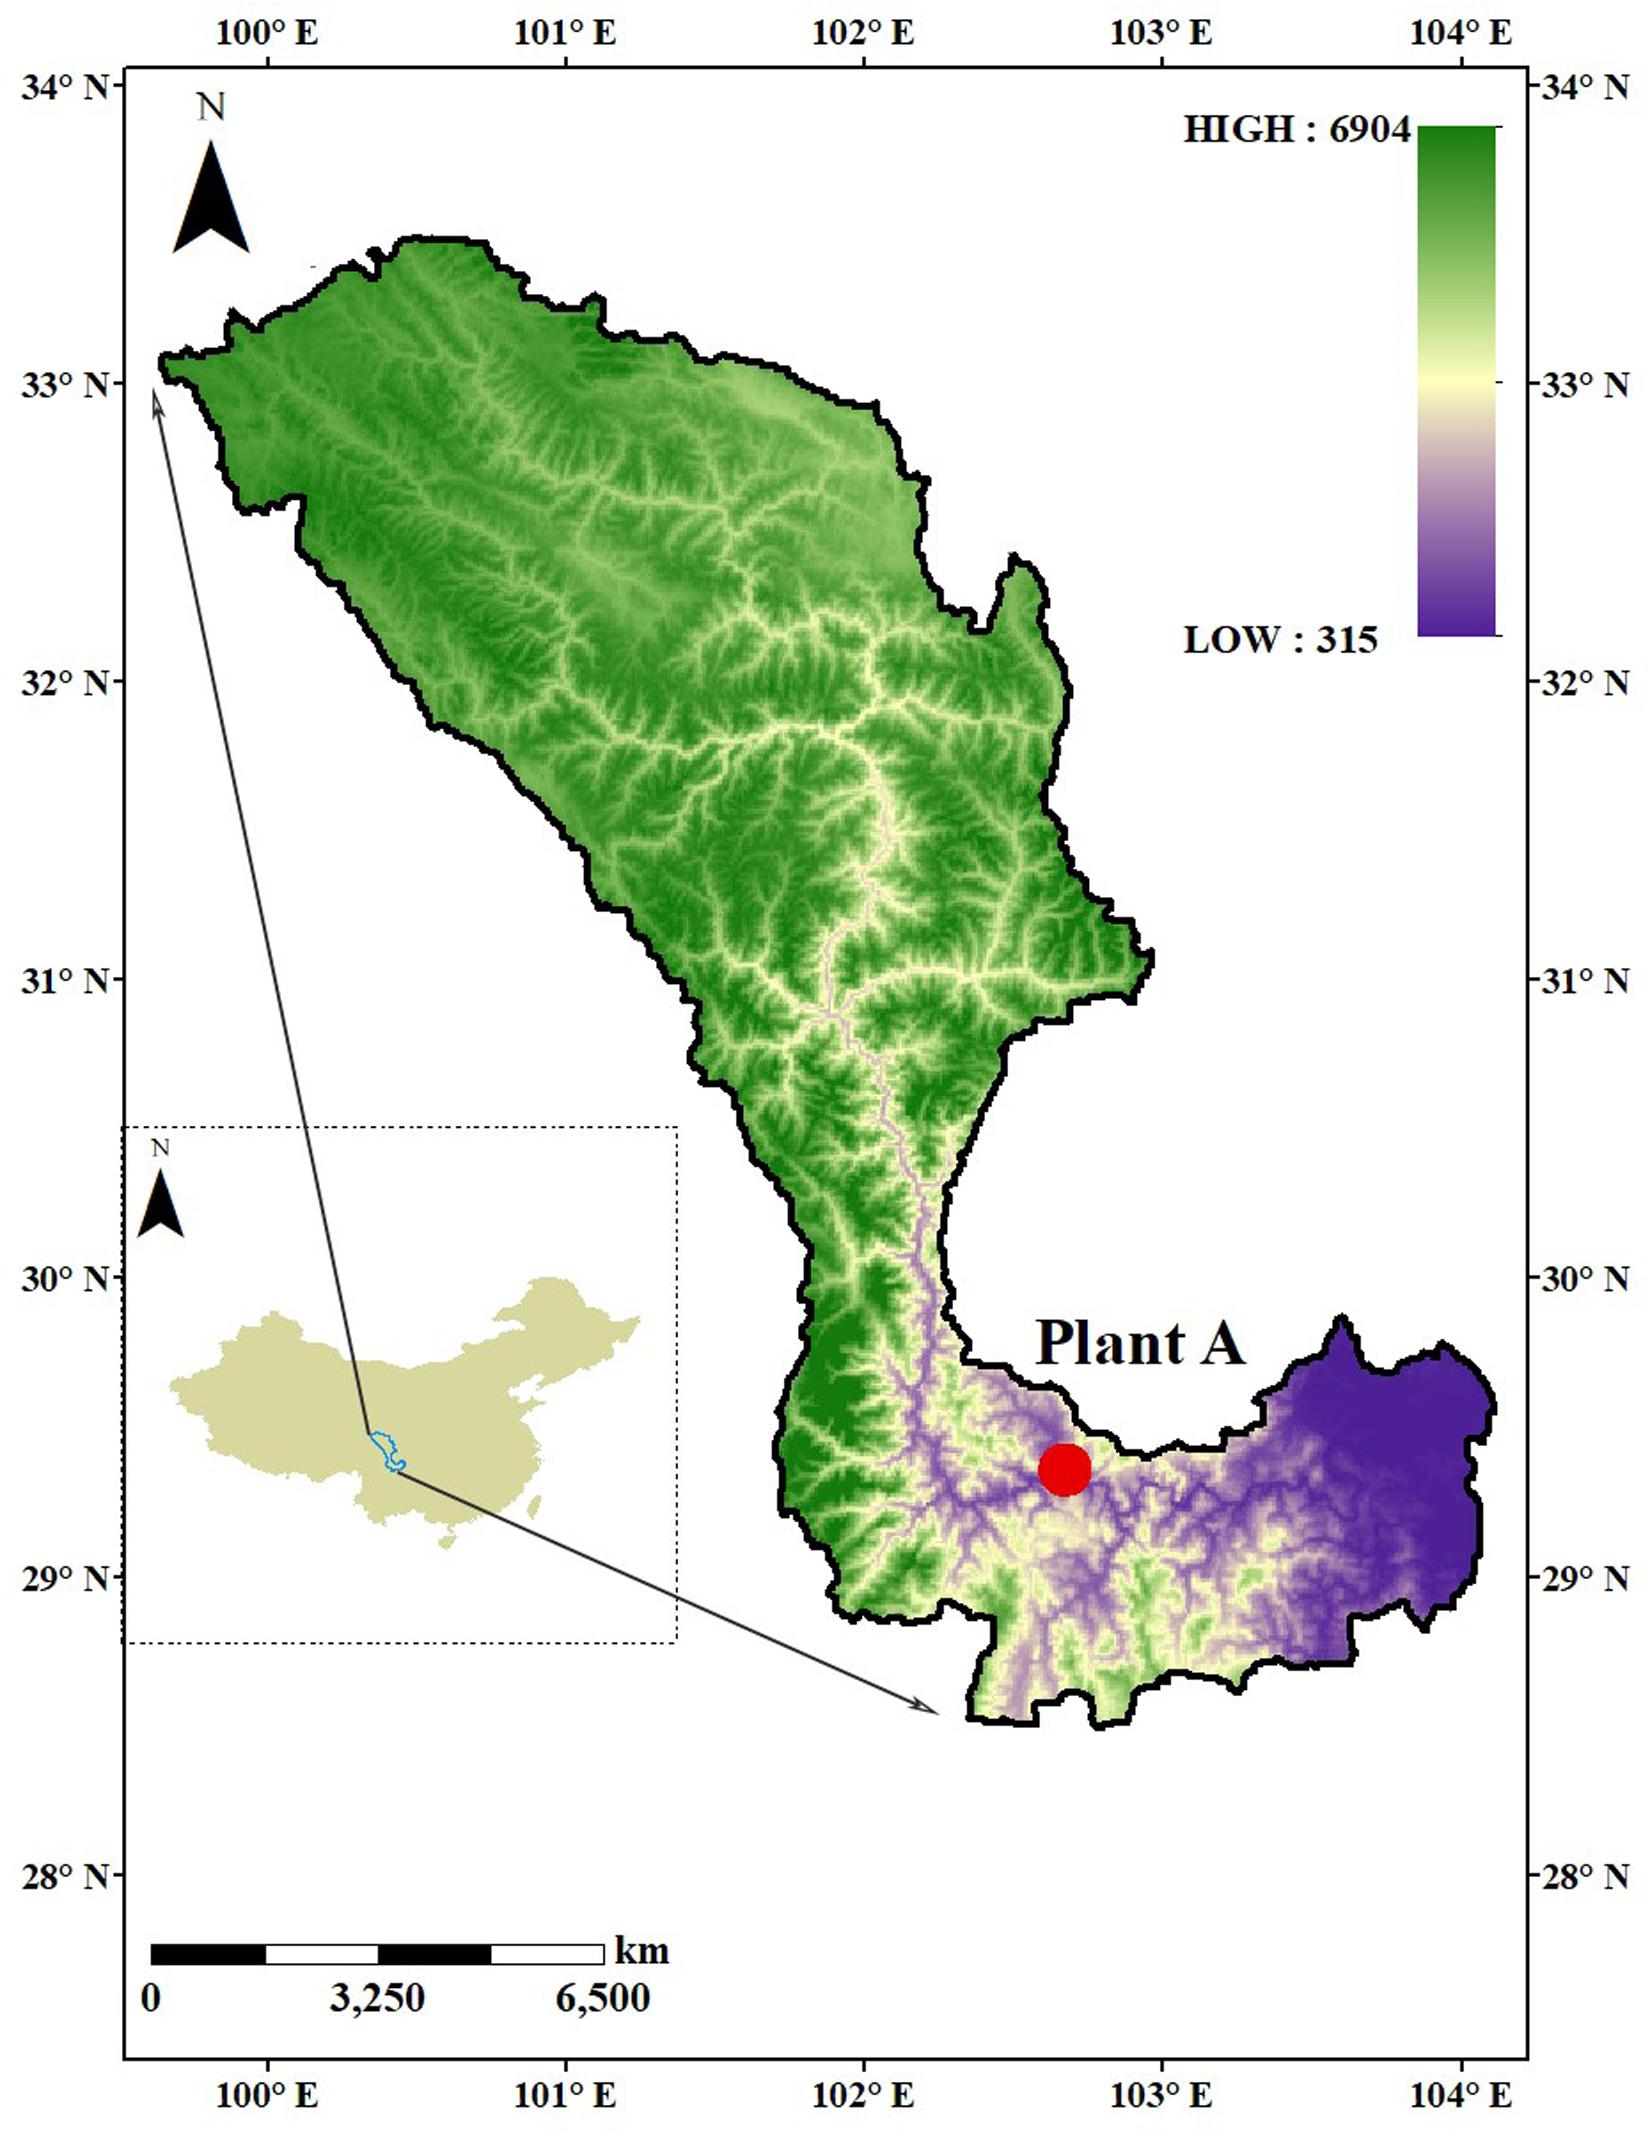
Figure 4. Dadu River basin.
Station A is one of the largest hydropower stations in China, the power capacity of station A is nearly 3.6 million KW, and the reservoir capacity is 5.337 billion km3. Due to the greatest power generation in Dadu River Basin and the most abundant water resources, station A is selected as the research object (Zhang and Xu, 2014).
Moreover, according to the precipitation feature of Dadu River basin and power generation plan for station A. Five main power generation periods in a year are divided, which include Dry I (from January to April), Neutral I (May), Wet (from June to October), Neutral II (November) and Dry II (December).
In this paper, we take the power station A as a case and use HRMDP model to build the relationship between meteorological factors and power generation capacity. Then based on the projection in precipitation from dynamical and statistical downscaling results, the influence of precipitation on power generation from 2025 to 2035 will be analyzed.
Results
Simulation and Verification
The results of climate models and their deviations with CN05 in different periods are shown in Figure 5. Compared with the results of CN05, GCM underestimates the precipitation in most regions of the basin but overestimates the precipitation in the middle of basin. Due to the rough resolutions in GCM, the results of most areas only show a single value. On the other hand, PRECIS improves the spatial resolutions and shows more details in reproducing the precipitation in Dadu River basin, especially in autumn in Figure 6. The results in PRECIS are similar to the observation, and the deviation is between -1 mm and 1 mm in the midstream. In terms of different periods, Dry II shows a better performance (±1 mm biases) than that in Dry I (∼2 mm). From the spatial distribution, the deviation is between 0 and 1 mm in the upstream, while the value is larger (∼2 mm) in the downstream.
FIGURE 5
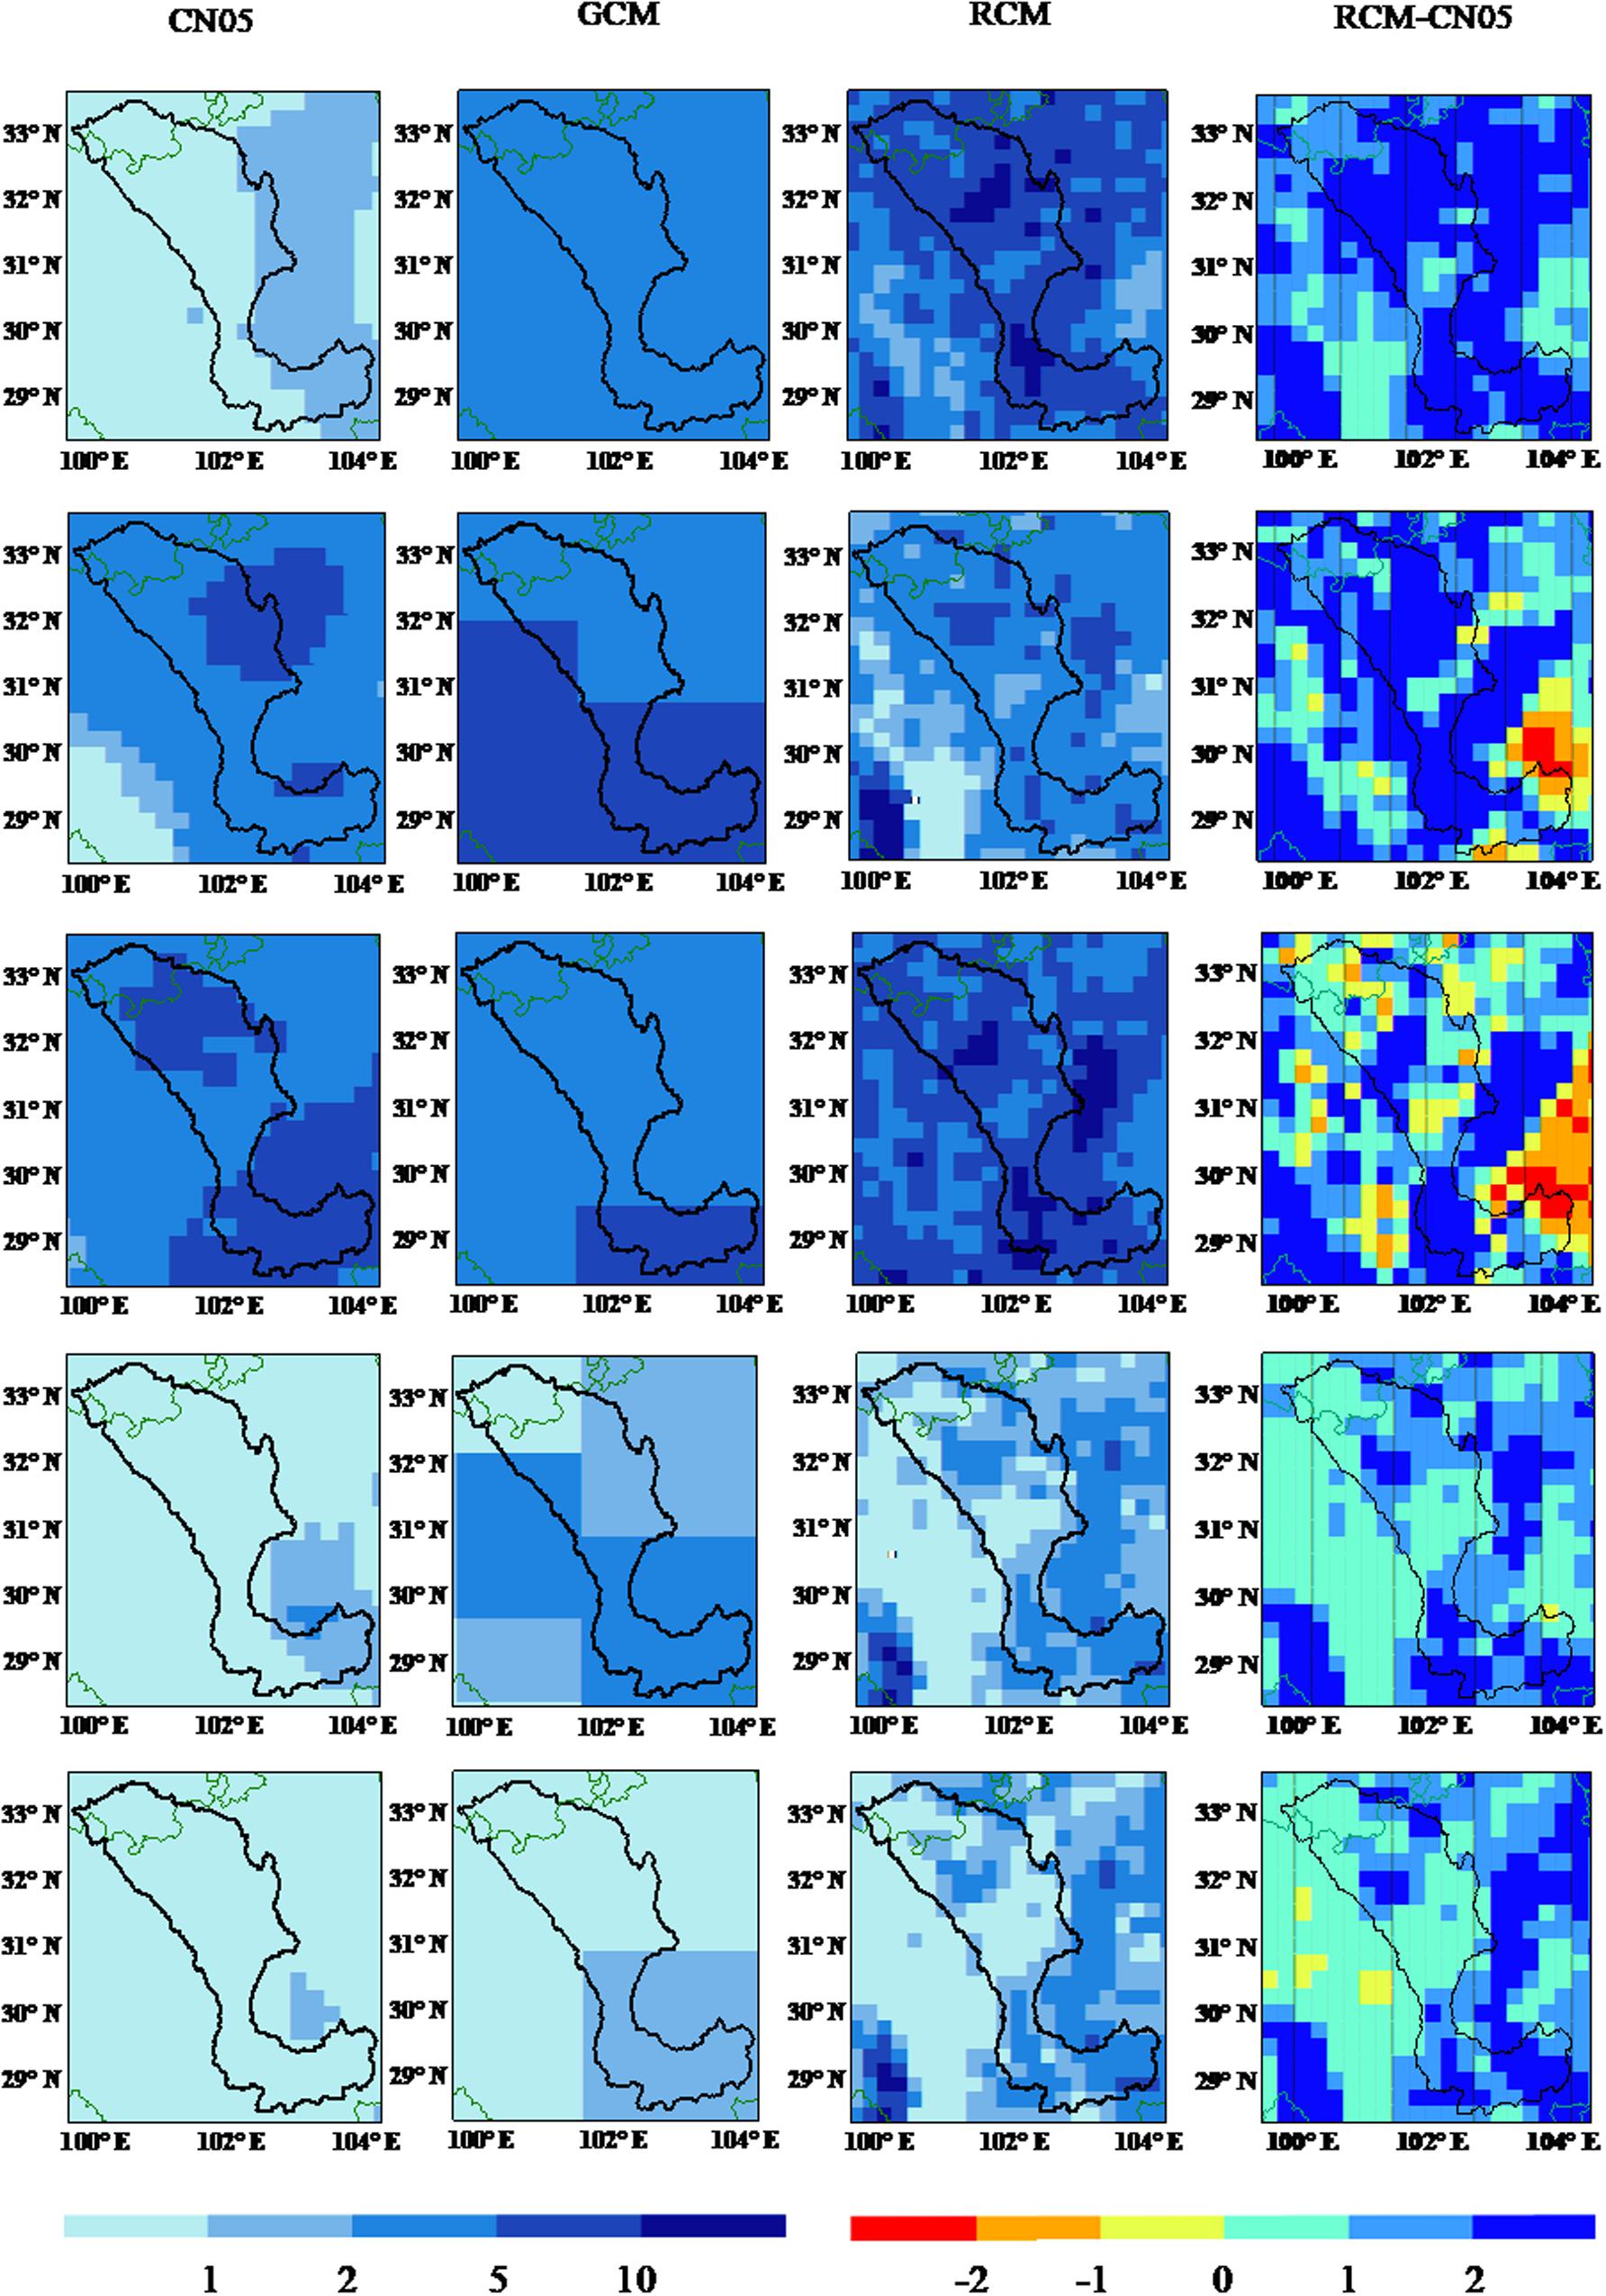
Figure 5. Simulation results and deviation of difference scale models in each period.
FIGURE 6
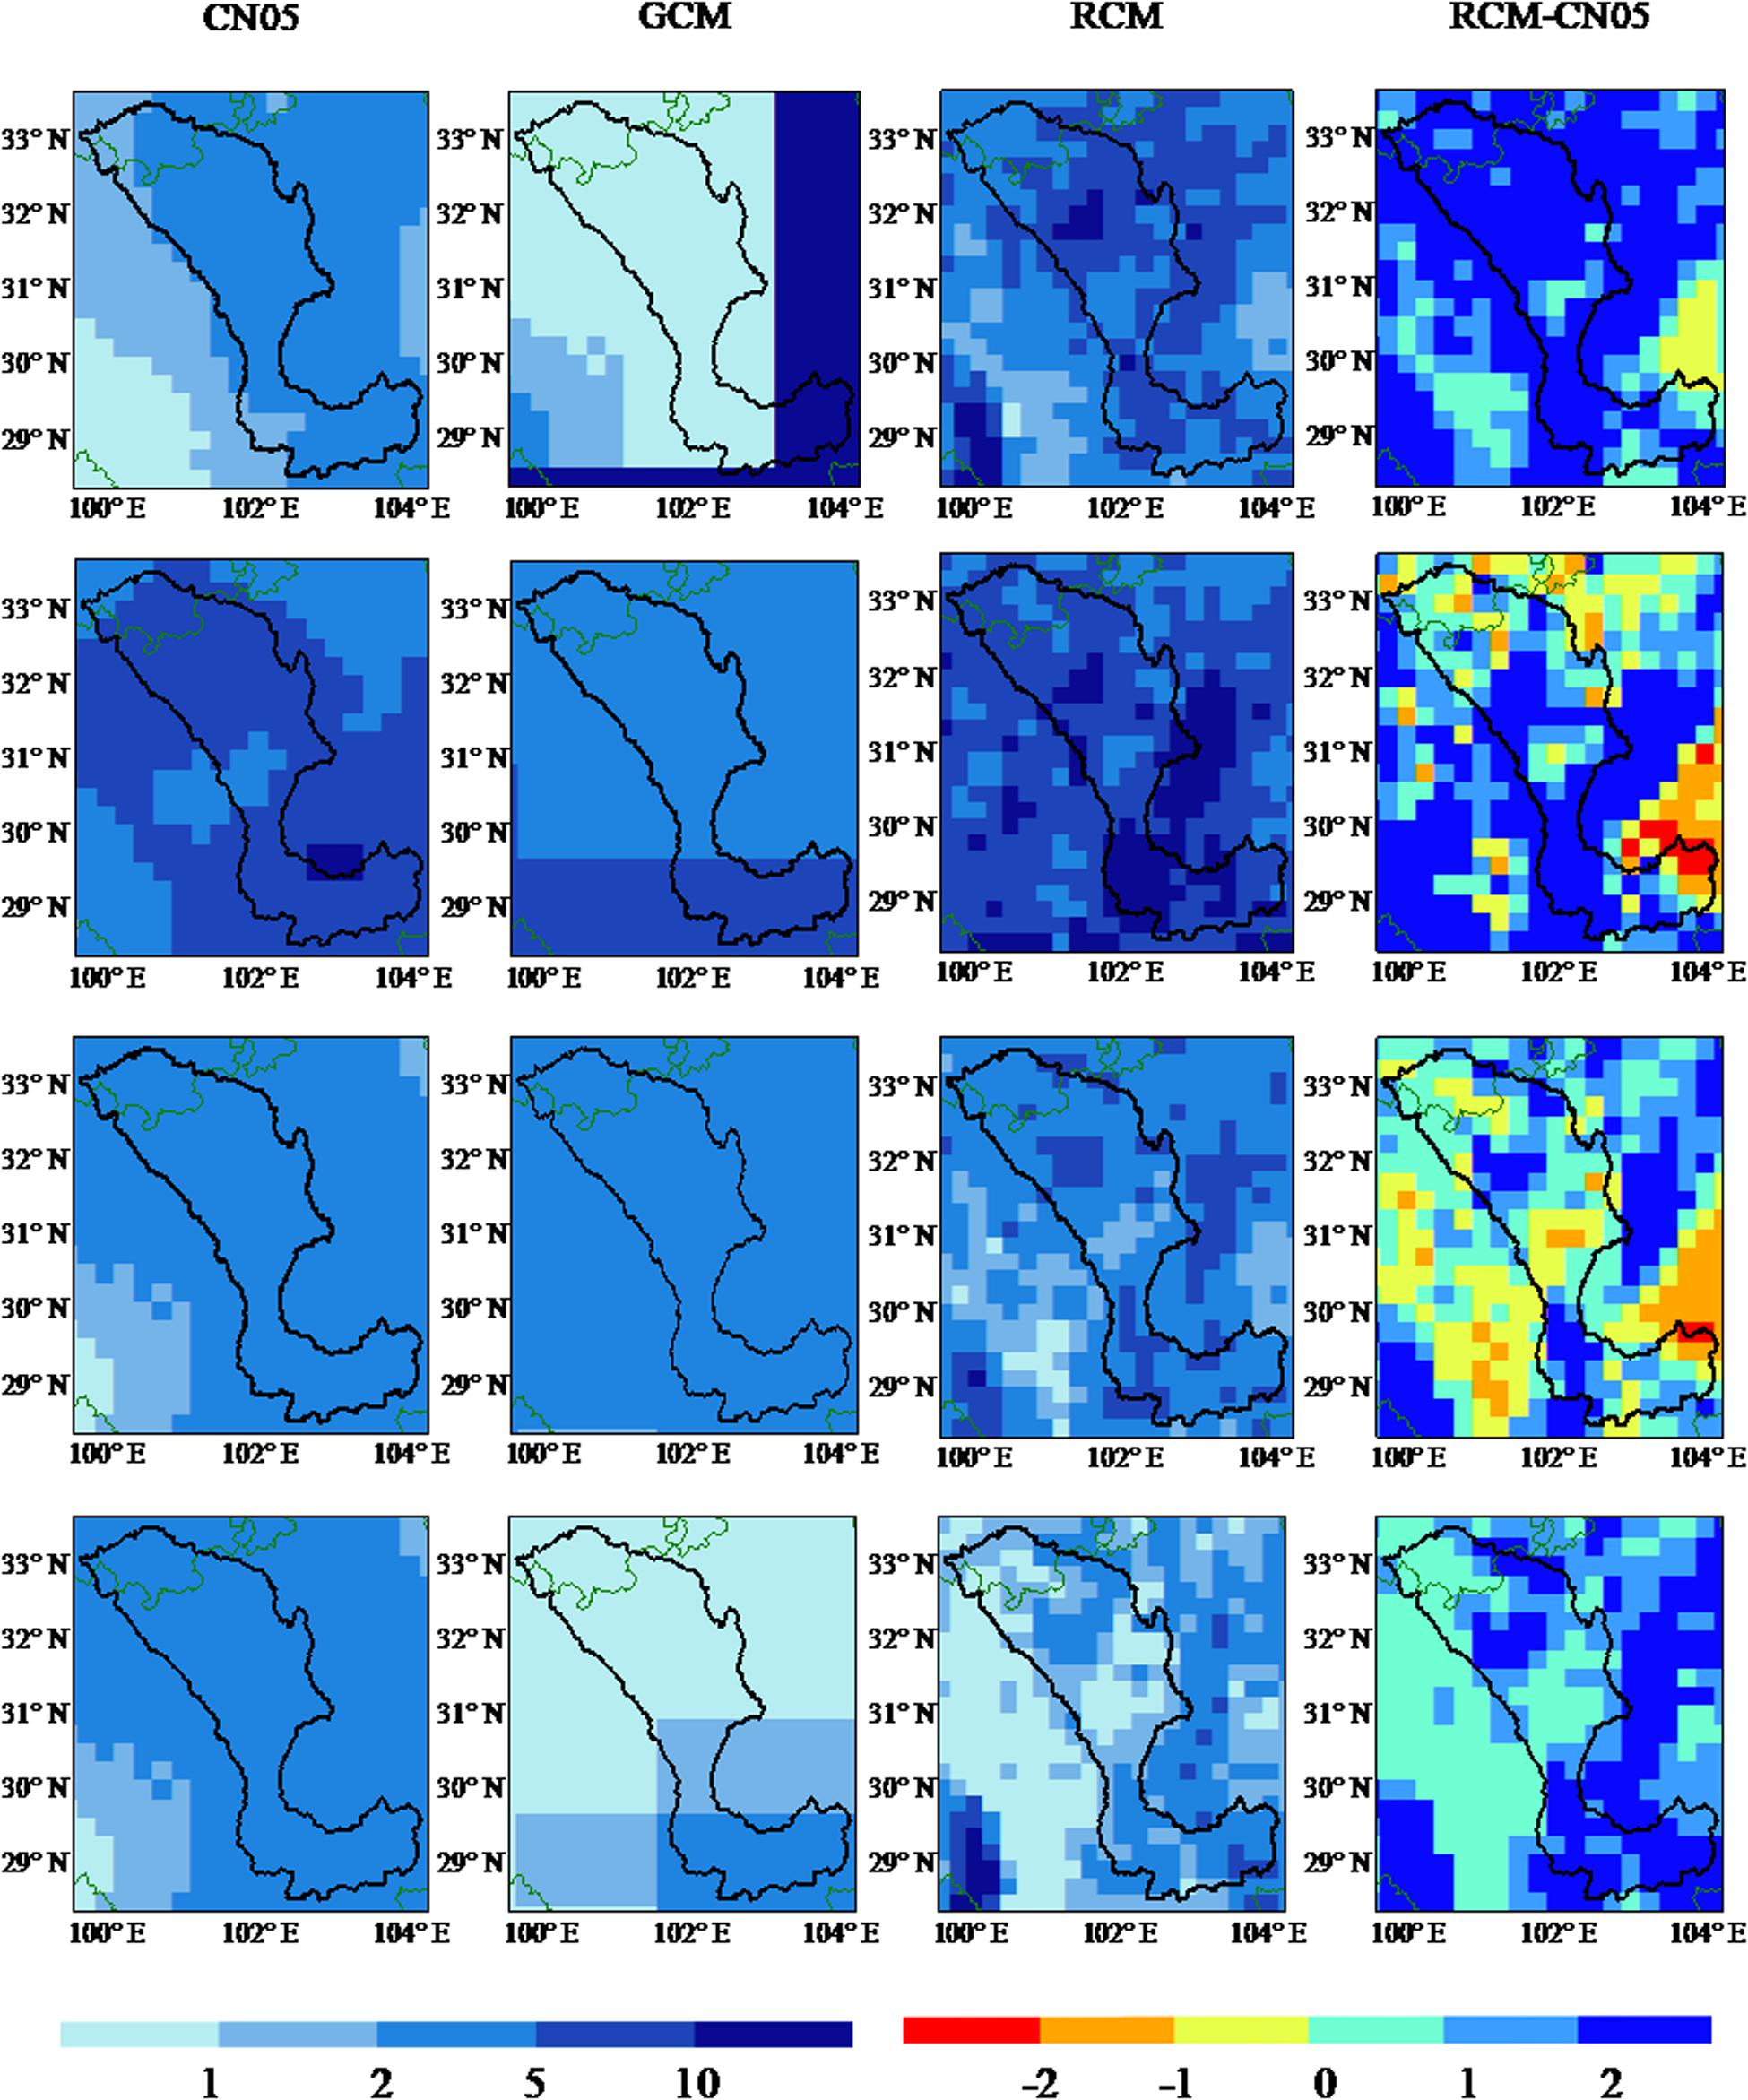
Figure 6. Simulation results and deviation of difference scale models in each season.
Figure 7 shows simulation results in annual cycle obtained from GCM and PRECIS. Compared to CN05, PRECIS can simulate the monthly precipitation in Dadu River Basin reasonably. For example, the highest precipitation occurs in June, while the precipitation in January is smaller. Meanwhile, PRECIS shows a great advantage in simulating the monthly mean precipitation relative to its driving GCM. Lots of overestimations in HadGEM2-ES (especially from May to October) are corrected by PRECIS in dynamic downscaling. Overall, the bias of RCM is kept between −0.34 and 3.67 mm, especially in August (∼−0.34 mm).
FIGURE 7
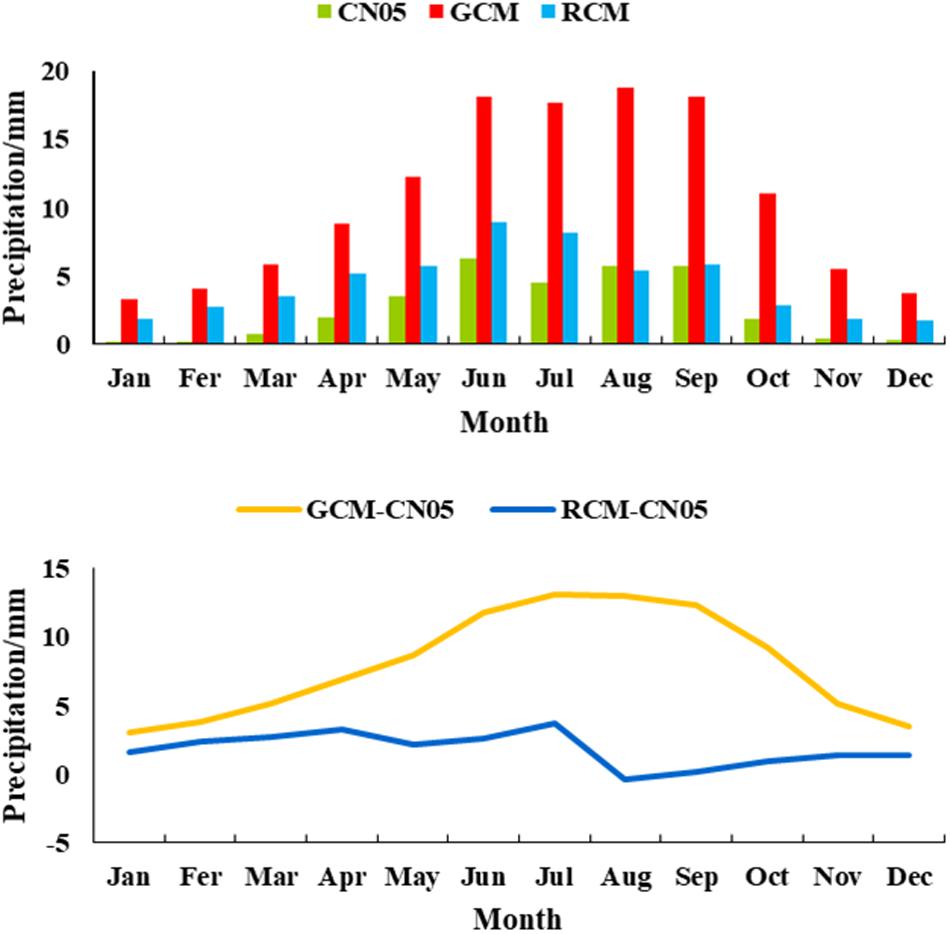
Figure 7. Monthly mean precipitation and deviation of different scale models and observation data.
Figure 8 is the comparison results between simulation and observation in precipitation data at different spatial scales. The higher in resolutions for climate model, the simulation trend and value of precipitation are closer to the observed data. Specifically, comparing to observation, the simulation results of GCM are overestimated obviously, especially in June or Neutral I, the error is even exceeding 20 mm/day. While the results downscaled by PRECIS have numerous improvements relative to its GCM. However, PRECIS still cannot solve effectively the accuracy in simulating station-scale precipitation. For example, the error is still high in June (about 10 mm) and in Neutral I (about 8 mm). On the other hand, the results from SCA statistical downscaling show the best performance than other simulations. The simulated precipitation is consistent with the observation well. The errors in GCM and PRECIS are reduced greatly, particularly in August and Dry II.
FIGURE 8
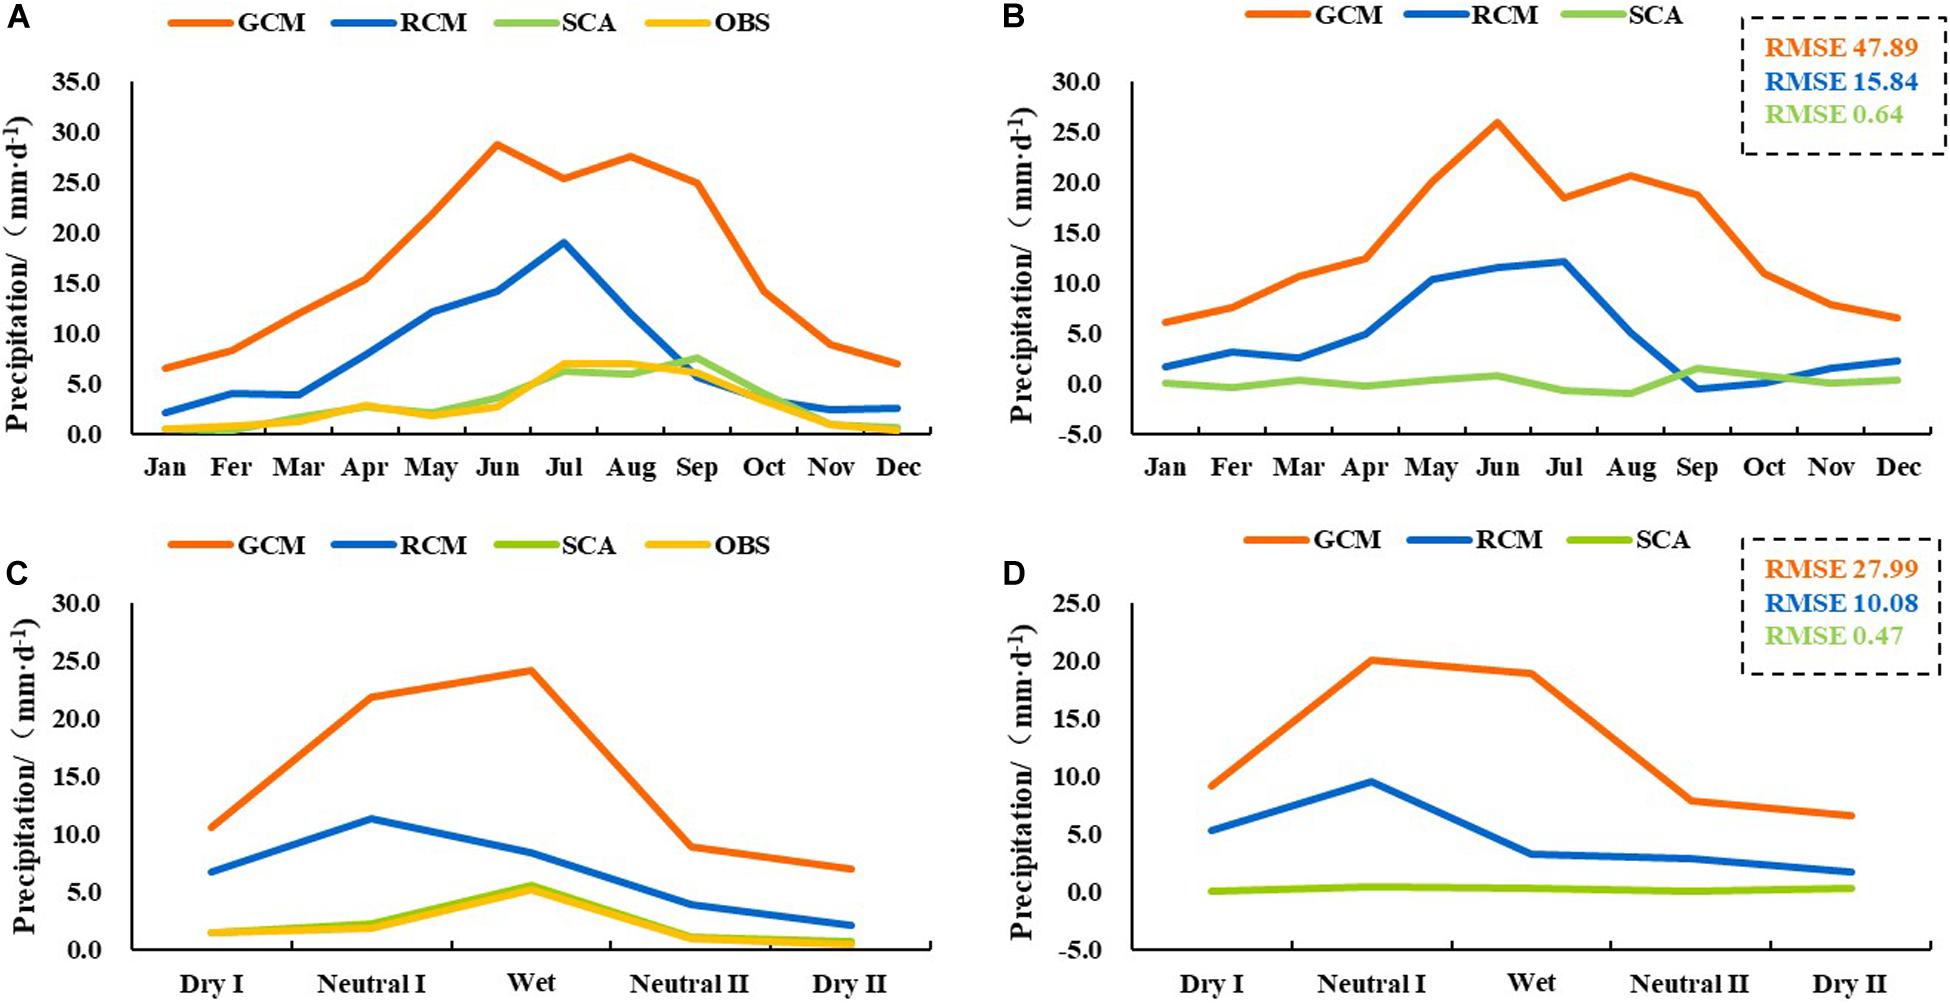
Figure 8. Comparison of precipitation simulation and observed data in different scale models: (A) monthly precipitation; (B) monthly precipitation error; (C) precipitation in period; (D) precipitation error in period.
In terms of the correlations between simulations and observation, SCA downscaling also show its advantage, with a correlation coefficient (about 0.97) and low RMSE value (about 0.16), meaning that there is a great fitting degree and lower biases between the results and observation (Figure 9). Moreover, with the improvement of resolution, the decrease of RMSE is more pronounced. For example, the RMSE is about 68.9 mm/day in July for GCM and about 10.2mm/day for PRECIS, while the RMSE of SCA statistical downscaling is only about 0.5 mm/day. In addition, the RMSEs are different in periods and SCA shows a better performance (∼ 0.16 mm/day) in Dry II periods than that in other periods.
FIGURE 9
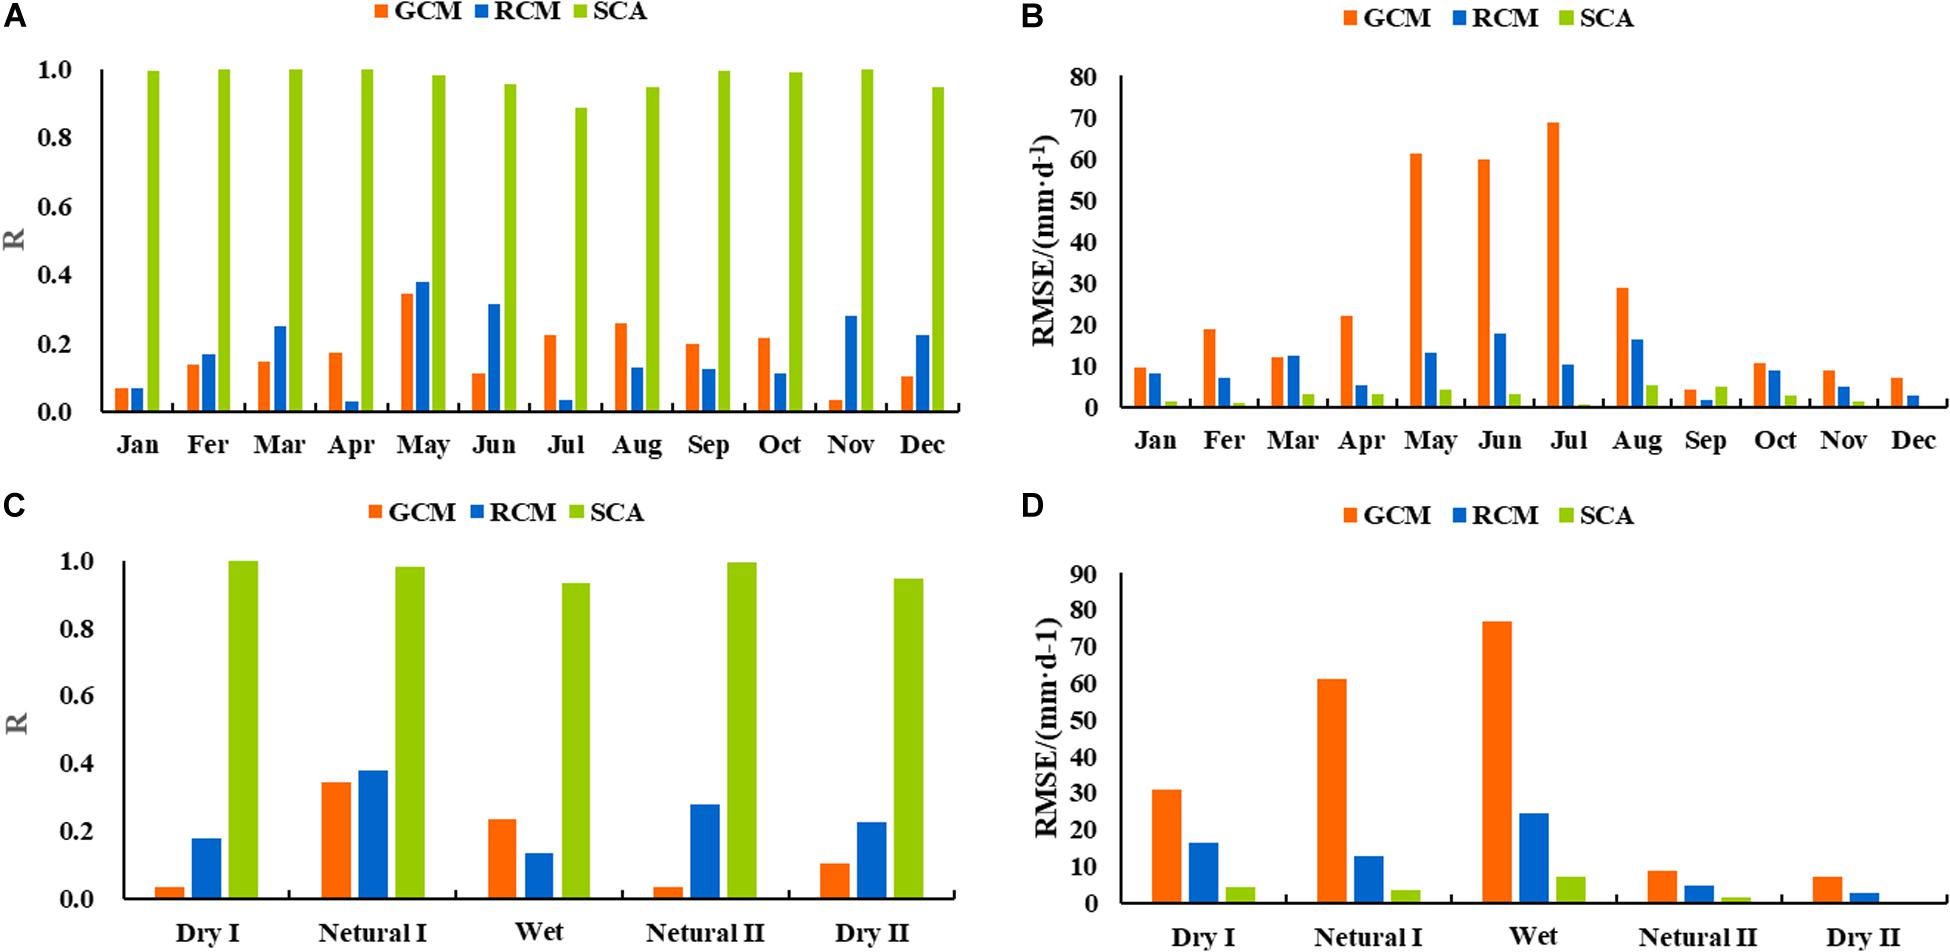
Figure 9. Verification of precipitation simulation and observed data in different scale models: (A) monthly correlation coefficient; (B) monthly RMSE; (C) correlation coefficient in period; (D) RMSE in period.
Overall, compared with coarser-resolution climate models, the simulation results of SCA statistical downscaling can reasonably reproduce the precipitation trend and value. Thus, these results can be used as the input of a subsequent power forecasting model to simulate the power generation of hydropower stations.
Then, through the HRMDP model, we compare the simulated power generation and actual power generation in different months and periods for Station A, which is shown in Figure 10. Overall, the performance in correlation coefficients and RMSE values are quite satisfactory especially from May to July, which are 0.85 and 232 kWh respectively. The simulation results demonstrate a great performance in Wet period, and the correlation coefficients and RMSE values in different periods are 0.95 and 611 kWh, respectively.
FIGURE 10
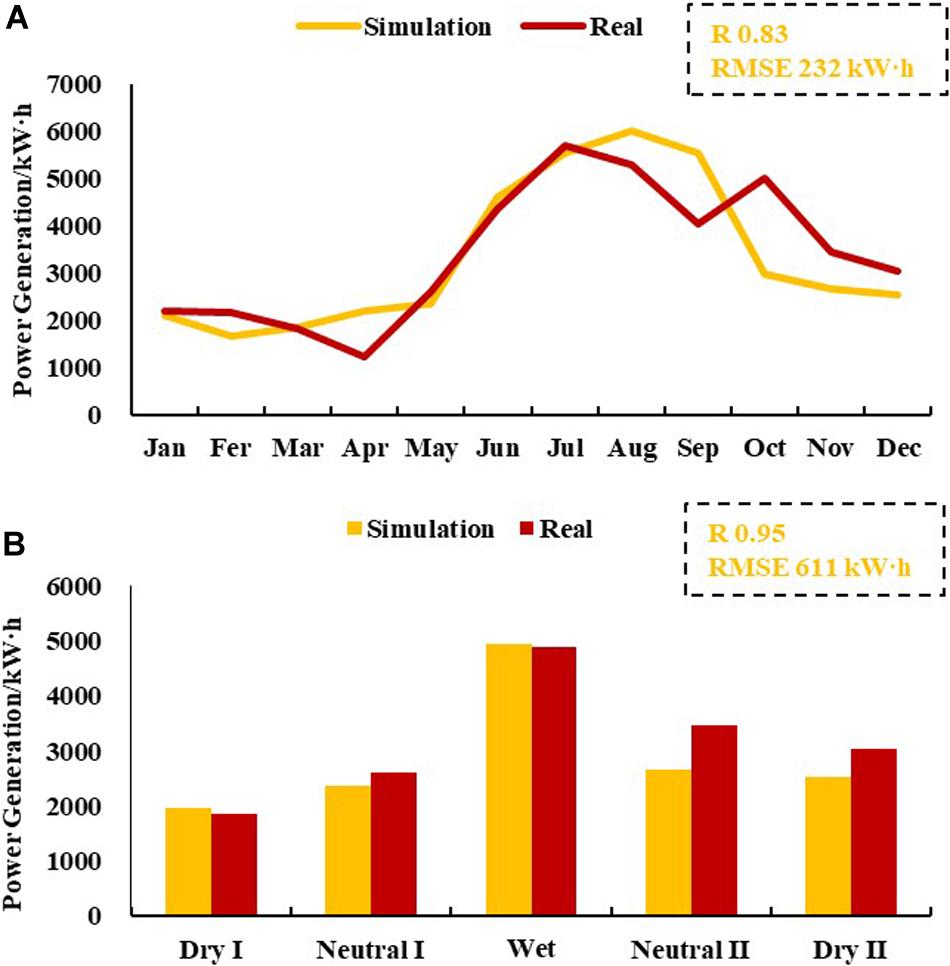
Figure 10. Simulation power generation compare with actual power generation: (A) monthly power generation; (B) power generation in period.
Future Forecasting
The projection in precipitation is the first step to forecast the future power generation through the HRMDP model. The future precipitation and percentage change through SCA downscaling in annual cycle and different periods are shown in Figure 11. Compared with the historical period, the projected precipitation in annual cycle shows different change trends. Specifically, precipitation will increase by about 20–80% from May to July, while it will decrease in other months. For different periods, precipitation will increase in Neutral I and Wet, which are 79 and 4% respectively. The projected precipitation in other periods shows a decreasing trend, particularly in Neutral II (about 58%).
FIGURE 11
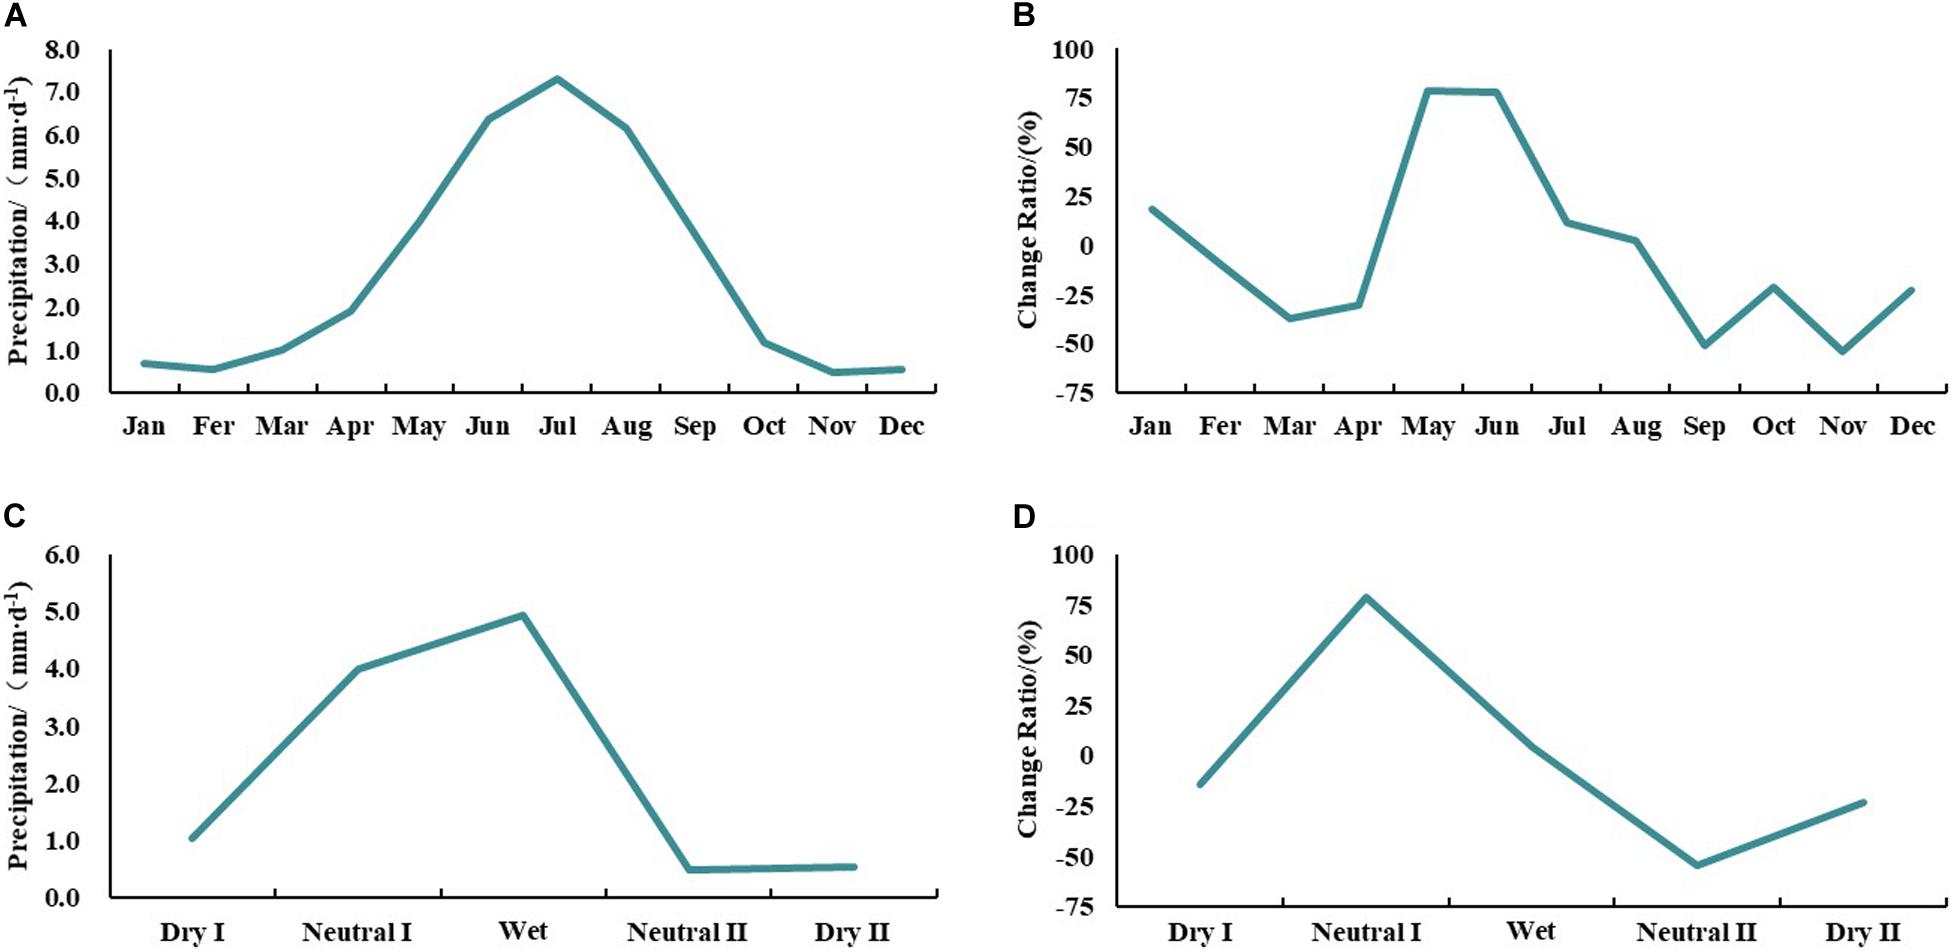
Figure 11. Future precipitation forecasting: (A) future monthly precipitation; (B) monthly precipitation change; (C) future precipitation in period; (D) precipitation change in period.
The changes in power generation resulting from the precipitation changes in station A in the future are shown in Figure 12. Compared with the historical period, there is an ascending trend in power generation in station A from January to February and May to July in the future, especially in February with the most increase by about 25%. However, in the rest months, there is a decreasing trend in power generation in station A, for example, the decrease in September will be 36%. Similarly, the power generation will increase by about 20% in future Neutral I period, while there is no obvious change in other three periods relative to the historical period.
FIGURE 12
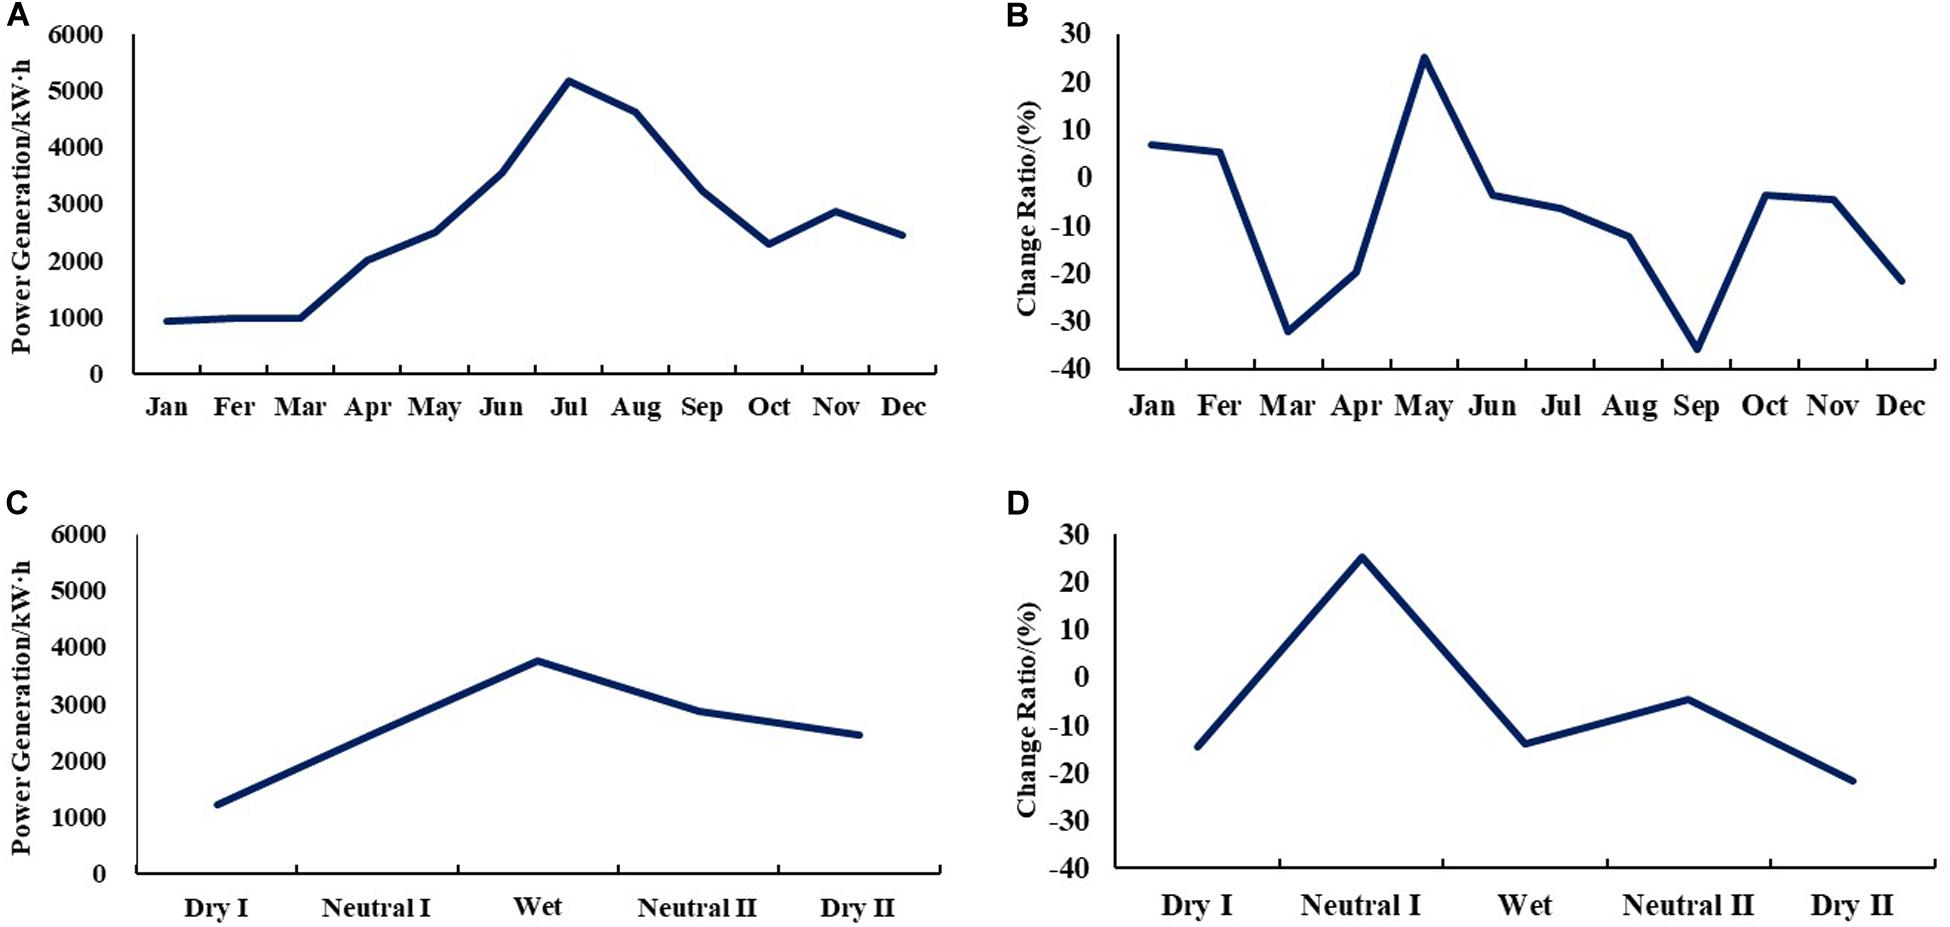
Figure 12. Future power generation change: (A) future monthly power generation; (B) monthly power generation change; (C) future power generation in period; (D) power generation change in period.
It is noted that there is more power generation in September in tradition, but the decrease in future precipitation will lead to a decrease in power generation in this month. On the other hand, though the power generation is less in May in the historical, the value will increase because of the increased precipitation in future. In addition, the peak of the generation will change from July to August, and the value will decrease about 8%. Meanwhile, the peak period of power generation will be shortened from June to August, because of the influence of precipitation.
Conclusion and Discussion
In this paper, based on the results from HadGEM2-ES and PRECIS climate models, the precipitation and power generation in power station A over Dadu River basin in China were simulated and projected using SCA statistical downscaling. The results from SCA downscaling show a great performance relative former climate models in simulating the precipitation at station scale. On the other hand, we used the observed meteorological and hydropower data in station A to establish a HRMDP. Meanwhile, we also validated the performance of HRMDP, and the results show that the HRMDP model can reflect the relationship between the precipitation and power generation, with the correlation coefficient of 0.95 and RMSE of 611 kWh.
In future, the precipitation of station A is projected an ascending trend from May to July while it will decrease in other months. For different periods, the precipitation will increase in Neutral I and Wet, but it will decrease in other periods. As the response from precipitation, the power generation will also show a similarly trend. There is an increasing trend in power generation in station A from January to February and May to July, while there is a decreasing trend in other months. For different periods, the power generation in Neutral I will increase by about 20% in future, while there is no obvious change in other three periods relative to the historical period.
Climate change has a great impact on precipitation, which affects hydropower generation. Therefore, it is of great significance to study the future precipitation change and power generation forecasting model of hydropower station to adapt climate change. As far as we know, there are many studies on future precipitation changes using climate models, but relatively few on hydropower generation forecasting model. For example, for precipitation, future climate change will lead to a general increase in precipitation over the most regions of China (Lin and Zhou, 2015; Zhao et al., 2019). Future precipitation of Dadu river basin in our study also shows an increase trend, which is consistent with other similar basins (Zhang J. et al., 2013; Zheng et al., 2017). In addition, although there are many researches on power generation forecasting methods, which focus on the runoff forecast, there are few studies on hydropower generation forecasting directly. For example,Cheng et al. (2013) used linear trend estimation method, Morlet wavelet transform and Kendall rank correlation method to forecast future runoff over the Dadu river basin, and shows that runoff will appear an increase trend. Our results show that hydropower generation has an increase trend in the future, which means the increase of precipitation will lead to increase of runoff, and further promote the increase of hydropower generation. The results can provide some decision support for future water resources management in Dadu river basin, especially for the planning and operation of hydropower stations.
Data Availability Statement
The datasets generated for this study are available on request to the corresponding author.
Author Contributions
LW, LJ, and GJ conceived and designed the research, collected the data, and performed the data analyses and manuscript preparation. LW, LJ, GJ, and BZ formulated the optimization model. LW, LJ, GJ, and FL wrote the manuscript. LW, GJ, and HB gave the comments and helped to revise the manuscript. All authors contributed to the article and approved the submitted version.
Funding
This research was supported by the National Key Research and Development Plan (2018YFE0196000), Natural Sciences Foundation (51190095), and the 111 Project (B14008).
Conflict of Interest
The authors declare that the research was conducted in the absence of any commercial or financial relationships that could be construed as a potential conflict of interest.
References
Ali, S. A., Aadhar, S., Shah, H. L., and Mishra, V. (2018). Projected increase in hydropower production in india under climate change. Sci. Rep. 8:12450.
Arnette, A. N. (2017). Renewable energy and carbon capture and sequestration for a reduced carbon energy plan: An optimization model. Renew. Sustain. Energy Rev. 70, 254–265. doi: 10.1016/j.rser.2016.11.218
Bellouin, N., Rae, J., Jones, A., Johnson, C., Haywood, J., and Boucher, O. (2011). Aerosol forcing in the Climate Model Intercomparison Project (CMIP5) simulations by HadGEM2-ES and the role of ammonium nitrate. J. Geophys. Res. 116, 2020610–2021029.
Berghuijs, W. R., Woods, R. A., and Hrachowitz, M. (2014). A precipitation shift from snow towards rain leads to a decrease in streamflow. Nat. Climate Change 4, 583–586. doi: 10.1038/nclimate2246
Chen, J., Brissette, F. P., and Leconte, R. (2011). Uncertainty of downscaling method in quantifying the impact of climate change on hydrology. J. Hydrol. 401, 190–202. doi: 10.1016/j.jhydrol.2011.02.020
Cheng, K., Zhou, D., Li, M., and Zhan, W. (2013). Characteristic analysis of precipitation and runoff in Daduhe River in Last 51 Years. Water Resour. Power 31:5-8+240.
Chilkoti, V., Bolisetti, T., and Balachandar, R. (2017). Climate change impact assessment on hydropower generation using multi-model climate ensemble. Renew. Energy 109, 510–517. doi: 10.1016/j.renene.2017.02.041
Chu, S., and Majumdar, A. (2012). Opportunities and challenges for a sustainable energy future. Nature 488, 294–303. doi: 10.1038/nature11475
CREO (2018). China Renewable Energy Outlook 2018. Available online at: http://boostre.cnrec.org.cn/wp-content/uploads/2018/11/China-Renewable-Energy-Outlook-2018-Folder_ENG.pdf (accessed December 23, 2018).
Duan, K., and Mei, Y. (2013). A comparison study of three statistical downscaling methods and their model-averaging ensemble for precipitation downscaling in China. Theor. Appl. Climatol. 116, 707–719. doi: 10.1007/s00704-013-1069-8
Guo, J., Huang, G., Wang, X., Li, Y., and Lin, Q. (2017a). Dynamically-downscaled projections of changes in temperature extremes over China. Climate Dyn. 50, 1045–1066. doi: 10.1007/s00382-017-3660-7
Guo, J., Huang, G., Wang, X., Li, Y., and Lin, Q. (2017b). Investigating future precipitation changes over China through a high-resolution regional climate model ensemble. Earth’s Future 5, 285–303. doi: 10.1002/2016ef000433
Guo, J., Huang, G., Wang, X., Li, Y., and Yang, L. (2018). Future changes in precipitation extremes over China projected by a regional climate model ensemble. Atmospher. Environ. 188, 142–156. doi: 10.1016/j.atmosenv.2018.06.026
Hui, P., Tang, J., Wang, S., Niu, X., Zong, P., and Dong, X. (2018). Climate change projections over China using regional climate models forced by two CMIP5 global models. Part II: projections of future climate. Int. J. Climatol. 38, e78–e94. doi: 10.1002/joc.5409
Jiang, Z., Li, R., Li, A., and Ji, C. (2018). Runoff forecast uncertainty considered load adjustment model of cascade hydropower stations and its application. Energy 158, 693–708. doi: 10.1016/j.energy.2018.06.083
Jones, C. D., Hughes, J. K., Bellouin, N., Hardiman, S. C., Jones, G. S., Knight, J., et al. (2011). The HadGEM2-ES implementation of CMIP5 centennial simulations. Geosci. Model Dev. 4, 543–570. doi: 10.5194/gmd-4-543-2011
Kerkhoff, C., Künsch, H. R., and Schär, C. (2014). Assessment of Bias assumptions for climate models. J. Climate 27, 6799–6818. doi: 10.1175/jcli-d-13-00716.1
Li, Y., and Yan, X. (2017). Statistical downscaling of monthly mean temperature for Kazakhstan in Central Asia. Climate Res. 72, 101–110. doi: 10.3354/cr01456
Lin, R., and Zhou, T. (2015). Reproducibility and future projections of the precipitation structure in east asia in four chinese gcms that participated in the CMIP5 experiments. Chin. J. Atmosph. Sci. 39, 338–356.
Liu, X., Tang, Q., Voisin, N., and Cui, H. (2016). Projected impacts of climate change on hydropower potential in China. Hydrol. Earth Syst. Sci. 20, 3343–3359. doi: 10.5194/hess-20-3343-2016
Liu, Z., Xu, Z., Charles, S. P., Fu, G., and Liu, L. (2011). Evaluation of two statistical downscaling models for daily precipitation over an arid basin in China. International J. Climatol. 31, 2006–2020. doi: 10.1002/joc.2211
Panwar, N. L., Kaushik, S. C., and Kothari, S. (2011). Role of renewable energy sources in environmental protection: A review. Renew. Sustain. Energy Rev. 15, 1513–1524. doi: 10.1016/j.rser.2010.11.037
Perkins, S. E., Pitman, A. J., Holbrook, N. J., and McAneney, J. (2007). Evaluation of the AR4 Climate Models’ Simulated Daily Maximum Temperature, Minimum Temperature, and Precipitation over Australia Using Probability Density Functions. J. Climate 20, 4356–4376. doi: 10.1175/jcli4253.1
Saini, R., Wang, G., Yu, M., and Kim, J. (2015). Comparison of RCM and GCM projections of boreal summer precipitation over Africa. J. Geophys. Res. 120, 3679–3699. doi: 10.1002/2014jd022599
Wang, X., Huang, G., Lin, Q., Nie, X., and Liu, J. (2015). High-resolution temperature and precipitation projections over Ontario. Canada: a coupled dynamical-statistical approach. Q. J. R. Meteorol. Soc. 141, 1137–1146. doi: 10.1002/qj.2421
Wasko, C., and Sharma, A. (2017). Global assessment of flood and storm extremes with increased temperatures. Sci. Rep. 7:7945.
Wood, A. W., Leung, L. R., Sridhar, V., and Lettenmaier, D. P. (2004). Hydrologic implications of dynamical and statistical approaches to downscaling climate model outputs. Clim. Change 62, 189–216. doi: 10.1023/b:clim.0000013685.99609.9e
Xu, Y., Gao, X., Shen, Y., Xu, C., Shi, Y., and Giorgi, F. (2009). A daily temperature dataset over China and its application in validating a RCM simulation. Adv. Atmosph. Sci. 26, 763–772. doi: 10.1007/s00376-009-9029-z
Yang, C., Wang, N., Wang, S., and Zhou, L. (2016). Performance comparison of three predictor selection methods for statistical downscaling of daily precipitation. Theor. Appl. Climatol. 131, 43–54. doi: 10.1007/s00704-016-1956-x
Yang, Y., Tang, G., Lei, X., Hong, Y., and Yang, N. (2017). Can satellite precipitation products estimate probable maximum precipitation: a comparative investigation with gauge data in the dadu river Basin. Remote Sens. 10:41. doi: 10.3390/rs10010041
Zhang, D.-L., Lin, Y., Zhao, P., Yu, X., Wang, S., Kang, H., et al. (2013). The Beijing extreme rainfall of 21 July 2012: “Right results” but for wrong reasons. Geophys. Res. Lett. 40, 1426–1431. doi: 10.1002/grl.50304
Zhang, J., Luo, L., Han, X., and Zhang, C. (2013). Simulation and Prediction of annual Precipitation in the Yangtze River Basin by CMIP5 model. Guizhou Meteorological Society. Guizhou Meteorological Society: Guizhou Association for Science and Technology, 2013:6.
Zhang, Z., and Xu, J. (2014). Applying rough random MODM model to resource-constrained project scheduling problem: A case study of Pubugou Hydropower Project in China. KSCE J. Civil Eng. 18, 1279–1291. doi: 10.1007/s12205-014-0426-1
Zhao, Y., Xiao, D., and Pai, H. (2019). Projection and application for future climate in china by CMIP5 climate model. Meteorol. Sci. Technol. 47, 608–621. doi: 10.1002/joc.5409