S.Kadhiravan
Email: kadhiravansivasamy@gmail.com
Severity: Warning
Message: session_start(): open(/home/siftdesk.org/tmp/sess_jd5ktc1ad7k9jnh6i4p8a1nepc, O_RDWR) failed: Disk quota exceeded (122)
Filename: controllers/Home.php
Line Number: 44
Backtrace:
File: /home/siftdesk.org/public_html/application/controllers/Home.php
Line: 44
Function: session_start
File: /home/siftdesk.org/public_html/index.php
Line: 316
Function: require_once
Severity: Warning
Message: session_start(): Failed to read session data: files (path: /home/siftdesk.org/tmp)
Filename: controllers/Home.php
Line Number: 44
Backtrace:
File: /home/siftdesk.org/public_html/application/controllers/Home.php
Line: 44
Function: session_start
File: /home/siftdesk.org/public_html/index.php
Line: 316
Function: require_once
© 2019 Sift Desk Journals. All Rights Reserved
VOLUME: 2 ISSUE: 1
Page No: 125-134
S.Kadhiravan
Email: kadhiravansivasamy@gmail.com
S.Kadhiravan, K.Krishnasamy, K. Murugaiah, R. Venkatachelam, S.Sivajiganesan
aPG and Research Department of chemistry, AVVM Sri Pushpam College Poondi Thanjavur, Tamilnadu India
S.KADHIRAVAN, BIOLOGICAL STUDIES, SYNTHESIS, STRUCTURAL, SPECTRAL CHARACTERIZATION AND CO-ORDINATE Mn (II), Fe (II), Zn (II) (II) COMPLEXES CONTAINING 2-HYDROXY-1-NAPHTHALDEHYDEAND N,N
A new Manganese (II), Iron (II), Zinc (II), complex, has been and characterized by elemental analysis, UV-Vis, FT-IR and Binding of this Mn (II), Fe (II), Zn (II) complex with calf thymus DNA was investigated by UV-Visible absorption, fluorescence spectroscopy techniques. The intrinsic binding constants Kb of complex with CT-DNA, BSA obtained from UV-Vis absorption studies were 1.75X105,1.98X105and2.38X105M-1.
Keywords: Mn (II), Fe (II), Zn (II) complexes, DNA and BSA Binding
Metal chelates are capable to tolerate their antitumor effects by binding to DNA. DNA binding alters the replication of DNA by inhibiting the growth of the tumor cells, which is the basis of designing new and more effective antitumor drugs. Among the DNA binding modes, intercalation is the most significant one because it always leads to cellular degradation [1]. Intercalation is the insertion of small molecules between stacked base pairs of the double helix structure of DNA. It leads to subsequent disruption of base stacking in the double helix by creating interference in hydrogen bonding or van der Waals interactions and results in the destabilization of double helix conformation of DNA. Thus, the consequence of intercalation include inhibition of transcription, prevention of DNA synthesis, structural changes of DNA,
Disturbances in cellular processes and finally cell death. More consideration has been paid on DNA intercalation, since the other DNA binding need more investigation for structure-function relationship. The groove binders along with intercalators can also be used for the treatment of bacterial, fungal infections and cancer. Overall, compounds bearing antioxidant activity have been found to possess anticancer, anti-inflammatory, anti-hypertensive and many other biological activities [2, 3] the biological aspects of metallic ligands depend upon the ease of cleaving the bond between the metal ion and the ligand. It is well known that the metals present in complexes generally accelerate the drug action and the efficacy of therapeutic agents and that the pharmacological efficiencies of drug-based metal complexes depend upon the nature of the metal ion and the ligands [4]. The present work is the continuation of our previously reported work to obtain some novel complexes where the 4-chlorophenyl and 4-methoxyphenyl substituted 4-hydroxycumarin azo-analogues are conjugated with different transitional metals with an intention to produce target molecules possessing good antimicrobial properties [5,6]..
Synthesis of complexes
[Mn (L1).NCS] (1)
To a solution of 2-hydroxy-1-naphthaldehyde (0.144 g, 0.84mmol) in methanol (10 ml), sodium hydroxide (0.03 g, 0.84mmol) was added and the resulting solution was stirred for 15 min at room temperature. CoCl2.6H2O (0.20 g, 0.84mmol) in methanol (10 ml) followed by N, N’-dimethyl-1, 3-propanediamine (0.08 g, 0.84mmol) in methanol (10 ml) were added to the solution. To the reaction mixture ammonium thiocyanate (0.081 g, 0.84 mmol) are added, followed by stirring for 3 h. The black colored precipitate that formed. Yield: 59 %; m.p. 143 °C (dec).Anal. Calc. (%) for C14H19N3MnOS: C, 54.84; H, 5.14; N, 11.29; S, 8.61. Found (%): C, 54.58; H, 5.32; N, 11.06; S, 8.40. FT-IR (KBr, ν, cm–1 spectrum peaks: 3417br, 2928s, 2818s, 2065s, 1617s, 1541s, 1506s, 1437s, 1393s, 1361s, 1340s, 1309s, 1258s, 1192s, 1160s, 1143s, 1054s, 976s, 862s, 827s, 751s, 653s, 525s, 516s, 505s (br, broad; s, sharp). UV-Vis in DMF [λmax/nm (εmax/ mol-1 cm-1)]: 279(511), 364(3040), 395(26), 664(2). ESI-MS (CH3OH) m/z (%): 378(38%).Conductivity (ΛM/S cm2 mol-1) in DMF: 11.
The complexes [Fe(L1).NCS] (2) and [Zn(L1).NCS] (3) were synthesized by following the above procedure using cobaltous chloride instead of using Zinc chloride (1.99 g, 0.84 mmol) and Iron chloride (0.14 g), respectively.
[Fe (L1).NCS] (2)
Brown colour solid. Yield: 55 %. (0.17g). m.p. 148 °C (dec).Anal. Calc. (%) for C14H19N3FeOS: C, 54.87; H, 5.15; N, 11.29; S, 8.61. Found (%): C, 58.58; H, 5.33; N, 11.06; S, 8.41. FT-IR (KBr, ν, cm–1spectrum peaks: 3411br, 2095s, 1618s, 1570s, 1538s, 1507s, 1484s, 1456s, 1446s, 1418s, 1394s, 1362s, 1342s, 1252s, 1215s, 1189s, 1156s, 1140s, 1094s, 1053s, 1026s, 966s, 860s, 830s, 752s, 711s, 652s, 584s, 578s, 572s (br, broad; s, sharp). UV-Vis in DMF [λmax/nm (εmax/ mol-1 cm-1)]: 270(237), 338(3630), 358(3900), 425(2505), 645 (75). ESI-MS (CH3OH) m/z (%): 378(15%) [M+]. Conductivity (ΛM/S cm2 mol-1) in DMF: 14.
[Zn (L1).NCS] (3)
The white colored precipitate that formedwas DMF and kept for crystallization. Fivedays later rod- shaped green crystals are obtained. Yield: 61%. (0.18g). m.p. 143 °C (dec).Anal. Calc. (%) for C34H38Zn2N6O2S2: C, 54.18; H, 5.04; N, 11.15; S, 8.51. Found (%): C, 53.12; H, 5.22; N, 10.92; S, 8.30. FT-IR (KBr, ν, cm–1spectrum peaks: 3388br, 3055s, 2943s, 2916s, 2054s, 1632s, 1540s, 1508s, 1445s, 1437s, 1425s, 1354s, 1334s, 1306s, 1216s, 1180s, 1137s, 1102s, 1083s, 1060s, 1035s, 975s, 931s, 857s, 822s, 688s, 647s, 607s, 530s, 511s, 465s, 459s (br, broad; s, sharp). UV-Vis in DMF [λmax/nm (εmax/ mol-1 cm-1)]: 229(431), 267(862), 385(611), 634(6). ESI-MS (CH3OH) m/z (%): 382(28%) [M+]. Conductivity (ΛM/S cm2 mol-1) in DMF: 15.
FT-IR andUV-Vis spectroscopy
The infrared spectrum of the ligand showed strong band at 3390cm-1which are due to the v (NH) for complex 2. Thus, the v (C=N) band of the ligand was observed at 1648 and 1656cm-1.Furthermore, the complexes exhibited weak bands between 532 – 558cm-1 which are attributed oν(M-N). However, the spectrum of the ligand showed strong band at 1511 and 1496cm-1 which attributed to ν(C=O). While, the ν(C-O) appeared at 1062 and 1120cm-1 in the spectra of the free ligand. Moreover, the spectra of the complexes exhibited weak bands between 435-480 cm-1which is attributed to the ν(M-O) [7](Fig. 1).The electronic spectrum of complexes (Fig.2) bands at 266–289-*transition and 314 – 396nm due to then→π* transition of the complexes and while the visible region show a weak peaks at 536 and 599 dueto thed-d transition 3A2g→ 3T2g for Ni+2 complex [8].
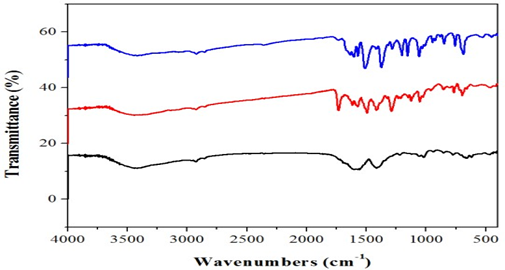
Fig. 1.FT-IR spectraofcomplexes1 &3.
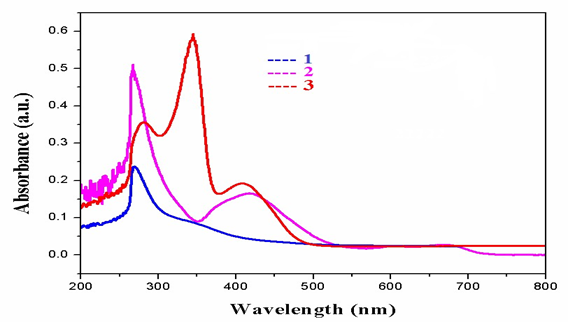
Fig. 2.UV-Vis spectraofcomplexes1&3.
Electrochemical studies
The electrochemical behavior of the complexes has been studied using cyclic voltammetry with potential the range of 0 to -1.2V for copper (II) complexes in dimethyl form amide containing 10-1M tetra (n-butyl) ammonium pre chlorate. Cyclic voltammograms for all copper (II) and complexes (scanrate 50mVs-1) are displayedinFig.3. The quasi-reversible reduction wave at -1.0902 and -0.8777 V for complexes 1 &2 respectively.
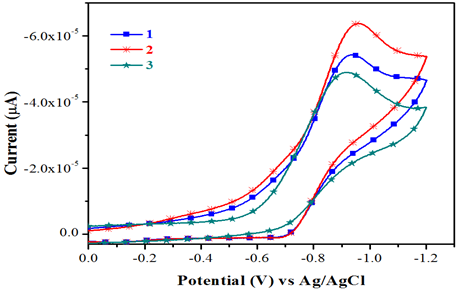
Fig.3.Cyclicvoltammograms of complexes1&3.
UV–Vis absorption spectral studies
Electronic absorption spectroscopy is an efficient method to examine the binding mode of DNA with metal complexes. The absorption spectra of complexes 1–3 were recorded for a fixed concentration of free metal complex with increasing concentrations of CTDNA. DNA is the essential carrier of genetic information which was concerned with most cancers resulting from DNA damage; therefore, DNA binding is one of the most critical steps for the action of a large number of metal based anticancer drugs [9]. Electronic absorption spectroscopy is one of the most powerful experimental techniques for probing metal ion–DNA interactions. Binding of the macromolecule leads to changes in the electronic absorption spectrum of the metal complex. Electronic absorption spectroscopy is usually used to determine the binding strength and the mode of DNA binding with small molecules [10]. A variety of small molecules interact reversibly with DNA, primarily through three modes: (i) electrostatic interactions (ii) binding Interactions with grooves of DNA double helix; and (iii) intercalation between the stacked base pairs of native DNA [11]. The UV–Vis spectra of the complex in the presence and absence of CT-DNA were monitored over the wavelength range of 230–300 nm as shown in Fig. 4.
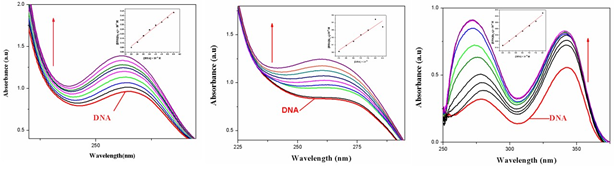
Fig.4. Absorption spectra of complexes 1-32. In5mM Tris-HCl/50mM NaCl buffer (pH 7.2). Arrow shows the changing absorbance upon increase of DNA concentration.
With increasing concentration of CT-DNA at a fixed complex concentration (1.0×10⁻⁵M), Hyperchromicity at about 275 (19%) nm for complex 1 and 278 (23%) nm for complex 2 are observed. This strong hyperchromism, along with minor blue shift (8nm) forcomplex 1 and no significant observed for complex 2 indicates strong interaction of the complex with CT-DNA mainly through groove binding [12]. It is known that the hyperchromicity of the UV absorbance band is caused by the unwinding of the double helix as well as its unstackingand the concomitant exposure of the bases; whereas, red-or blue-shift indicates that the complex may have some effect on DNA [13]. In order to compare the binding strength of the complex with CT-DNA, the intrinsic binding constants Kb are obtained by monitoring the changes in absorbance for the complex with increasing concentration of DNA. The binding constant, Kb, has been determined from the spectroscopic titration data using the equation [14].
[DNA]/(εa-εf) =[DNA/(εb-εf)]+1/Kb(εb-εr),
Where εa is the extinction coefficient to observed for the charge transfer absorption at a given DNA concentration, εf the extinction coefficient of the complex free in solution, εb the extinction coefficient of the complex when fully bound to DNA, Kb the equilibrium binding constant and [DNA] gives Kb as the ratio of the slope to the intercept. Kb is obtained from the ratio of slope to the intercept from the plots of [DNA]/(εa-εf)vs[DNA].
The Kbvalue of complex 1-3 is 1.75X10⁵, 1.98X10⁵ and 2.38X10⁵M-1 respectively. From Binding constant values, it is clear that the complexes are moderate binders and complexes show the highest binding affinity amongst them.
Fluorescent spectral studies
To understand the interaction pattern of the complex with DNA more clearly, fluorometric competitive binding experiment was carried out using ethidium bromide (EB) as a probe that shows no apparent emission intensity in buffer solution because of solvent quenching. However, EB emits intense fluorescent light in the presence of DNA due to its strong intercalation between the adjacent DNA base pairs. A competitive binding of small molecular to CT-DNA could result in the displacement of EB or quenching of the bound EB by the complex decreasing its emission intensity.
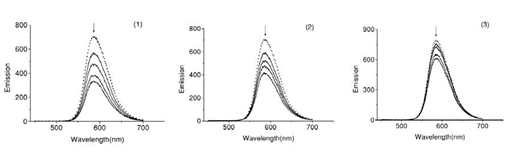
Fig.5. Fluorescence emission spectra of the EB-DNA in presence of complexes 1-3. In 5mM TrisHCl/50 mM NaCl buffer (pH7.2).
The interaction of Schiff base complexes with calf thymus DNA were studied by monitoring the changes in the extrinsic fluorescence of EB at varying concentration of the tested complex (Fig.6) Shows there preventative fluorescence emission spectra of the DNA–EB complex. The molecular fluorophore, EB, emits fluorescence in the presence of CT-DNA due to its strong intercalation between the adjacent DNA base pairs [15]. Addition of second molecules, which binds to DNA more strongly than EB, can decrease the DNA-induced EB emission [16].
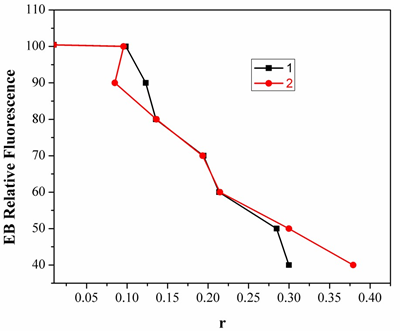
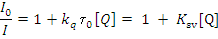
Fig.6. Plot of EB relative fluorescence intensity atλem=598nm (I/I0 (%)) vsr(r= [complex]/ [DNA]) for complexes 1 &2. in buffer solution (5 mM HCl/50mMNaClat pH 7.2).
Two mechanisms have been proposed to account for this reduction in the emission intensity: the replacement of molecular fluorophores, and/or electron transfer [17]. The addition of the complex to DNA pretreated with EB causes appreciable reduction in the emission intensity. The intensity of the emission band at 598nm of the DNA-EB system decreased (up to 14% of the EB-DNA fluorescence intensity for complex 1 and 36% for complex 2, Fig.7). This behavior can be analyzed through the Stern-Volmer equation [18],
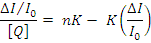
I0/I=1+Ksvr,
Where I0 and I are the fluorescence intensities in the absence and the presence of complex. Ksv is alinear Stern-Volmer quenching constant; r is the ratio of the total concentration of complex to that of DNA.
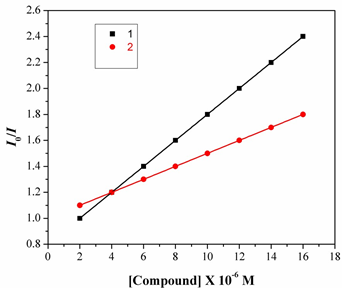
Fig.7. The Stern-Volmer plot illustrating the quenching of EB bound to DNA by complexes1 & 2. The quenching plot illustrates that the quenching of EB bound to DNA by the complex is in good agreement with the linear Stern-Volmer equation, which also indicated that the complex binds to DN In the plot of I0/Ivs [Complex]/ [DNA], Ksv is given by the ratio of the slope to intercept. From the inset in Fig.8, the Ksv value for complexes 1&2 is 2.45X10⁴ and 2.79X10⁴M1. Such a value of quenching constant suggests that the interaction of the complex with DNA isStrong [19].
BSA binding studies
Fluorescence spectroscopy is an effective method to examine the interactions between metal complexes and BSA. Here we investigated the binding affinity of the nickel (II) complexes 1&2 with BSA under physiological conditions. The effect of Ni (II) complexes 1&2 on the BSA fluorescence intensity is shown in Fig.10, from which we can see clearly that BSA had strong fluorescence emission band around 353nm by fixing the excitation wavelength that 295 nm.
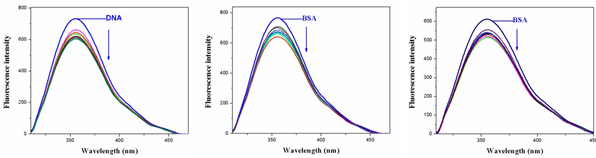
Fig.8. Fluorescence spectra of BSA in presence of various concentrations of complexes 1&3.
The addition of Ni (II) complexes to the solution of BSA resulted in the quenching of its fluorescence emission without any shift, possibly due to changes in the secondary/tertiary structure of BSA in the phosphate buffer, affecting the orientation of the tryptophan residues of BSA. Under the same experimental conditions and the BSA fluorescence spectra have been corrected before the experimental data processing [20].
Addition of complex 1 to BSA results in fluorescence intensity decrease up to 28% of the initial fluorescence intensity of BSA for complex 1 and 17% for complex 2, as calculated after the correction of the initial fluorescence spectra (Fig.11) due to possible changes in protein secondary structure of BSA indicating the binding of the complex to BSA [21]. The value of the Stem-volmer quenching constant (Ksv,M-1) and the quenching constant (kq,M-1s-2) for complex interacting with BSA as calculated by Stern-Volmer quenching equation [22-24]:
Where I0= the initial tryptophan fluorescence intensity of BSA, I= the tryptophan fluorescence intensity of BSA after the addition of the quencher, kq= the quenching rate constants of SA, Ksv= the Stern-Volmer quenching constant, t0= the average life time of BSA without the quencher, [Q]=the concentration of the quencher respectively,

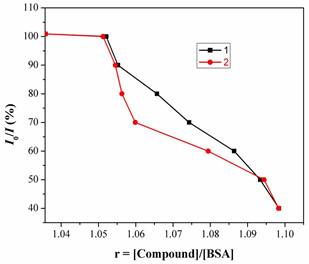
Fig.9. Plot of % relative fluorescence intensity at lem= 355nm (I/I0 (%) vsr (r= [complexes]/ [BSA]) for complexes 1 &2 in buffer solution (150 mM NaCl and 15 mM Tri sodium citrate at pH 7.4).
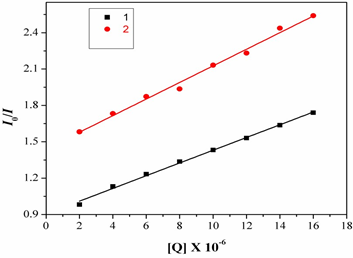
Fig.10. Fluorescence spectra of BSA in emission intensity I0/Ivs [Q]. [Q= complex].
Fig.11. Determination of complexes– BSA binding constant and the number of binding sites of BSA. And taking as fluorescence lifetime (t0) of tryptophan in BSA at around 10-8s, the Stern-Volmer quenching constant (Ksv, M-1) can be obtained from the slope of the diagram I0/Ivs [Q] Fig.11, and subsequently the approximate quenching constant (kq, M-1 s-1) may be calculated. The calculated value so fKsv and kq for the interaction of the complex with BSA are given in Table1 and indicate a good BSA binding propensity of the complexes exhibiting the highest BSA quenching ability. The kq values are higher than diverse kinds of quenchers with the existence of a static quenching mechanism [23]. Using the Scatchard equation [24].
Where n is the number of binding sites per albumin and K is the association binding constant, K(M-1), may be calculated from the slope of plots of (DI0/I)/[Q]vs(DI/I0)(Fig.13) and n is given by the ratio of the intercept to the slope. The K values of the complex 1 for albumins, being in the value given Table1. The Stern-Volmer equation applied for the interaction with BSA in Fig.12 shows that the curves have fine line a relationships (r=0.9715-9876). The calculated values of Ksv and kq are given in Table 1 which indicates their good BSA binding propensity with complex. Therefore, the study of the binding to albumins may reveal useful information concerning future application.
We have synthesized and characterized the Manganese (II), Iron (II) and Zinc (II) complexes (1-3). The electrochemical properties of the complexes 1-3 show two irreversible waves at -0.75 & -0.85 and -0.27 & -0.39, respectively. The DNA binding properties of the complexes 1-3 show hyperchromism with Kb value of 1.75X10, 1.98X10⁵ and 2.38X10⁵M-1 respectively. The complex 1 show better DNA binding agent than the complex 2 and 3. These studies form an important rationale for drug design and warrant further in vivo experiments and pharmacological as says.
N. Pravin, V. Devaraji, N. Raman, International journal of biological macromolecules, Int. J. Biol. Macromol., 79 (2015) 837?855. PMid:26054665
View Article PubMed/NCBIP. Gurumoorthy, D. Mahendiran, D. Prabhu, C. Arulvasu, A. K. Rahiman, J. Mol. Struct., 1080 (2015) 88-98.
View ArticleG.Kumaravel, N.Raman, C.Mater.Biol.Appl., 70(2017) 184-194. PMid:27770880
View Article PubMed/NCBISiddiqi ZA, Khalid M, Kumar S, Shahid M, Noor S. Euro J Med Chem 2010; 45(1): 264e269.
Sahoo J, Paidesetty SK. J Taibah Univ Med Sci 2015; 10: 306e319.
Sahoo J, Mekap SK, Paidesetty SK. J Taibah Univ Sci 2015; 9: 187e195.
S. Tabassum, M. Ahmad, M. Afzal, M. Zaki, P. K. Bharadwaj, Journal of Photochemistry and Photobiology B: Biology, 2014, 140, 321. [8] L.S. Lerman, J. Mol. Biol. 1961, 3, 18.
L.S. Lerman, J. Mol. Biol. 1961, 3, 18. 80004-1
View ArticleF. Mancin, P. Scrimin, P. Tecilla, and U. Tonellato, Chemical Communications, 2005, 20, 2540. PMid:15900321
View Article PubMed/NCBIY.L. Song, Y.T. Li, Z.Y. Wu, J. Inorg. Biochem. 2008, 102, 1691. PMid:18538849
View Article PubMed/NCBIF. Mancin, P. Scrimin, P. Tecilla, U. Tonellato, Chem. Commun. 2005, 20, 2540. PMid:15900321
View Article PubMed/NCBIT. Hirohama, Y. Kuranuki, E. Ebina, T. Sugizaki, H. Arii, M. Chikira, P.T. Selvi, M. Palaniandavar, J. Inorg. Biochem. 2005, 99, 1205. PMid:15833344
View Article PubMed/NCBIA. Wolfe, G.H. Shimer, T. Meehan, Biochemistry. 1987, 26, 6392. PMid:3427013
View Article PubMed/NCBIS.A. Sallam, A.S. Orabi, A.M. Abbas, J. Mol. Struct. 2011, 1006, 272. [16] J. Olmsted, D.R. Kearns, Biochemistry, 1977, 16, 3647.[17] B.C. Baguley, M. Lebret, Biochemistry, 1984, 23, 937.
R.F. Pasternack, M. Cacca, B. Keogh, T.A. Stephenson, A.P. Williams, F.J. Gibbs, J. Am. Chem. Soc. 1991, 113, 6835.
View ArticleS. Karastogianni, C.D. Samara, E. Ioannou, C.P. Raptopoulou, D.H. Litina, S. Girousi, J. Inorg. Biochem. 2013, 118, 48. PMid:23123338
View Article PubMed/NCBIJ. Liu, T.X. Zhang, T.B. Lu, L.H. Qu, H. Zhou, Q.L. Zhang, L.N. Ji, J. Inorg. Biochem. 2002, 91, 269. 00441-5
View ArticleS. Tabassum, A. Asim, F. Arjamand, M. Afzal, V. Bagchi, Eur. J. Med. Chem., 2012, 58, 308. PMid:23137447
View Article PubMed/NCBIF. Wang, H. Yin, J. Cui, Y. Zhang, H. Geng, M. Hong, J. Organomet. Chem. 2014, 759, 83.
View ArticleS. Tsiliou, L.-A. Kefala, F. Perdih, I. Turel, D.P. Kessissoglou, G. Psomas, Eur. J.
M. Zampakou, M. Akrivou, E. G. Andreadou, C. P. Raptopoulou, V. Psycharis, A.A. Pantazaki, G. Psomas, J. Inorg. Biochem. 2013, 121, 88. PMid:23353085
View Article PubMed/NCBIV. Rajendiran, R. Karthik, M. Palaniandavar, H.S. Evans, V.S. Periasamy, M.A.