Samir Kenouch
Email: samir.kenouche@univ-biskra.dz
© 2019 Sift Desk Journals. All Rights Reserved
VOLUME: 2 ISSUE: 3
Page No: 199-211
Samir Kenouch
Email: samir.kenouche@univ-biskra.dz
Samir Kenouche1[1], Dalal Harkati2, Myriem Ghamri2, A. Rahime Chikhaoui1, Nadjib Melkemi2
1Department of Matter Sciences, Faculty of Exact and Natural Sciences University M.Khider of Biskra, 07000 Biskra, Algeria
2Research team computatinal and pharmaceutical chemistry LMCE laboratory, University M.Khider of Biskra 07000 Biskra, Algeria.
Yong Liang(yliang@must.edu.mo)
Veda Prachayasittikul(veda.pra@mahidol.ac.th)
Beatriz Sevilla-Morán(bsmoran@inia.es)
Dr. Sisir Nandi(sisir.iicb@gmail.com)
Kenouche Samir, Predictive QSAR model and clustering analysis of some Benzothiazole derivatives as cytotoxic inhibitors(2018)SDRP Journal of Computational Chemistry & Molecular Modelling 2(3)p:199-211
We propose an original approach dedicated to QSAR modeling and clustering analysis based on a dataset of 23 Benzothiazole derivatives as cytotoxic inhibitors. The choice of relevant molecular descriptors is a key step in QSAR modeling. In this work, model selection by exhaustive search is used to identify the best subset of molecular descriptors. Three distinct clusters have been identified using K-means clustering. Each cluster, groups a homogeneous class of molecules with respect their molecular descriptors. Silhouette analysis, used as cluster validation approach, proves that the molecules are very well clustered and there are no molecules placed in the wrong cluster. Moreover, the results emphasize that the molecular descriptors belonging to physico-chemical class appears to largely influence the cytotoxic activity of Benzothiazole derivatives. From this classification, all molecules with the trifluoromethyl group show a strong activity. The best cytotoxic activity was exhibited by compound containing two trifluoromethyl groups in ortho position. We suggested that this functional group is correlated to binding affinity. The PLS equations exhibit a good agreement between fitted and observed cytotoxic activities. According to the goodness of fit statistics, 67% and 80% of the variability in cytotoxic activity around its mean are explained. The F-statistic test revealed the significance of both PLS regression equations. The values of bootstrapping correlation coefficient Rboots2 and leave-one-out cross-validation coefficient Q2Loo revealing that the resulting models have good predictive power and robustness. We concluded that the developed PLS equations can be successfully applied to predict the antiproliferative activity against breast cancer cells lines of Benzothiazole derivatives.
keywords:
Benzothiazole derivatives, anticancer activity, QSAR study, principal component analysis, K-means clustering, PLS regression
After cardiovascular diseases, cancer is the second leading cause of death worldwide. There is a growing body of literature that recognises the importance of cancer prevention from threatening our lives. It is now well established from a variety of studies, that protein tyrosine kinases play a critical role in the development and progression of many kinds of cancer [1]. There are a lot of heterocyclic compounds which have provide enormous potential in the discovery of new chemotherapeutics in drug discovery and development programs, [2, 4] such as benzothiazole type compounds belong to the family of heterocyclic compounds having benzene ring incorporated with five-membered ring containing nitrogen and sulfur atoms. Because of their biological and pharmacological properties, benzothiazoles were widely used as antitubercular [5, 7], antimicrobial [8, 11], antimalarial, [12, 13] anticonvulsant, [14, 16] anthelmintic [17, 19] analgesic, [20] antinflammatory [21, 22] and antidiabetic [23]. More importantly, benzothiazoles are one of the most widely used groups of organic compounds and have been extensively used for anticancer activity [24, 29]. Many benzothiazoles were synthesised for this purpose and their responses against cancer cells were varied. However, there is an urgent need to synthesise new benzothiazoles with higher responses. The classic method of synthesis and assess the new compounds is too expensive but this issue has been addressed by the quantitative structure-activity relationships theory (QSAR) [30, 31]. QSAR has emerged as a powerful platform for predicting the biological activity for new compounds. It simply provides formalism for developing mathematical correlation between the structural features and property/activity similar compounds. QSAR analysis will provide structural insight into the mechanism of action of these inhibitors, which is of utmost importance in the design of new analogues by modification of structure of parent compound [4, 32, 33]. In this work, we aim to make reliable QSAR models to predict the antiproliferative activity (anticancer activity) based on a dataset of 23 compounds. Through a Principal Component Analysis (PCA), K-means clustering, silhouette analysis as cluster validation approach, cluster characterization by molecular descriptors and Partial Least Square (PLS) regression methods. The development of a performant model will help to explain the role of Benzothiazole derivatives in chemotherapy against breast cancer and also propose other molecules.
2.1 Biological data set and molecular optimization
The cytotoxic activities of Benzothiazole derivatives were evaluated in the human cancer cell lines SK-BR3 [34]. The growth inhibition (IC50) was converted in pIC50 by taking logarithm (pIC50 = - Log(IC50)) which was taken as the dependent parameter for QSAR study.
The IC50, is measure of a compound’s inhibitory effectiveness and which cause 50 % reduction in of cell growth for human breast cancer. The chemical structures of Benzothiazoles inhibitors and their corresponding pIC50 values tested at concentrations of 100µM are presented in Tab.(1).
All computational calculations were carried out on a Station (HP Intelr Xeonr Processor CPU E5-2600 , 8 GB RAM) using three software. The 3D structures of the inhibitors were subjected to energy minimization using MM+ force field followed by Semiempirical self-consistent-field molecular orbital (SCF-MO) method at PM3 level within restricted Hartree-Fock formalism (RHF), with a gradient norm limit of 0.1 kcal/A◦ in HyperChem program package version 8.08 [35]. Further, the 3D structures were fully reoptimized by Gaussian 09 software [36] at DFT/B3LYP exchange correlation potential with 6-311G(d,p) basis. In the next step, a parallel study using the molecular mechanics force field (MMFF) method implemented in the Molecular Operating Environment (MOE2014.09, Chemical Computing Group, Inc.) package [37] with a convergence criterion of 0.01 kcal/mol and partial atomic charges.
Table 1: The structure and cytotoxic activity of Benzothiazole derivatives

|
Compounds no. |
Ar |
pIC50 |
|
1 |
4-Cl-3-CF3-C6H3- |
4.063 |
|
2 |
3,5-(CF3)2-C6H3- |
4.095 |
|
3 |
2,4-Cl2-C6H3- |
4.092 |
|
4 |
3,5-Cl2-C6H3- |
4.074 |
|
5 |
4-Cl-C6H4- |
4.081 |
|
6 |
6-Cl-pyridin-2-yl |
4.049 |
|
7 |
Quinolin-6-yl |
4.529 |
|
8 |
Benzofuran-2-yl |
4.280 |
|
9 |
1,4-Benzodioxan-6-yl |
4.205 |
|
10 |
4-Cl-3-CF3-C6H3-NH |
4.025 |
|
11 |
3,5-(CF3)2-C6H3-NH |
4.016 |
|
12 |
2,4-Cl2-C6H3-NH |
4.038 |
|
13 |
3,4-Cl2-C6H3-NH |
4.033 |
|
14 |
4-Cl-C6H4-NH |
4.111 |
|
15 |
4-CF3-C6H4-NH |
4.100 |
|
16 |
4-F-C6H4-NH |
4.137 |
|
17 |
4-Br-C6H4-NH |
4.160 |
|
18 |
2-Cl-5-CF3-C6H3-NH |
4.050 |
|
19 |
2,4-F2-C6H3-NH |
4.099 |
|
20 |
4-Morpholine-C6H4-NH |
4.110 |
|
21 |
4-(4-CH3-piperazine-1-yl)-C6H4-NH |
4.064 |
|
22 |
4-(4-(CH3)2N-piperidin-1-yl)-C6H4-NH |
4.038 |
|
23 (REF) |
Sorafenib |
4.031 |
2.2 Molecular descriptor generation
A QSAR study was performed on 23 Benzothiazole derivatives as reported previously, in order to identify a quantitative relationship between the structure and antiproliferative activity against breast cancer cells lines. Before every modelization, it is necessary to establish different types of molecular descriptors [38] (one dimensional, two dimensional, and three dimensional) to obtain a meaningful QSAR model. A set of 42 molecular descriptors were calculated using three software as Hyperchem program package version
8.08, Gaussian 09 software and MOE 2014.09 based on molecular structures and the quantum theory of atoms in molecules.
2.3 Statistical methods
The statistical study of the quantitative structure-activity relationship was conducted using several statistical methods. The main objective is understanding the quantitative correlation of the physicochemical properties of some Benzothiazole derivatives with their biological activities. A brief description of this methods is discussed in the next sections. Moreover, all the statistical tools presented in this study were implemented under R (R Foundation for Statistical Computing) software.
2.3.1 Molecular descriptor selection
The choice of relevant molecular descriptors is a key step in QSAR modeling. An initial selection of p descriptors was conducted as follows. The Pearson’s correlation coefficient is calculated between each descriptor xi and the studied biological response. Using a correlation significance test, the p.values are calculated for testing the null hypothesis against the alternative that there is a nonzero correlation. The p.values are then sorted in ascending order and the first p (equal to 12) molecular descriptors are selected. As we can see the number of preselected descriptors is large and it is difficult to find the best model in terms of predictive power. In this case, it is more efficient to use a search algorithm (e.g. Backward elimination, Forward selection, Stepwise regression and Exhaustive method) to reach this goal.
In this study, the leaps R package [39], model selection by exhaustive search, is used to identify the best subset of descriptors. The principle of this method is based on the computing of 2p regressions with all possible combinations of xj = x1,...,xp. The best combination will be the one with the highest adjusted correlation coefficient or the lowest value of another criterion such as Mallow’s Cp statistic or Schwartz’s information criterion (BIC) [40].
2.3.2 Principal component analysis method
PCA method, reduces the number of dimensions without much loss on information. The problem of visualizing data with high dimension can be simplified by replacing several correlated variables with a single new variable. PCA is a powerful tool for achieving this simplification. The method generates a new set of variables, called principal components. Each principal component is a linear combination of the original variables. The first principal component explain the largest part of the inertia of the data table. Each succeeding component will account for progressively smaller amounts of inertia [41].
In this paper, PCA is performed as a preprocessing to provide more stable clusters. We mainly used the FactoMineR R package [42] to compute principal components and the factoextra R package [43] for extracting and visualizing the results.
2.3.3 K-means clustering
The cluster R package [44] was used to perform the K-means algorithm. It was implemented in order to examine similarities and dissimilarities between molecules. This algorithm divide the observations (molecules in our case) into homogeneous clusters, based on their description by a set of quantitative variables (molecular descriptors in our case). The advantage of K-means clustering is that the assignment of observations to different clusters during iteration is reversible. This assignment is irreversible with Agglomerative Hierarchical Clustering.
In this work, the optimal number of clusters was determined using elbow method. This method computes the total within-cluster sum of squares (WSS) as function of the number of possible clusters. The total WSS measures the compactness of the clustering and it must be as small as possible. As a rule of thumb, we pick the number correponding at a significant decrease in the total WSS. Moreover, the K-means algorithm is incremented with several initializations to ensure a best classification. Furthermore, Silhouette analysis is used as cluster validation approach evaluating the goodness of clustering algorithm results.
2.3.4 Cluster characterization by molecules
The cluster centroid is a fictional mean observation, it is better to use a real observation to understand the average behavior of molecules in each cluster. The closest point to the cluster centroids is called parangon [45]. Therefore, we can describe the overall behavior of the molecules in each cluster by their respective parangons. In addition, a specific molecule (also called extreme molecule) in each cluster, is defined as the furthest molecule to the other cluster centroids [45].
2.3.5 Cluster characterization by descriptors
The purpose of this analysis is to select the dominant molecular descriptors characterizing each cluster. The mean of one group for this descriptors is computed and compared to the overall mean according to [46] :

Where ¯xj,k and ¯xj are the mean of xj in cluster k and the mean of xj in the data set, respectively. On the other hand, nk and sj are the number of observations in the cluster k and the standard deviation of xj in the data set, respectively. In this statistical test, we consider the p.value :

The quantity v.test can then be compared to the appropriate quantile of the normal distribution. If this quantity is more extreme than the quantile of the normal distribution, then the descriptor is interesting to describe the group of molecules. Moreover, the p.value is computed under the null hypothesis (H0 : ¯xj,k = ¯xj). Indeed, if the p.value is less than to significance level 0.05, then ¯xj,k is significantly different from ¯xj.
Accordingly, the corresponding molecular descriptor characterize the kth cluster molecules. The statistical test was conducted using FactoMineR R package. More details related to this statistical test can be found at [45][47].
2.3.6 Partial least squares regression
PLS regression is more appropriate when the number of molecular descriptors are highly collinear [48]. Indeed, the chemical, physical, quantum and steric properties are necessarily correlated for a given molecule. This is a reflection of the innate properties of the system and additional data collected in the same way will show the same collinearity. Multiple linear regression (MLR) is very sensitive to the collinearity problem of variables. Another source of redundancy in a data set, which may be more difficult to identify, is where a descriptor is correlated with a linear combination of two or more of the other descriptors in the set [49].
Thereby, PLS regression is a useful alternative to the MLR model fitted using ordinary least squares. In this work, regression diagnostics for detecting possible outliers was carried out by computing leverage values (hii) and studentized deleted residuals (ri∗). The diagonal elements of the hat matrix, denoted leverage values, are used for identifying outlying X observations. A leverage values greater than 2(k+1/n) are considered to indicate outlying cases with regard to their X values [49].
On the other hand, the magnitude of the studentized residuals are used for identifying outlying Y observations. Finally, the model validity is judged using the squared correlation coefficient (R2) and the Fisher test for significance of the regression equation. The squared bootstrapping correlation coefficient (RBoots2 ) and the leave-one-out cross-validated coefficient (Q2Loo) are used to measure a model’s predictive ability [50].
The first step in this statistical study is to select the most relevant molecular descriptors. As shown in Fig. (1), each row in this graph represents a model. The black rectangles in the columns indicate the descriptors included in the given model. While, the white rectangles indicate that the corresponding descriptors are not included. The best choose of descriptors will balance fit with model size.
The black rectangles of the first row indicate the subset of predictors that do the best at meeting well-defined objective criterion, BIC in our case. This criterion is chosen because it penalizes larger models more heavily and will tend to select smaller subset of descriptors in comparaison to other criteria [49]. As a result, the best subset of descriptors providing a good prediction of the response variable corresponds to BIC = −31.
The selected descriptors, presented in Tab.(2), are : octanol/water Partition Coefficient (Log P), Electronic Energy (Eele), Total Energy (Etot), Solvation Energy (Esol), Hydratation Energy (HE) and Density. This choice is a compromise between a good predictive QSAR model and a minimal number of molecular descriptors.
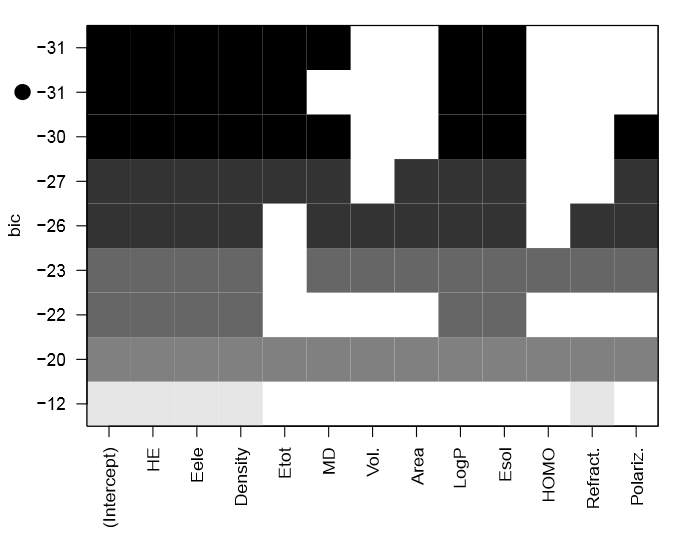
Figure 1: Variables selection by exhaustive search.
Table 2: The selected molecular descriptors
|
Molecules |
LogP |
Etot |
Eele |
Density |
HE |
Esol |
|
1 |
-0.47 |
-157277.76 |
-1060188.50 |
1.2424 |
-11.91 |
-10.0496 |
|
2 |
0.32 |
-185195.09 |
-1254494.50 |
1.2875 |
-11.66 |
-13.9294 |
|
3 |
-1.26 |
-129363.42 |
-887649.50 |
1.1987 |
-11.96 |
-20.8428 |
|
4 |
-1.26 |
-129365.35 |
-882216.62 |
1.2018 |
-12.05 |
-20.0789 |
|
5 |
-1.04 |
-121062.85 |
-831345.25 |
1.1557 |
-12.32 |
-18.7058 |
|
6 |
0.35 |
-122557.16 |
-874012.81 |
1.1769 |
-13.04 |
-15.2429 |
|
7 |
-2.31 |
-126691.17 |
-929386.06 |
1.1185 |
-14.31 |
-32.5654 |
|
8 |
-2.39 |
-126014.70 |
-936863.43 |
1.1313 |
-14.91 |
-10.8898 |
|
9 |
-2.98 |
-134067.21 |
-1009961.60 |
1.1455 |
-15.37 |
-17.9581 |
|
10 |
-1.16 |
-162363.14 |
-1181965.80 |
1.2501 |
-12.63 |
-08.5868 |
|
11 |
-0.36 |
-190280.84 |
-1428270.80 |
1.2876 |
-12.03 |
04.2343 |
|
12 |
-1.95 |
-134450.53 |
-990701.06 |
1.2040 |
-12.75 |
-14.3706 |
|
13 |
-1.95 |
-134450.03 |
-1000951.60 |
1.2003 |
-13.04 |
-11.3748 |
|
14 |
-1.72 |
-126152.00 |
-900191.31 |
1.1590 |
-13.45 |
-13.0216 |
|
15 |
-0.93 |
-154063.93 |
-1128375.30 |
1.2044 |
-12.92 |
03.1747 |
|
16 |
-2.10 |
-128717.57 |
-944312.37 |
1.1596 |
-13.56 |
-17.9294 |
|
17 |
-1.45 |
-125675.35 |
-950223.50 |
1.2405 |
-13.40 |
-14.3414 |
|
18 |
-1.16 |
-162366.01 |
-1214797.70 |
1.2449 |
-12.53 |
02.0885 |
|
19 |
-2.70 |
-139583.73 |
-1014158.00 |
1.1899 |
-13.12 |
-13.9261 |
|
20 |
-2.79 |
-144038.90 |
-1225421.30 |
1.1083 |
-14.43 |
01.9731 |
|
21 |
-3.54 |
-145960.12 |
-1331395.50 |
1.0753 |
-11.20 |
-07.2194 |
|
22 |
-3.36 |
-153140.14 |
-1483806.00 |
1.0558 |
-10.32 |
-02.1201 |
| 23 (REF) | -1.19 | -150493.03 | -1018030.80 | 1.1972 | -11.92 | -07.8499 |
3.1 Cluster analysis
As mentioned above, PCA is used as a preprocessing step. Keeping the first components makes the clustering more robust because it eliminates random fluctuations and provides more stable clusters. Fig.(2) shows the optimal number of clusters using albow method. We can see from this figure an elbow at three clusters. By adding more clusters than that we get relatively smaller gain of total WSS.
As can be seen in Fig.(3), the first two principal components account for 78.20% of the total inertia. This figure presents the three clusters obtained from K-means algorithm.
Each cluster, groups a homogeneous class of molecules with respect their molecular descriptors. The percentage of molecules retained in each cluster are 56.52%, 30.44% and 13.04% in the red, green and blue clusters, respectively.
Fig.(4) illustrates the plot of the silhouette width for molecules in each cluster. Silhouette analysis is a cluster validation approach measuring how well an observation is clusterd. In each cluster, we observe a positive silhouette width and an average value greater than 0.50. This result proves that the molecules are very well clustered and there are no molecules placed in the wrong cluster.
An overall measure of the goodness of a clustering can be also obtained by computing the average silhouette width of all clusters. For this classification, we obtained a value of 0.51, which confirms a good classification.

Figure 2: Optimal number of clusters.

Figure 3: Principal component scatter plot with colored clusters and 95% confidence ellipses.
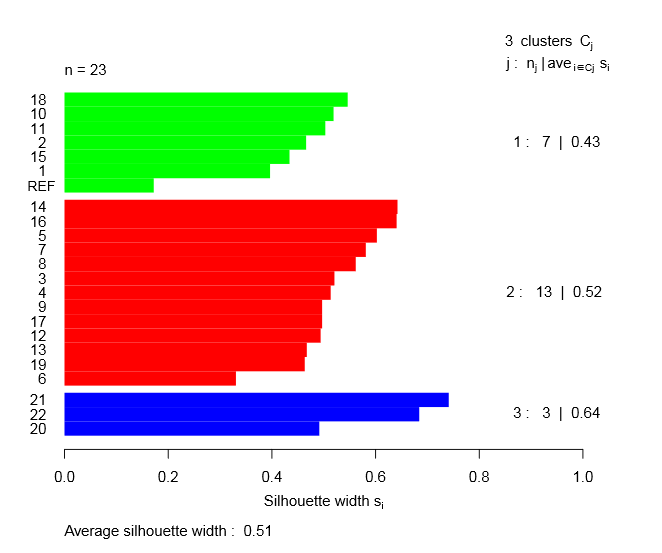
Figure 4: Silhouette analysis for K-means clustering.
3.1.1 Cluster characterization
The parangons of the red, green and blue clusters are the molecules 14, 10 and 21, respectively. The specific molecules of the red, green and blue clusters are the molecules 7, 2 and 22, respectively. For example, the molecule 22 is the furthest from the red and green cluster centroids, that is why it is specific compared to other molecules belonging to the blue cluster. The sens ”specific” is used to describe an enhancement of distinctive characteristics. Concerning the cluster descriptors characterization, it is important to emphasize that only well projected descriptors on the factor map can be interpreted.
We can see from Fig.(6) that the squared cosines between the descriptors and its projections are higher than 0.50.
Consequently, all the descriptors are well projected and can be interpreted. The following table containing statistics related to the statistical test.
From the Tab. (3), we can see that the particular descriptors are significant because their p-values are less than to significance level 0.05 (rejecting the null hypothesis). The amplitude of the v.test values reveal the degree of influence of the corresponding molecular descriptors. A positive value suggests that the corresponding molecular descriptor, for the molecules belonging to the kth cluster, is significantly higher than the overall mean of all the molecules. A negative value suggests that the corresponding molecular descriptor, for the molecules belonging to the kth cluster, is significantly less than the overall mean of all the molecules. For the red cluster, the largest v.test values are observed for the descriptors Total Energy, Electronic Energy, Hydratation Energy and Solvation Energy. These are the most characteristic molecular descriptors of the red cluster molecules. Furthermore, the descriptors Total Energy and Electronic Energy contribute positively, which means that the red cluster molecules show a molecular Total Energy and Electronic Energy significantly higher than the overall mean of all other molecules. Similarly, these molecules show a Hydratation Energy and Solvation Energy significantly less than the overall mean of other molecules.
Table 3: The characteristic molecular descriptors
|
Clusters |
Particular desc. |
v.test |
x¯j,k |
x¯j |
p.value |
|
Red cluster |
Etot |
3.8915 |
-1.29e+05 |
-1.42e+05 |
9.95e-05 |
|
|
Eele |
3.8534 |
-9.34e+05 |
-1.06e+06 |
1.16e-04 |
|
|
HE |
-2.3385 |
-13.32e+00 |
-1.28e+01 |
1.93e-02 |
|
|
Esol |
-3.5235 |
-17.01e+00 |
-1.12e+01 |
4.25e-04 |
|
Green cluster |
Density |
3.1449 |
1.24e+00 |
1.18e+00 |
0.0016 |
|
|
LogP |
2.7406 |
-7.07e-01 |
-1.62e+00 |
0.0061 |
|
|
Esol |
2.4475 |
-4.41e+00 |
-1.12e+01 |
0.0143 |
|
|
Eele |
-2.0613 |
-1.18e+06 |
-1.06e+06 |
0.0392 |
|
|
Etot |
-3.8414 |
-1.66e+05 |
-1.42e+05 |
0.0001 |
|
Blue cluster |
LogP |
-2.8009 |
-3.23e+00 |
-1.62e+00 |
0.0050 |
|
|
Eele |
-2.8556 |
-1.34e+06 |
-1.06e+06 |
0.0042 |
|
|
Density |
-3.1637 |
1.07e+00 |
1.18e+00 |
0.0015 |
Moreover, all the molecular descriptors characterizing the red cluster have the highest values for the corresponding specific molecule (molecule number 7). A similar interpretation is applied to the green and blue clusters. The descriptor Total Energy seems to be the one distinguishing the red and green clusters. This effect is visible from the correlation circle, see Fig. (6). The descriptor Total Energy is highly correlated to the first principal component. The correlation coefficient between the descriptor and this dimension is 0.99. These results are confirmed by the v.test values obtained for both clusters, see Tab. (3). According to these values, the descriptor Total Energy characterizes both clusters but with opposite signs. By comparing the chemical structure of the molecules belonging to these clusters, the chemical entities are mainly distinguished by the presence or not of the trifluoromethyl group.
It was proven that compounds with this functional group have an appropriate pharmaceutical activity. Indeed, lipophilicity conferred by the trifluoromethyl group exhibit improved bioavailability, is responsible for leading to a smaller effective dose and inhibition of biological processes by reversible binding to enzymes. This property also promotes drung transport by easily crossing lipophilic barriers and drug receptor hydrophobic interactions in biological system [51]. Moreover, even if no barrier has to be crossed (in this case for example, in vitro studies), the drug is required to interact with its target (enzyme or receptor) in which the bindig site is usually hydrophobic. That is why the enhancement of the hydrophobic nature of the drug improves its capability to cross the hydrophobic barrier and/or to bind to the target [52]. Unlike molecules belonging to red cluster, the green cluster is homogeneous in terms of cytotoxic activity. All the molecules belonging to this cluster record a strong activity. The best cytotoxic activity was exhibited by compound containing the group No. 11, see Fig.(5).
Therefore, we can suspect a possible correlation between the trifluoromethyl group and cytotoxic activity of these molecules. Probably, this group is most correlated to binding affinity.
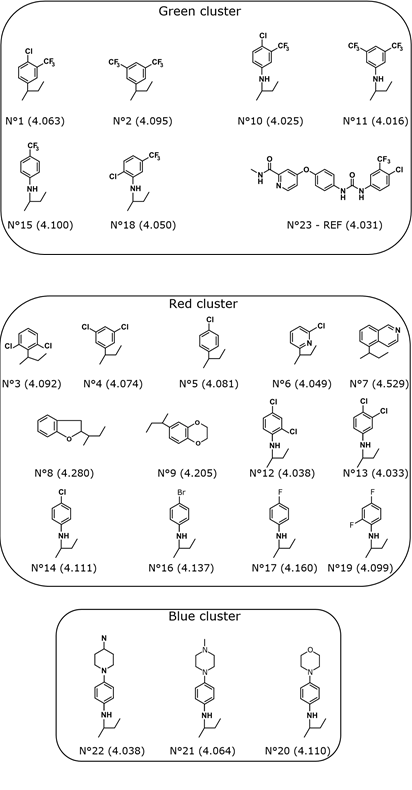
Figure 5: Clustering results of Benzothiazole derivatives.

Figure 6: Graph of variables and the quality of projection on the factor map.
3.2 PLS regression
The Fig.(7) summarizes a matrix of linear correlation coefficients between each pair of descriptors. This correlogram is useful to highlight the most correlated descriptors. For more visibility, only the upper triangular part of matrix is visualized. The pairs of colinear descriptors are identified using a correlation significance test. Indeed, the p.values are calculated for testing the null hypothesis (no correlation) against the alternative that there is a nonzero correlation.
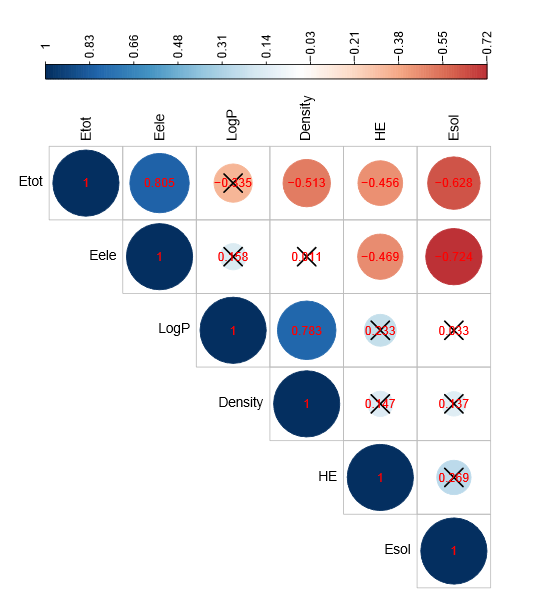
Figure 7: Graph of correlation matrix with the significance level
The size and color intensity of the circle are proportional to the correlation coefficient. The positive and negative correlations are displayed in blue and red colors, respectively. In the above figure, correlations with a p.value higher than 0.05 is no significantly different from zero. Consequently, the corresponding descriptors are collinear. The checked values indicate a p.value less than 0.05 and therefore the corresponding descriptors are not correlated. It follows from these results that the selected descriptors exhibit a significant inter-correlation. A strong correlation (R = 0.80) was observed between descriptors Total Energy and Electronic Energy. Indeed, the same information expressed in different forms. As a result, the descriptor Electronic Energy is excluded because it is the least correlated to the response variable. Similarly, the descriptors Density and LogP exhibit a correlation of 0.78. These descriptors have approximately the same degree of correlation with the response variable. We chose to keep the descriptor LogP to facilitate the interpretation of the regression results. The values of observed cytotoxic activities, those computed by PLS equations and regression diagnostics are listed in the Tab. (4).
Table 4: Diagnostic statistics for regression
|
Green cluster |
||||
|
Molecules |
Obs. pIC50 |
Pred. pIC50 |
hii |
ri∗ |
|
1 |
4.0630 |
4.0869 |
0.4648 |
-1.3863 |
|
2 |
4.0948 |
4.0750 |
0.7723 |
1.7449 |
|
10 |
4.0248 |
4.0157 |
0.6342 |
0.6376 |
|
11 |
4.0162 |
4.0377 |
0.7627 |
-1.8637 |
|
15 |
4.1000 |
4.0811 |
0.6551 |
1.2945 |
|
18 |
4.0503 |
4.0368 |
0.3275 |
0.7001 |
|
REF |
4.0310 |
4.0458 |
0.3835 |
-0.8031 |
|
Red cluster |
||||
|
Molecules |
Obs. pIC50 |
Pred. pIC50 |
hii |
ri∗ |
|
3 |
4.0917 |
4.0871 |
0.2699 |
0.0894 |
|
4 |
4.0744 |
4.0832 |
0.2357 |
-0.1708 |
|
5 |
4.0808 |
4.1066 |
0.3324 |
-0.5418 |
|
6 |
4.0489 |
4.1111 |
0.2337 |
-1.2159 |
|
7 |
4.5289 |
4.4679 |
0.7810 |
2.2267 |
|
8 |
4.2803 |
4.1939 |
0.4443 |
1.9824 |
|
9 |
4.2054 |
4.3182 |
0.4650 |
-2.6353 |
|
12 |
4.0378 |
4.0430 |
0.2021 |
-0.0994 |
|
13 |
4.0333 |
4.0223 |
0.2277 |
0.2146 |
|
14 |
4.1114 |
4.1029 |
0.1630 |
0.1604 |
|
16 |
4.1372 |
4.1794 |
0.0835 |
-0.7533 |
|
17 |
4.1600 |
4.1198 |
0.1443 |
0.7435 |
|
19 |
4.0993 |
4.0542 |
0.4174 |
1.0147 |
First, we examine the results of the regression diagnostics of red cluster molecules. The leverage value of molecule number 7 is greater than the threshold 0.61 (8/13). This observation creates a false correlation because the squared correlation coefficient obtained without and with this point increases from 0.80 to 0.85, respectively. From the Studentised deleted residuals column, the values of observations 7 and 9 are greater than the threshold |2|. While all other observations have studentized deleted residuals between -2 and 2. The observations 7 and 9 are outlying with respect to its y values. Given these result we conclude that observations 7 and 9 are influential. These points were not taken into account when establishing the predictive models.
For the green cluster molecules, no observations with large leverage values were detected. Therefore, there is no outlying with respect to its x value, since its x value is near the middle of the other x values. In addition, no observations with large Studentised deleted residual values were detected. Moreover, Tab. (4) shows a good agreement between experimental and predicted values. In order to highlight the weight of each descriptor, the regression model is written with scaled variables. The standardized regression coefficient value of each descriptor highlights the relative importance of the descriptors in determination of biological activity of the compounds. In this study, Cross-validation is used as a sound method for choosing the number of components in PLS regression. For the green cluster molecules, the PLS regression equation is

Where y = y/sy and xj = xj/sxj. The variables x1, x2 and x3 are the following molecular descriptors : octanol/water Partition Coefficient, Total Energy and Solvation Energy, respectively. Parameter B is the number of bootstrap replications.
The molecular descriptors x1 (LogP) and x2 (Etot) exhibit relatively the same influence on cytotoxic activity. The descriptor x3 (Esol) is approximately two times less influential on cytotoxic activity than the two previous descriptors. This equation reveals that the positive coefficient of LogP explains that any increase in lipophilicity of molecules causes an enhancement in the cytotoxic activity. This results is in agreement with the classification of molecules using K-means clustering. As pointed out above all the molecules belonging to the green cluster are provided with at least one trifluoromethyl group. The partition coeffcient LogP is an estimation of the drug’s hydrophobicity in its totality and represents an important measure of how well a drug will be transported to its target and will bind to its receptor [53]. In addition, hydrophobic drugs are often more willing to be metabolized, wich promotes thier elimination. For the red cluster molecules, the PLS regression equation is
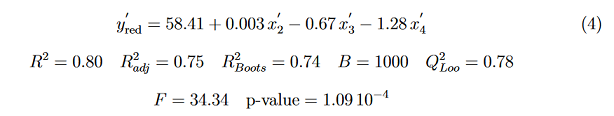
Where x4 is the descriptor Hydratation Energy (HE). The descriptor x2 (Etot) exhibits a negligible role on antiproliferative activity. The descriptor x3 (Esol) is approximately two times less influential on cytotoxic activity than the descriptor HE. The absence of LogP in this equation is a clue that lipophilicity has no influence on these molecules.
Fig.(9) and (8) show a good correlation between fitted and observed biological activities. According to the goodness of fit statistics, 67% and 80% of the variability in cytotoxic activity around its mean are explained by the PLS regression equations (3) and (4), respectively. In addition, these equations are significant because both of their p.values are less than to significance level 0.05 (rejecting the null hypothesis). Moreover, it is well known that cross validation is useful for overcoming the problem of overfitting [50]. This problem refers to a situation when the model requires more information than the data can provide. Indeed, in our case the difference between R2 and Q2Loo not exceeding the threshold 0.30, confirming that the two PLS regression models are not overfitted. A high average Rboots2 and a cross-validation coefficient Q2 greater than 0.50 are a demonstration that the resulting models have good predictive power and robustness. Moreover, the statistical quality of Eq. (4) is better than Eq. (3). It follows from these results that the developed PLS regression equations can be successfully applied to predict the antiproliferative activity against breast cancer cells lines of Benzothiazole derivatives.
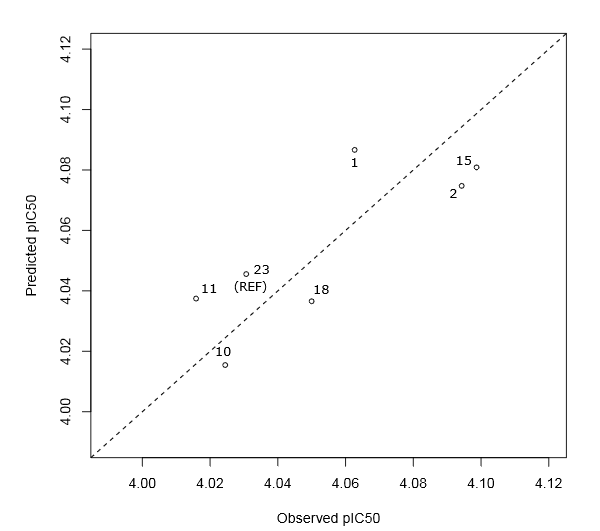
Figure 8: Scatter plot of predicted and observed pIC50 for the green cluster molecules. The dotted line represents the case where the both biological activity are equal
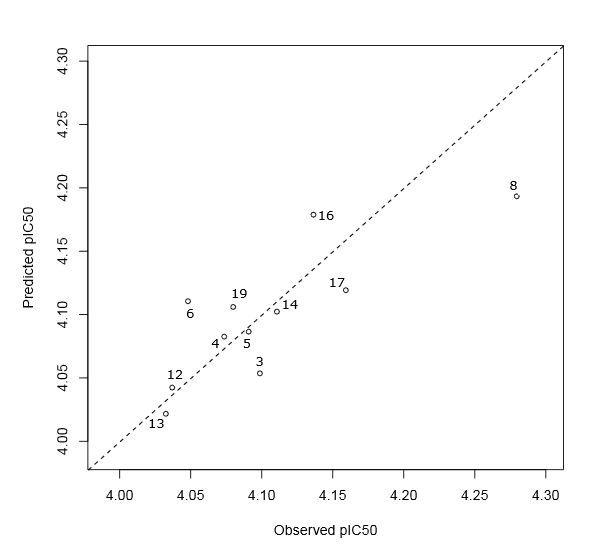
Figure 9: Scatter plot of predicted and observed pIC50 for the red cluster molecules. The dotted line represents the case where the both biological activity are equal.
The aim purpose of this study was to design a robust and reliable QSAR models to predict the anticancer activity based on a dataset of 23 Benzothiazole derivatives. In this paper, model selection by exhaustive search is used to identify the best subset of molecular descriptors. Three distinct clusters have been identified using K-means clustering. Each cluster, groups a homogeneous class of molecules with respect their molecular descriptors. Unlike molecules belonging to the red cluster, the green cluster is homogeneous in terms of cytotoxic activity. All the molecules belonging to this cluster record a strong activity. The best cytotoxic activity was exhibited by compound having the ligand No. 11. Therefore, we suspected a possible correlation between the trifluoromethyl group and cytotoxic activity.
According to the goodness of fit statistics, the PLS regression equations exhibited a good agreement between fitted and observed biological activities. In addition, the Fstatistic test revealed the significance of both PLS equations. The values of bootstrapping correlation coefficient Rboots2 and leave-one-out cross-validation coefficient Q2Loo have revealed that the resulting models have good predictive power and robustness. Therefore, the developed PLS equations can be successfully applied to predict the antiproliferative activity against breast cancer cells lines of Benzothiazole derivatives. Certainly, this work will stimulate further experiments and theoretical investigations. Work is in progress in order to clarify the role of trifluoromethyl group for this class of molecules and to formulate more mechanistic interpretations for consolidating robustness of this QSAR modeling.
A. Sablji’c, H. Gu¨sten, H. Verhaar, and J. Hermens, QSAR modelling of soil sorption. Improvements and systematics of log Koc vs. log Kow correlations. Chemosphere. 31 (1995) 4489-4514. 00327-5
View ArticleH. Kubinyi, 3D QSAR in drug design: theory methods and applications. 1st edition, Springer Netherlands, 1994.
R. Mannhold, P. Krogsgaard-Larsen, and H. Timmerman, QSAR: Hansch analysis and related approaches, John Wiley & Sons, 2008. PMid:18990438
PubMed/NCBIA. Tropsha, Best practices for QSAR model development, validation, and exploitation. Molecular informatics. 29 (2010) 476-488. PMid:27463326
View Article PubMed/NCBIQ. Huang, J. Mao, B. Wan, Y. Wang, R. Brun, S.G. Franzblau, and A.P. Kozikowski, Searching for new cures for tuberculosis: design, synthesis, and biological evaluation of 2-methylbenzothiazoles. Journal of medicinal chemistry. 52 (2009) 6757-6767. PMid:19817445
View Article PubMed/NCBIR.V. Patel, P.K. Patel, P. Kumari, D.P. Rajani, and K.H. Chikhalia, Synthesis of benzimidazolyl-1, 3, 4-oxadiazol-2ylthio-N-phenyl (benzothiazolyl) acetamides as antibacterial, antifungal and antituberculosis agents. European journal of medicinal chemistry. 53 (2012) 41-51. PMid:22516426
View Article PubMed/NCBIV.N. Telvekar, V.K. Bairwa, K. Satardekar, and A. Bellubi, Novel 2-(2-(4aryloxybenzylidene) hydrazinyl) benzothiazole derivatives as anti-tubercular agents. Bioorganic & medicinal chemistry letters. 22 (2012) 649-652. PMid:22079026
View Article PubMed/NCBIT.H. Al-Tel, R.A. Al-Qawasmeh, and R. Zaarour, Design, synthesis and in vitro antimicrobial evaluation of novel Imidazo [1, 2-a] pyridine and imidazo [2, 1-b][1, 3] benzothiazole motifs. European journal of medicinal chemistry. 46 (2011) 1874-1881. PMid:21414694
View Article PubMed/NCBIS. Bondock, W. Fadaly, and M.A. Metwally, Synthesis and antimicrobial activity of some new thiazole, thiophene and pyrazole derivatives containing benzothiazole moiety. European journal of medicinal chemistry. 45 (2010) 3692-3701. PMid:20605657
View Article PubMed/NCBIV.S. Padalkar, V.D. Gupta, K.R. Phatangare, V.S. Patil, P.G. Umape, and N. Sekar, Synthesis of novel dipodal-benzimidazole, benzoxazole and benzothiazole from cyanuric chloride: Structural, photophysical and antimicrobial studies. Journal of Saudi Chemical Society. 18 (2014) 262-268.
View ArticleM. Singh, S.K. Singh, M. Gangwar, G. Nath, and S.K. Singh, Design, synthesis and mode of action of some benzothiazole derivatives bearing an amide moiety as antibacterial agents. RSC advances. 4 (2014) 19013-19023.
View ArticleA. Burger, and S. Sawhney, Antimalarials. III. Benzothiazole amino alcohols. Journal of medicinal chemistry. 11 (1998) 270-273.
View ArticleK.N. Venugopala, M. Krishnappa, S.K. Nayak, B.K. Subrahmanya, J.P. Vaderapura, R.K. Chalannavar, R.M. Gleiser, and B. Odhav, Synthesis and antimosquito properties of 2, 6-substituted benzo [d] thiazole and 2, 4-substituted benzo [d] thiazole analogues against Anopheles arabiensis. European journal of medicinal chemistry. 65 (2013) 295-303. PMid:23727539
View Article PubMed/NCBIX.Q. Deng, M.X. Song, C.X. Wei, F.N. Li, and Z.S. Quan, Synthesis and anticonvulsant activity of 7-alkoxy-triazolo-[3, 4-b] benzo [d] thiazoles. Medicinal Chemistry. 6 (2010) 313320.
View ArticleN. Siddiqui, S.N. Pandeya, S.A. Khan, J. Stables, A. Rana, M. Alam, M.F. Arshad, and M.A. Bhat, Synthesis and anticonvulsant activity of sulfonamide derivatives-hydrophobic domain. Bioorganic & medicinal chemistry letters. 17 (2007) 255-259. PMid:17046248
View Article PubMed/NCBIV.G. Ugale, H.M. Patel, S.G. Wadodkar, S.B. Bari, A.A. Shirkhedkar, and S.J. Surana, Quinazolino-benzothiazoles: fused pharmacophores as anticonvulsant agents. European journal of medicinal chemistry. 53 (2012) 107-113. PMid:22534186
View Article PubMed/NCBIS. Sarkar, J. Dwivedi, and R. Chauhan, Synthesis of 1-[2 (substituted phenyl)-4oxothiazolidin-3-yl]-3-(6-fluro-7-chloro-1, 3-benzothiazol-2-yl)-ureas as anthelmintic agent. Journal of Pharmacy Research. 7 (2013) 439-442.
View ArticleM. Sreenivasa, E. jaychand, B. Shivakumar, K. Jayrajkumar, and J. Vijaykumar, Synthesis of bioactive molecule flurobenzothiazole comprising potent heterocylic moieties for anthelmintic activity. Arch. Pharm. Sci. and Res. 1 (2009) 150-157.
C. Suresh, J.V. Rao, K. Jayaveera, and H. Subudhi, Synthesis and anthelminitc activity of 3 (2-hydrazino benzothiazoles)-substituted indole-2-one. IJPR. 2 (2011) 257-61.
N. Siddiqui, M. Alam, and A.A. Siddiqui, Synthesis and analgesic activity of some 2[4-(alkyl thioureido) phenyl sulphonamido]-6-substituted benzothiazoles. Asian Journal of Chemistry. 16 (2004) 1005.
E.M. Abbas, K.M. Amin, W.S. El-Hamouly, D.H. Dawood, and M.M. Abdalla, Synthesis, anti-inflammatory and antinociceptive activity of some novel benzothiazole derivatives. Research on chemical Intermediates. 41 (2015) 2537-2555.
View ArticleY.R. Lee, G.H. Jin, S.M. Lee, J.W. Park, J.H. Ryu, R. Jeon, and B.H. Park, Inhibition of TNF-α-mediated inflammatory responses by a benzodioxolylacetylamino-linked benzothiazole analog in human fibroblast-like synoviocytes. Biochemical and biophysical research communications. 4 (2011) 625-629. PMid:21530496
View Article PubMed/NCBIS. Pattan, C. Suresh, V. Pujar, V. Reddy, V. Rasal, and B. Koti, Synthesis and antidiabetic activity of 2-amino [5'(4-sulphonylbenzylidine)-2, 4-thiazolidinedione]-7-chloro6-fluorobenzothiazole. Indian Journal of Chemistry. 44 (2005) 2404-2408.
M.N. Noolvi, H.M. Patel, and M. Kaur, Benzothiazoles: search for anticancer agents. European journal of medicinal chemistry. 54 (2012) 447-462. PMid:22703845
View Article PubMed/NCBIK. Ahmed, M.A. Syed, and S.M. Mohamed, Therapeutic potential of benzothiales: a patent review (2010-2014). Expert opinion on therapeutic patents. 25 (2015) 335-349. PMid:25579497
View Article PubMed/NCBID. Osmaniye, S. Levent, C.M. Ardic, O. Atli, Y. Ozkay, and Z.A. Kaplancikli, Synthesis and anticancer activity of some novel benzothiazole-thiazolidine derivatives. Phosphorus, Sulfur, and Silicon and the Related Elements. 193 (2018) 249-256.
View ArticleN. Uremis, N.M. Uremis, F.I. Tolun, M. Ceylan, A. Doganer, and A.H. Kurt, Synthesis of 2-Substituted Benzothiazole Derivatives and Their In Vitro Anticancer Effects and Antioxidant Activities Against Pancreatic Cancer Cells. Anticancer research. 37 (2017) 6381-6389. PMid:29061823
PubMed/NCBID. Havrylyuk, L. Mosula? B. Zimenkovsky, O. Vasylenko, A. Gzella, and R. Lesyk, Synthesis and anticancer activity evaluation of 4-thiazolidinones containing benzothiazole moiety. European journal of medicinal chemistry. 45 (2010) 5012-5021. PMid:20810193
View Article PubMed/NCBIS. Saeed, R. Naghmana, P.G. Jones, M. Ali, and R. Hussain, Synthesis, characterization and biological evaluation of some thiourea derivatives bearing benzothiazole moiety as potential antimicrobial and anticancer agents. European Journal of Medicinal Chemistry. 45 (2010) 1323-1331. PMid:20056520
View Article PubMed/NCBII.E. Frank, and J.H. Friedman, A Statistical View of some Chemometrics Regression Tools. Technometrics, 35 (1993) 109-135.
View ArticleC. Hansch, and H. Gao, Comparative QSAR: Radical Reactions of Benzene Derivatives in Chemistry and Biology. Chem. Rev., 97 (1997) 2995-3060. PMid:11851484
View Article PubMed/NCBIL. Di, and E.H. Kerns, Drug-like properties: concepts, structure design and methods from ADME to toxicity optimization. Academic Press of Elevier, 2015.
K. Roy, S. Kar, and R.N. Das, A primer on QSAR/QSPR modeling: Fundamental concepts, Springer New York, 2015.
View ArticleA.K. El-Damasy, J.-H. Lee, S.H. Seo, N.-C. Cho, A.N. Pae, and G. Keum, Design and synthesis of new potent anticancer benzothiazole amides and ureas featuring pyridylamide moiety and possessing dual B-RafV600E and C-Raf kinase inhibitory activities. European journal of medicinal chemistry. 115 (2016) 201-216. PMid:27017549
View Article PubMed/NCBIHyperChem, 8.08 for windows, Molecular modelling system Hypercube, Inc., 1115NW, 4th Street Gainesville, FL 32601, USA 2008.
M.J. Frisch, G.W. Trucks, H.B. Schlegel et al., Gaussian 09, revision A.1. Gaussian Inc. Wallingford CT, 27 (2009) 34.
Molecular Operating Environment (MOE), 2013.08; Chemical Computing Group Inc. 1010 Sherbooke St. West, Suite # 910, Montreal QC, Canada H3A 2R7, 2014.
R. Todeschini, and V. Consonni, Handbook of molecular descriptors. Vol. 11. John Wiley & Sons, 2008.
T. Lumley, and A. Miller, Leaps : Regression Subset Selection. R package version 3.0 (2017),
View ArticleG. James, D. Witten, T. Hastie, and R. Tibshirani, An Introduction to Statistical Learning : with Applications in R, Springer New York, 2013.
View ArticleA. Hoskuldsson, A combined theory for PCA and PLS. J. Chemometr., 9 (1995) 91-123.
View ArticleF. Husson, J. Josse, and S. Le, FactoMineR : Factor Analysis and Data Mining with R. R package version 1.01 (2006), .
View ArticleA. Kassambara, and F. Mundt, Factoextra :Extract and Visualize the Results of Multivariate Data Analysis. R package version 1.05 (2017),
View ArticleP. Rousseeuw, A. Struyf and M. Hubert, Cluster : Finding Groups in Data : Cluster Analysis. R package version 2.06 (2017), .
View ArticleF. Husson, S. L^e, and J. Pag`es, Exploratory Multivariate Analysis by Example Using R. Chapman & Hall. 2010.
View ArticleS. L^e, J. Josse, and F. Husson, FactoMineR : An R package for multivariate analysis. Journal of statistical software. 25 (2008) 1-18.
L. Lebart, A. Morineau, and M. Piron, Statistique Exploratoire Multidimensionnelle. Dunod Paris, 1997.
A. Hoskuldsson, PLS regression methods. J. Chemometr., 2 (1988) 211-228.
View ArticleJ.O. Rawlings, S. G. Pantula, and D. A. Dickey, Applied Regression Analysis : A Research Tool, 2nd edition, Springer New York, 1998.
View ArticleR. Veerasamy, H. Rajak, A. Jain, S. Sivadasan, C. P. Varghese, and R. K. Agrawal, Validation of QSAR Models-Strategies and Importance. International Journal of Drug Design and Discovery. 2 (2011) 511-519.
K. Muller, and C. Diederich, Fluorine in pharmaceuticals looking beyond intuition, Science. 317 (2007) 1881-1886.
P. Kirsch, Modern Fluoroorganic Applications. Wiley-VCH, Weinheim, 2004.
View ArticleN. Melkemi, and S. Belaidi, Structure-Property Relationships and Quantitative StructureActivity Relationship Modeling of Detoxication Properties of some 1,2-Dithiole-3-Tione Derivatives. J. Comput. Theor. Nanosci. 11 (2014) 1-6.
View Article