Yusuke Sako
E-mail address: dl15101@st2.pharm.kitasato-u.ac.jp
Shuichi Hirono
E-mail address: hironos@pharm.kitasato-u.ac.jp
© 2019 Sift Desk Journals. All Rights Reserved
VOLUME: 3 ISSUE: 1
Page No: 212-220
Yusuke Sako
E-mail address: dl15101@st2.pharm.kitasato-u.ac.jp
Shuichi Hirono
E-mail address: hironos@pharm.kitasato-u.ac.jp
Yusuke Sako*, Noriyuki Yamaotsu, Shuichi Hirono *
School of Pharmacy, Kitasato University, 5-9-1 Shirokane, Minato-ku, Tokyo 108-8641, Japan
Salvatore Ferla(ferlaS1@cardiff.ac.uk)
Michael M Hann(mike.m.hann@gsk.com)
Yanling Zhang(zhangyanling@bucm.edu.cn)
Yusuke Sako, Virtual screening for small-molecule inhibitors of PD-1/PD-L1 protein-protein interaction using in silico fragment mapping method(2018)SDRP Journal of Computational Chemistry & Molecular Modelling 2(4)p:212-220
Inhibition of the immunity checkpoint pathway of PD-1/PD-L1 by monoclonal antibodies is effective in the clinical treatment of certain cancers and several anti-PD-1 and anti-PD-L1 antibodies have been approved for therapeutic use. Against this background, attention has now focused on the search for small molecule inhibitors of PD-1/PD-L1 protein-protein interaction (PPI). In this study, we have performed a virtual screening for such small molecule inhibitors using PD-1 as a target. First, a 3D feature query for the screening was constructed making the most of the in silico fragment mapping method, and then the 3D feature query-based virtual screening of a commercial compound database was carried out. The compounds selected from the screening were then subjected to an in vitro assay (ELISA) to test for PPI inhibitory ability against PD-1/PD-L1. As a result of the assay, one molecule was identified to be a potential seed compound for small molecule PD-1/PD-L1 inhibitors.
Key words: Fragment-based drug discovery, in silico fragment mapping, PD-1/PD-L1 inhibitor, virtual screening
Recently our group developed a novel in silico fragment mapping method [1]. Initially, a database was created, known as Canonical Subsite Fragment DataBase (CSFDB), comprising pairs of subsite-fragments derived from X-ray crystal structures of known protein-ligand complexes. In addition, a fragment-mapping program, Fsubsite, was developed to map chemical groups (fragments) onto a protein surface. When we have a 3D structure of a target protein, Fsubsite searches for similar subsites on that surface from CSFDB. If a similar subsite is found, fragments combined with the subsite in CSFDB are placed onto the target protein surface. Thus, this method acts as a knowledge-based fragment mapping tool. In a previous study that validated that the procedure was able to identify appropriate fragments mapped onto the target protein [1]. These findings suggested that the method could be utilized for the construction of 3D feature queries for virtual screening. Here, we applied this method to identify small molecules that inhibit PD-1/PD-L1 protein-protein interaction.
PD-1 (programmed death-1) is expressed on the surface of activated T cells and is associated with apoptosis [2]. PD-L1, a ligand of PD-1, is naturally expressed on the surface of antigen presenting cells. PD-1 and PD-L1 are immune checkpoint proteins that act as suppressors to suppress T cell responses. The immune checkpoint pathway is normally suppressed by interaction between PD-1 and PD-L1, which maintains self-tolerance and limits collateral tissue damage [3]. However, cancer cells also express PD-L1 and utilize its immunosuppression function to avoid being killed by T cells [4-5]. When T cells are repeatedly exposed to tumor antigens expressing PD-L1, they lose their ability to attack cancer cells [6-7]. The scenario outlined here is considered to be a mechanism related to cancer immune evasion [8-9].
In recent years, anticancer treatment based around the inhibition of the immunity checkpoint pathway by targeting PD-1/PD-L1 interaction has been the focus of intense research. Indeed immunotherapy with monoclonal antibodies based on the inhibition mechanism can bring about the effect of anti-tumor (i.e. suppression and attenuation of cancer cell proliferation/infiltration) and long-term remission in patients with various cancer types [10-14]. To date, the U.S. Food and Drug Administration (FDA) has approved two anti-PD-1 antibodies, nivolumab (Opdivo, Bristol-Myers Squibb) and pembrolizumab (Keytruda, Merck), together with three anti-PD-L1 antibodies, atezolizumab (Tecentriq, Genentech/Roche), durvalumab (Imfinzi, AstraZeneca) and avelumab (Bavencio, EMD Serono, Inc.).
By contrast, development of small molecule inhibitors of the PD-1/PD-L1 pathway is at a relatively early stage by comparison to antibody drugs. Indeed, there are only a few reports of such small molecule inhibitors [15-17]. For example, small compounds have been reported that stabilize dimer formation of PD-L1 and exhibit PD-1/PD-L1 inhibitory activity [18-21]. In addition, cyclic peptides have also been reported that bind to the PPI interface on PD-L1 to directly inhibit PPI of PD-1/PD-L1 interaction [22-23]. The advantages of small molecules over antibody drugs are that production costs are kept low, oral administration is possible, and immunogenicity problems can be eliminated. For these reasons, development of small molecule PPI inhibitors of PD-1/PD-L1 has attracted a great deal of attention.
In this study we aimed to identify small molecule PPI inhibitors of PD-1/PD-L1 using an in silico screening approach. The PPI interface is a wide shallow surface similar to the PD-1/PD-L1. Although PD-1/PD-L1 PPI is generally acknowledged to be a highly difficult drug discovery target for small molecule inhibitors, we made a pharmacophore hypothesis using an in silico fragment mapping method with PD-1 as the target. We then performed 3D feature query-based virtual screening for small molecule PPI inhibitors of PD-1/PD-L1.
2.1. In silico fragment mapping method
To make a pharmacophore hypothesis for exploring PPI inhibitors of PD-1/PD-L1, we performed Fsubsite using CSFDB. The outlines of CSFDB and Fsubsite are described below.
2.1.1. CSFDB
It is considered that subsites on proteins to which similar atomic groups bind have similarities between them. Based on this idea, the ligands in the known protein-ligand X-ray crystal structure database were divided into fragments and amino acid residues were also extracted in the vicinity of those fragments as subsites (Figure 1). Specifically, 3D structures of protein-ligand complexes in PDBbind v.2013 core set were used to create a subsite-fragment database. The database was composed of 195 protein-ligand complexes in 65 protein clusters. Ligands in the database were divided into fragments using Fragmenter of JChem 6.3.0 (ChemAxon Ltd., Budapest, Hungary, 2014). A set of residues within 4 Å of each fragment were defined as the subsite using SYBYL-X 2.1.1 (Certara, L. P., Princeton, NJ, USA, 2013). Finally similar subsites of the subsite-fragment set were grouped into one representative subsite and 482 subsite-fragment pairs were obtained as CSFDB.
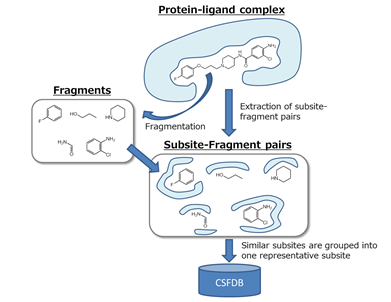
Figure 1: Conceptual diagram illustrating CSFDB.
2.1.2. Fsubsite
The Fsubsite program superposes each subsite of CSFDB onto the mapping surface of a target protein using SUPERPOSE algorithm [24]. The Fsubsite represents functional groups of amino acids as property spheres of five types based on their physicochemical properties as follows: hydrophobicity, aromatic ring structure, hydrogen-bond donor, hydrogen-bond acceptor and hydrogen-bond donor/acceptor. Using the above rules, the surface of the target protein is searched in the CSFDB database. Once a similar subsite is found, a fragment bound to the subsite in CSFDB is mapped onto the target protein. This knowledge based in silico fragment mapping method and the schematic procedure for fragment mapping by Fsubsite is shown in Figure 2.
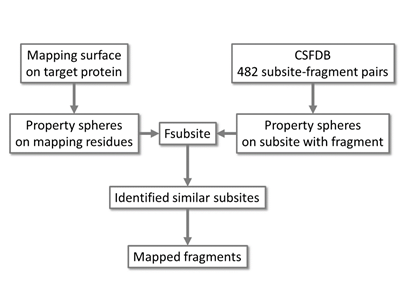
Figure 2: Schematic of the procedure for in silico fragment mapping.
2.2. 3D feature query construction and 3D feature query-based virtual screening
The workflow of this study is shown in Figure 3. Initially, we set the mapping surface for Fsubsite using human apo PD-1 (PDB ID: 3RRQ). In silico fragment mapping using Fsubsite was then performed on the set mapping surface. In addition we prioritized the mapped fragments and constructed a 3D feature query based on the selected representative fragments. Using the query obtained in this way, candidate compounds were selected by performing 3D feature query-based virtual screening of commercially available compound database. Finally, these compounds were purchased and an in vitro assay was performed to check their ability to inhibit PPI between human PD-1/human PD-L1.
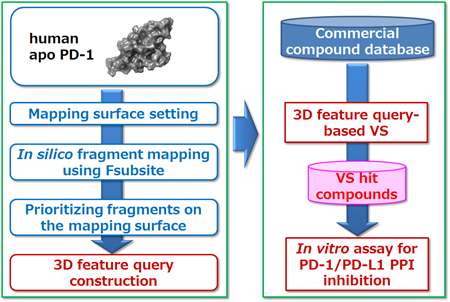
Figure 3: Workflow of 3D feature query construction and 3D feature query-based virtual screening.
3.1. In silico fragment mapping method
3.1.1. Mapping surface setting
Using human apo PD-1 (PDB ID: 3RRQ) as an analysis target, the mapping surface was set according to the following procedure. When this study was initiated, the complex structure of human PD-1/human PD-L1 (PDB ID: 4ZQK) had not been solved. Alternatively, two complex structures of mouse PD-1/human PD-L1 (PDB ID: 3BIK, 3SBW) had been solved. Hence, using the mouse PD-1/human PD-L1 (PDB ID: 3BIK, 3SBW), amino acid residues of mouse PD-1 within 6 Å from each human PD-L1 were extracted (i.e. amino acid residues close to the PPI interface of mouse PD-1). Then we compared amino acid sequences of mouse and human PD-1. Based on the above information we set the mapping surface on 3RRQ. The resulting mapping surface is shown in Figure 4 highlighted in magenta.
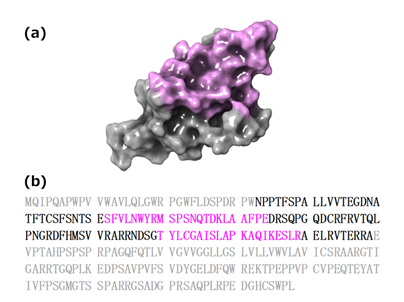
Figure 4: (a) Molecular surface of hPD-1 with the mapping region highlighted in magenta. (b) Full length sequence of hPD-1 (Uniprot Q15116). Residues highlighted in magenta correspond to amino acids making up the mapping surface. Residues shown in grey correspond to amino acids that cannot be assigned in the crystal structure.
3.1.2. Fragment mapping results using Fsubsite and prioritizing fragments on the mapping surface
Using the mapping surface, a similar subsite was searched from CSFDB. Where a similar subsite was found, a fragment bound to the subsite in that database was then mapped onto the mapping surface. Using this procedure, 353 fragments were mapped onto the mapping surface as shown in Figure 5 (a). Next, for each fragment, a complex model with hPD-1 was constructed and then minimization was performed using macromodel (Schrodinger 2015-2). At this stage, position restraints were applied to the protein heavy atoms with 100 kcal/mol. The rmsd of heavy atoms in each fragment before and after minimization were also measured. Those with a value of more than 3Å were eliminated from the screen (i.e. fragments that did not fit their subsites). Furthermore, for each hPD-1/fragment complex model that satisfied the above threshold, the binding free energy was calculated using prime_mmgbsa (Schrodinger 2015-2, job_type=ENERGY). Finally the top 20 fragments of MM/GBSA values were extracted as representative fragments (Figure 5 (b)).
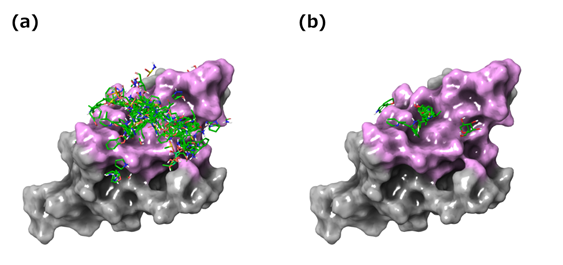
Figure 5: In silico fragment mapping results. (a) 353 fragments mapped on the mapping surface. (b) Twenty selected representative fragments mapped on the mapping surface.
3.2. 3D feature query construction and 3D feature query-based virtual screening
3.2.1. 3D feature query construction
Based on the representative fragments, a 3D feature query was constructed according to the following procedure (using MOE 2012 Pharmacophore Editor). Procedure 1: Representative fragments were classified into five sites based upon visual inspection of their arrangement on the mapping surface (Figure. 6 (a)). Procedure 2: At each site, a hydrophobic feature was positioned such that all of the hydrophobic groups of the fragments would fit. Procedure 3: The polar feature corresponding to the polar functional group of each fragment was positioned. In this case, the same kind of features gathered by a sphere of radius ≤2.5 Å were combined into one. Procedure 4: An excluded volume feature was placed on heavy atoms of amino acid residues belonging to the mapping surface. As a result, the 3D feature query shown in Figure 6 (b) was constructed.
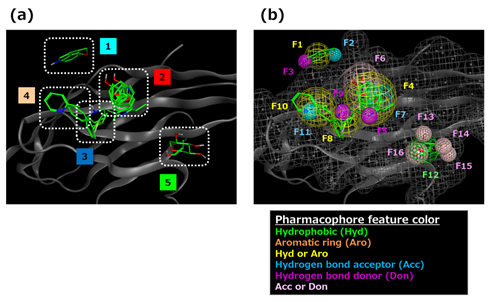
Figure 6: 3D feature query construction results. (a) Clustered representative fragments. (b) 3D feature query. Green indicates hydrophobic feature (Hyd); yellow indicates Hyd or aromatic ring feature (Aro); cyan indicates hydrogen bond acceptor feature (Acc); purple indicates hydrogen bond donor feature (Don); pink indicates Acc or Don. Each feature is numbered respectively. Gray colored mesh shows the excluded volume feature.
3.2.2. Protocol for 3D feature query-based virtual screening
Table 1 shows the protocol for virtual screening using the constructed 3D feature query. This was a prerequisite to satisfy the hydrophobic feature and at least one polar feature of site 2 located at the center of five sites. An additional prerequisite was that the hydrophobic feature of one of the remaining four sites had to be satisfied. Compounds with a total score of 3 or more were considered to meet the requirements of a hit in the 3D feature query-based virtual screening.
Table 1: Protocol for 3D feature query-based virtual screening.
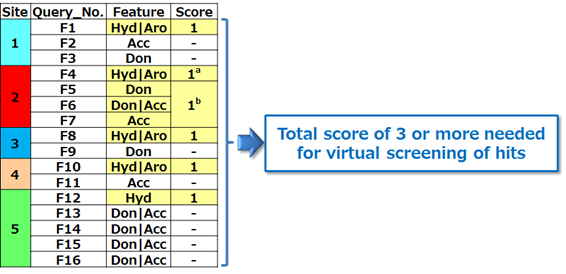
a Essential feature. b At least one of three features is essential.
3.2.3. 3D feature query-based virtual screening
In order to explore the inhibition of PPI between hPD-1/hPD-L1 meditated by small compounds, a 3D feature query-based virtual screening procedure was carried out according to the protocol shown in Figure 7. Firstly, up to 200 conformations per compound were generated using Omega (version 2.4.6 OpenEye) for commercial compounds (Namiki, about 5 million compounds). Next, a pharmacophore search (MOE 2012) was performed using the 3D feature query for the obtained conformations and about 2 million compounds satisfying the requirements of the protocol described above were extracted. Docking simulation was performed for the extracted compounds using GOLD (version 5.2 CCDC) with the amino acid residues on the mapping surface of hPD-1 as the search region. From the docking output, 2,397 compounds satisfying the requirements of the aforementioned protocol and Chemscore (value of ≥15) were extracted. A complex model of these compounds and hPD-1 was then constructed. After minimization using macromodel (Schrodinger 2015-2) to optimize each complex model, binding free energy (MM/GBSA) was calculated using prime_mmgbsa (Schrodinger 2015-2, job_type=ENERGY). For 95 compounds with the highest binding affinity values, structural clustering using Cluster Molecules module (Pipeline Pilot 9.1, FCFP_6) was performed. Availability of the compound was also verified. Finally, eight candidate compounds shown in Figure 8 were selected.
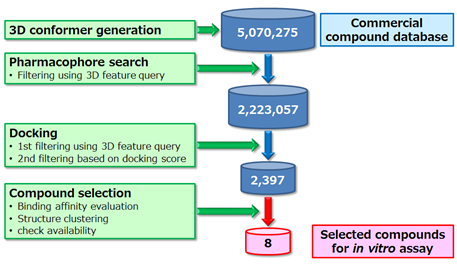
Figure 7: Overview of 3D feature query-based virtual screening.
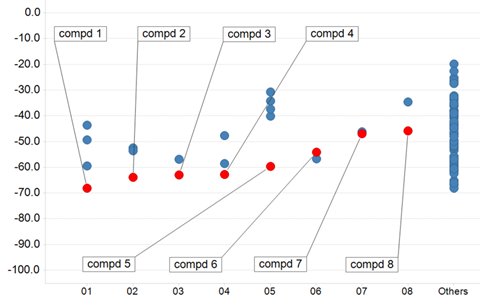
Figure 8: 3D feature query-based virtual screening results. Vertical axis indicates MM/GBSA value (kcal/mol). Horizontal axis indicates molecular clusters. Red plots correspond to selected compounds used in the in vitro assay.
3.3. Assay results of in vitro hPD-1/hPD-L1 PPI inhibition
Selected compounds were subjected to an in vitro assay (ELISA) in order to evaluate their ability to inhibit hPD-1/hPD-L1 PPI. This assay was carried out at BPS Bioscience. (Catalog #72005, hPD-1[Biotinylated]:hPD-L1 Inhibitor Screening Assay Kit). Each compound was made up at a concentration of 100 uM and biotinylated hPD-1 was mixed with hPD-L1 immobilized on a plate. The plate was then incubated for 2 hours at room temperature. After washing the plate, streptavidin-HRP (horseradish peroxidase), which is a luminescent label, was added and the degree of luminescence measured. The above test was performed twice on eight compounds. These experiments confirmed that compound 3 inhibits PPI of hPD-1/hPD-L1 at an inhibition rate of 21% (Table 2). The following analysis was carried out to confirm whether the inhibitory activity is influenced by PAINS or compound aggregation. We applied the PAINS filter of Schrodinger 2018-1 CANVAS to our hit compound, it passed through the filter. Then, we performed Schrodinger 2018-1 QikProp to our hit compound and as the result its predicted aqueous solubility (QPlogS) is -5.54 within recommended range (from -6.5 to 0.5). For the reasons mentioned above, we think that the risk of false positive is low.
Table 2: In vitro assay results of hPD-1/hPD-L1 PPI inhibition.
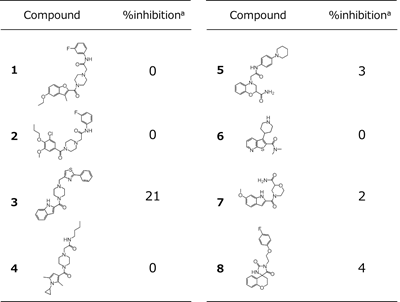
a Values represent the mean of two experiments.
3.4. Complex model of hPD-1/compound 3 and the interaction mode
A complex model of hPD-1 and compound 3, which displayed inhibitory activity, is shown in Figure 9. The cationic nitrogen atom of piperazine ring of compound 3 forms an ionic interaction with the E136 side chain of hPD-1. There is also a hydrogen bond between the carbonyl group of the amide bond of compound 3 and the Y68 side chain of hPD-1. In terms of nonpolar interactions, there is π - π interaction between the indole ring of compound 3 and the Y68 side chain of hPD-1. In addition, the piperazine ring is surrounded by hydrophobic amino acid residues, such as M70, L122 and I134, which are involved in van der Waals interactions.
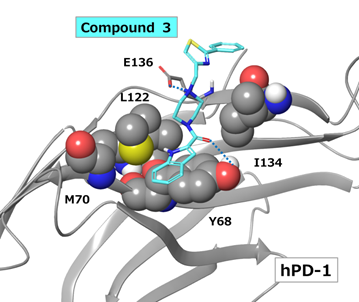
Figure 9: Docking model of compound 3 bound to hPD-1. Blue dashed lines indicate ionic interactions or hydrogen bonds.
Because the X-ray crystal structure of human PD-1/human PD-L1 (PDB ID: 4ZQK) is now also solved, we are able to examine the protein-protein interaction site. The crystal structure of hPD-1/hPD-L1 was overlapped with the hPD-1/compound 3 complex model. Specifically, the function of Schrodinger 2015-2 structure alignment was used and superposition of each hPD-1 protein backbone was performed. Based on the overlaid structures the interaction mode between compound 3 and hPD-L1 toward hPD-1 was compared as shown in Figure 10. As noted above, the nitrogen atom of the piperazine ring of compound 3 forms an ionic interaction with E136 of hPD-1. Likewise, R113 of hPD-L1 also forms an ionic interaction with E136 of hPD-1. In addition, Compound 3 overlaps with Y123 of hPD-L1. It is considered that Compound 3 fills the subsite where Y123 belongs in the complex of hPD-1/hPD-L1. Nonetheless, hydrogen bond interaction and π-π interaction with the hPD-1 Y68 side chain in the complex model of hPD-1/compound 3 were not observed in the hPD-1/hPD-L1 crystal structure. We also compared the results of the 3D feature query and in silico fragment mapping with the hPD-1/compound 3 complex model. As shown in Figure 11 (a), compound 3 satisfied the hydrogen bond donor/acceptor feature (F6), the hydrogen bond acceptor feature (F7) and two hydrophobic features (F4, F8). Thus, compound 3 appears to mimic the interaction between hPD-1 E136 and hPD-L1 R113. This interaction may contribute to the expression of inhibitory activity displayed by compound 3. Hence, the method adopted in this study is effective for detecting key pharmacophores. Furthermore, from the comparison in silico fragment mapping result with the hPD-1/compound 3 complex model, two sites (site 1 and 4) were identified where fragments mapped near compound 3 (Figure 11 (b)). By optimizing the interaction based on the results for compound 3 so as to satisfy these site features, it may be possible to identify compounds with greater inhibitory activity. Thus, although compound 3 has relatively low hPD-1/hPD-L1 inhibition activity, we believe that the approach used in this study can be further optimized to develop small molecules that are effective in PD-1/PD-L1 immune checkpoint blockade.
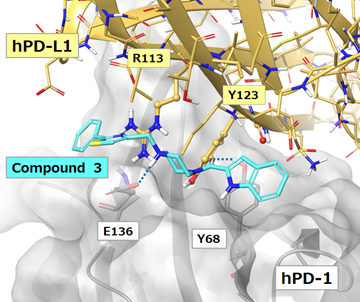
Figure 10: hPD-L1 overlaid on the hPD-1/compound 3 docking model. Blue dashed lines indicate ionic interactions or hydrogen bonds.
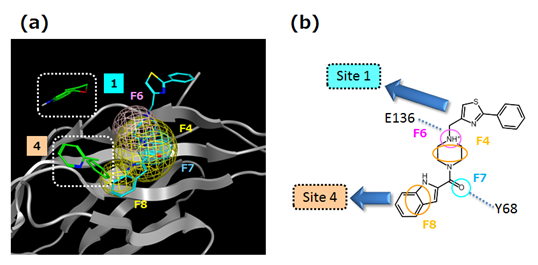
Figure 11: (a) Comparison between hPD-1/compound 3 docking model and the 3D feature query and in silico fragment mapping result. (b) Schematic picture of (a).
To explore PPI inhibitors of hPD-1/hPD-L1, we constructed a 3D feature query using an in silico fragment mapping method targeting the hPD-1 apo structure followed by 3D feature query-based virtual screening. As a result, a small compound that inhibits PPI of hPD-1/hPD-L1 was identified. Our findings show that the in silico fragment mapping method is an effective means of identifying such inhibitors. Furthermore, by using this method, it is possible to create a 3D feature query that can elucidate likely pharmacophores on the target structure. We anticipate that this novel methodology will to be utilized to identify hit compounds and for lead optimization.
This work was supported in part by the Japan Society for the Promotion of Science KAKENHI (Grant No. 15K07899).
Yamaotsu, N.; Hirono, S. In silico fragment-mapping method: a new tool for fragment-based/structure-based drug discovery. J Comput Aided Mol Des, 32(11), 1229-1245 (2018). PMid:30196523
View Article PubMed/NCBIIshida, Y.; Agata, Y.; Shibahara, K.; Honjo, T. Induced expression of PD-1, a novel member of the immunoglobulin gene superfamily, upon programmed cell death. EMBO J. 1992, 11, 3887-3895.
View ArticleRiella, L.V.; Paterson, A. M.; Sharpe, A. H.; Chandraker, A. Role of the PD-1 pathway in the immune response. Am J Transplant. 2012, 12, 2575-2587.
View ArticleOstrand-Rosenberg, S.; Horn L. A.; Haile, S. T. The programmed death-1 immune-suppressive pathway: barrier to antitumor immunity. J Immunol. 2014, 193, 3835-3841.
View ArticleWang, X.; Teng, F.; Kong, L.; Yu, J. PD-L1 expression in human cancers and its association with clinical outcomes. Onco Targets Ther. 2016, 12, 5023-5039.
View ArticleBarber, D. L, Wherry, E. J.; Masopust, D.; Zhu, B.; Allison, J. P.; Sharpe, A. H.; Freeman, G.J. Restoring function in exhausted CD8 T cells during chronic viral infection. Nature 2006, 439, 682-687.
View ArticleCatakovic, K.; Klieser, E.; Neureiter, D.; Geisberger, R. T cell exhaustion: from pathophysiological basics to tumor immunotherapy. Cell Commun Signal. 2017, 15, 1-16.
View ArticleKim, R.; Emi, M.; Tanabe, K. Cancer immunoediting from immune surveillance to immune escape. Immunology. 2007,121, 1-14.
View ArticleVinay, D. S.; Ryan, E. P.; Pawelec, G.; Talib, W. H.; Stagg, J.; Elkord, E.; Lichtor, T.; Decker, W. K.; Whelan, R. L.; Kumara, H. M. C. S.; Signori, E.; Honoki, K.; Georgakilas, A. G.; Amin, A.; Helferich, W. G.; Boosani, C. S.; Guha, G.; Ciriolo, M. R.; Chen, S.; Mohammed, S. I.; Azmi, A. S.; Keith, W. N.; Bilsland, A.; Bhakta, D.; Halicka, D.; Fujii, H.; Aquilano, K.; Ashraf, S. S.; Nowsheen, S.; Yang X.; Choi B. K.; Kwon, B. S. Immune evasion in cancer: Mechanistic basis and therapeutic strategies. Semin Cancer Biol. 2015, 35, S185-S198.
View ArticleDömling, A.; Holak, T. A. Programmed death-1: therapeutic success after more than 100 years of cancer immunotherapy. Angew Chem Int Ed Engl. 2014, 53, 2286-2288.
View ArticleTopalian, S. L.; Drake, C. G.; Pardoll, D. M. Immune Checkpoint Blockade: A Common Denominator Approach to Cancer Therapy. Cancer Cell 2015, 27, 450−461.
View ArticleShin, D. S.; Ribas, A. The evolution of checkpoint blockade as a cancer therapy: what's here, what's next? Curr Opin Immunol. 2015, 33, 23-35.
View ArticleSharma, P.; Allison, J. P. The future of immune checkpoint therapy. Science 2015, 348, 56-61.
View ArticleHoos, A. Development of immuno-oncology drugs - from CTLA4 to PD1 to the next generations. Nat Rev Drug Discov. 2016, 15, 235-47.
View ArticleWeinmann, H.; Cancer Immunotherapy: Selected Targets and Small- Molecule Modulators. ChemMedChem 2016, 11, 450−466.
View ArticleZarganes-Tzitzikas, T.; Konstantinidou, M.; Gao, Y.; Holak, T. A.; Krzemien, D.; Zak, K.; Dubin, G.; Dömling, A. Inhibitors of Programmed Cell Death 1 (PD-1): A Patent Review (2010−2015). Expert Opin. Ther. Pat. 2016, 26, 973−977.
View ArticleZhan, M.M.; Hu, X. Q.; Liu, X. X.; Ruan, B. F.; Xu, J.; Liao, C. From Monoclonal Antibodies to Small Molecules: The Development of Inhibitors Targeting the PD-1/PD-L1 Pathway. Drug Discovery Today 2016, 21, 1027−1036.
View ArticleChupak, L. S.; Zheng, X. Compounds Useful as Immunomodulators. WO2015034820, March 2015.
Chupak, L. S.; Ding, M.; Martin, S. W.; Zheng, X.; Hewawasam, P.; Connolly, T. P.; Xu, N.; Yeung, K.-S.; Zhu, J.; Langley, D. R.; Tenney, D. J.; Scola, P. M.; Mingo, P. A. Compounds Useful as Immunomodulators. WO2015160641, October 2015.
Guzik, K.; Zak, K. M.; Grudnik, P.; Magiera, K.; Musielak, B.; Törner, R.; Skalniak, L.; Dömling, A.; Dubin, G.; Holak, T. A. Small-Molecule Inhibitors of the Programmed Cell Death-1/Programmed Death-Ligand 1 (PD-1/PD-L1) Interaction via Transiently Induced Protein States and Dimerization of PD-L1. J. Med. Chem. 2017, 60, 5857–5867.
View ArticleSkalniak, L.; Zak, K.M.; Guzik, K.; Magiera, K.; Musielak, B.; Pachota, M.; Szelazek, B.; Kocik, J.; Grudnik, P.; Tomala, M.; Krzanik, S.; Pyrc, K.; Dömling, A.; Dubin, G.; Holak, T.A. Small-molecule inhibitors of PD-1/PD-L1 immune checkpoint alleviate the PD-L1-induced exhaustion of T-cells. Oncotarget. 2017, 8, 72167-72181.
View ArticleMiller, M. M.; Mapelli, C.; Allen, M. P.; Bowshe, M. S.; Boy, K. M.; Gillis, E. P.; Langley, D. R.; Mull, E.; Poirier, M. A.; Sanghvi, N.; Sun, L. Q.; Tenney, D. J.; Yeung, K. S.; Zhu, J.; Reid, P. C.; Scola, P. M.; Cornelius, L. A. (Bristol-Myers Squibb Company) US20140294898 A1,October 2014.
Magiera-Mularz, K.; Skalniak, L.; Zak, K. M.; Musielak, B.; Rudzinska-Szostak, E.; Berlicki, Ł.; Kocik, J.; Grudnik, P.; Sala, D.; Zarganes-Tzitzikas, T.; Shaabani, S.; Dömling, A.; Dubin, G.; Holak, T. A. Bioactive Macrocyclic Inhibitors of the PD-1/PD-L1 Immune Checkpoint. Angew Chem Int Ed Engl. 2017, 56, 13732-13735.
View ArticleIwase, K.; Hirono, S. Estimation of active conformations of drugs by a new molecular superposing procedure. J. Comput. Aided Mol. Des. 1999, 13, 499-512.
View Article