Shoulei Yan
Email: yanshoulei1225@mail.hzau.edu.cn
Tel: +86 18986065200
© 2019 Sift Desk Journals. All Rights Reserved
VOLUME: 6 ISSUE: 3
Page No: 380-390
Shoulei Yan
Email: yanshoulei1225@mail.hzau.edu.cn
Tel: +86 18986065200
Yanzhao Liua, 1, Gongji Liua, 1, Li Lia, Shoulei Yana ,b, c*, Jie Lia, b
a College of Food Science and Technology, Huazhong Agriculture University, Wuhan 430070, People’s Republic of China
b Engineering Research Center of Green development for Conventional Aquatic Biological Industry in the Yangtze River Economic Belt, Ministry of Education, Wuhan 430070, People’s Republic of China .
c Aquatic Vegetable Preservation and Processing Technology Engineering Center of Hubei Province, Wuhan 430070, People’s Republic of China
Qin Z(qinzhao505@163.com)
Omagari R(omagari.ryo@nies.go.jp)
Fra%C5%84ski R(franski@amu.edu.pl)
Ueno D(uenod@cc.saga-u.ac.jp)
Yanzhao Liu, Gongji Liu, Li Li, Shoulei Yan, Jie Li, Comparative Analysis of Volatile Flavor Compounds of Different Pot-stewed Lotus Rhizomes by SPME-GC-MS and E-nose (2021) Journal of Food Science & Technology 6(3) :380-390
Electronic nose and gas chromatography-mass spectrometry (GC-MS) were used to analyze the volatile flavor compounds of pot-stewed lotus rhizomes made in the laboratory (PSLR) and other three samples sold in the market. Principal component analysis (PCA) of the electronic nose and GC-MS data suggested that lotus rhizome stewed in laboratory has unique flavor. There were 65 kinds of volatile flavor components in PSLR (sample A), 51 kinds in sample B, 49 kinds in sample C and 41 kinds in sample D. There were 25 kinds of common components in four pot-stewed lotus rhizomes, such as β - myrcene, d-limonene, β - ocimene, α - terpinene, γ – terpinene, linalool, (-) - 4-terpineol, α - terpineol, anethol and eugenol. The principal component analysis (PCA) can find out the characteristic components which determine the flavor of different pot-stewed lotus rhizome products, and the overall flavor of PSLR samples is better than that of market products.
Key words: Pot-stewed lotus rhizome; Volatile flavor components; Gas chromatography–mass spectrometry technology; Principal component analysis
Lotus rhizome (Nelumbo nucifera Gaertn.), which belongs to the nymphaeaceae family of perennial aquatic vegetables, is widely grown as a non-conventional vegetable in China, India, Japan and Australia (Thanushree et al., 2017). As an aquatic vegetable, lotus rhizome contains a large amount of carbohydrates (Man et al., 2012), as well as a variety of active ingredients such as dietary fiber (H. Chen et al., 2018) and polyphenols (Hu & Skibsted, 2002). However, due to its high contents of water and polyphenol oxidase, lotus rhizome is prone to rot and suffer from enzymatic browning, which causes great difficulty in the storage and quality maintenance of lotus rhizomes (Lara et al., 2020). Therefore, effective preservation and processing of lotus rhizomes have become a focus in the related research on lotus rhizomes (Du et al., 2009). Currently, there are varieties of lotus rhizome products on the market, such as boiled or salted lotus rhizome and lotus rhizome powder or beverage, and the nutrition and taste are continuously improved to meet the needs of consumers.
Pot-stewed products are appetizers of Chinese traditional flavor made from vegetables and meats with various spices, seasonings and soup stock (K. Ye et al., 2017; Keping Ye et al., 2017). One of the keys that determine the quality of pot-stewed products is the technique of controlling the flavor. During the pot stewing process, salty, sweet and umami seasonings are added to adjust the original flavor of raw vegetables or meats to achieve better flavor and taste (L.Han et al., 2020). Previous studies of pot-stewed products were mainly focused on the optimization of techniques, safety and quality control in the production of pot-stewed meats and eggs. Sun et al. (Sun et al., 2014) used electronic nose (E-nose) and gas chromatography-mass spectrometry (GC-MS) to analyze the effect of star anise on the flavor of pot-stewed chicken. The addition of star anise resulted in a spicy flavor, a significant increase in aldehyde compounds, while a decrease in the volatile compounds produced by Maillard reaction in the stewed chicken. Machiels et al. (Machiels et al., 2003) employed gas chromatography-olfactrometry (GC/O) to determine the intensity of aroma (odor) and characteristics of volatile compounds in two commercial Irish beef meats and described the flavor of each compound. Gong et al. (2017) studied the flavor changes of Chinese-style beef during cooking, and their results showed that the best flavor quality and stability were obtained by cooking for 4 h.
There have been substantial advances in the processing and flavor control of meats in the production of modern pot-stewed products. However, there have been few reports about the processing of pot-stewed lotus rhizomes, particularly their flavors. Due to the lack of data, there are no standards of quantitative indexes to ensure the quality of the products so far. Here, we prepared pot-stewed lotus rhizomes with particular processing techniques in the laboratory, which were then used to compare with the samples sold on the market by using headspace solid-phase microextraction combined with gas chromatography-mass spectrometry technology and an E-nose. The results will provide technical support and theoretical basis for optimizing the techniques and adjusting the flavor of modern pot-stewed lotus rhizomes.
2.1. Samples
Sample A is made by our laboratory, see attached document 1 for the specific manufacturing method. Before determination, the sample is cut into small pieces (size: about 1 cm × 1 cm). The samples B, C, D of stewed lotus rhizome are bought from Wuhan xiangmanyuan Food Co., Ltd, Jingzhou Zhaojiazhuang Food Co., Ltd. and Wuhan xinpeiyuan Green Food Co., Ltd. (Wuhan, Jingzhou, Hubei Province, China). All samples were vacuum packed and stored at 4 °C for at most seven days.
2.2. Extraction of volatile compounds
A certain amount of vacuum packing pot-stewed lotus rhizomes was taken and ground with a grinder. Then, 50 g of the sample was accurately weighed and put into a headspace bottle. After the addition of 50 μL cyclohexanone (dissolved in ethanol to the concentration of 0.946 μg/mL) as the internal standard, the bottle was sealed using a lid with polystyrene pin. The mixture was then heated to equilibrium for 15 min on a constant temperature magnetic stirring meter (50 °C), followed by the insertion of activated 50/30 μm DVB/CAR/PDMS extraction fiber (activated for 30 min in the injection port of the gas chromatograph-mass spectrometer). Then, adsorption of volatile flavor compounds was performed for 40 min at 50°C in the headspace. Finally, the extraction fiber was inserted into the injection port of GC-MS for desorption of 5 min.
2.3. GC-MS analysis of volatile compounds
GC–MS conditions were according to the procedure described by (Tripathi et al., 2014) with minor modifications. Agilent 7890B GC coupled to an Agilent 5977A mass spectrometer and equipped with a HP-5 fused silica capillary column (30 m × 320 µm, 0.25 µm) was used to analyze volatile compounds. Helium was used as the carrier gas at a flow rate of 1 mL/min. The analysis was performed in the splitless mode, and the injector temperature was 250 °C. The column was held at 40°C for 12 min and then increased to 108 °C at a rate of 3°C/min, then held for 2 min, and finally increased to 250 °C at 5 °C/min and held for 5 min. Mass spectral ionization was set at 230 °C. The mass spectrometer was operated in the electron ionization mode at a voltage of 70 eV and 45–550 m/z scan range.
Compounds detected by GC-MS analysis were preliminarily searched and analyzed by using NIST11 standard spectral library. The compounds with matching degrees greater than 80 were screened. The chemical compositions of the matched volatile compounds were determined by CAS and mass spectrometry data reported in previous literature. All samples were run in three repetitions. The volatile compounds were quantitatively analyzed based on the normalization of peak area to calculate the relative percentage of each compound in the total volatile compounds, and through quantification with reference to the internal standard, the absolute content of each compound was obtained.
2.4. Electronic nose analysis
The measurement parameters were according to the procedures described by Q. Chen et al. (2018) and Qiu et al. (2015) with some modifications. A FOX 4000 E-nose system (Alpha MOS, Toulouse, France) equipped with 18 metal oxide semiconductor sensors was used for the assay. Prior to detection, the samples were cut into pieces of about 2 mm. Static headspace was generated in a 10-mL vial using 2 g of samples. Headspace (2500 mL) carried by air (150 mL/min) was injected into the E-nose. Sensor resistance was measured during 120 s at the rate of one acquisition every 1 s. All samples were run in five repetitions. Radar graph and data for PCA were obtained using the built-in software for E-nose analysis.
2.5. Statistical analysis
All statistical analyses were performed using SPSS 23.0 and Alpha SOFT 12.4. Principal component analysis (PCA) of volatile compounds was carried out based on the mean values of triplicates. PCA of E-nose data was performed by Alpha SOFT 12.4. Radar graph of electronic nose was constructed by Origin 2018.
3.1. Comprehensive analysis of volatile compounds of pot-stewed lotus rhizomes
Table 1 shows the GC-MS analysis results of the volatile flavor compounds in the samples of A, B, C and D of pot-stewed lotus rhizomes. The varieties and relative contents of the volatile flavor compounds of different samples are shown in Fig. 1. A total of 85 volatile flavor compounds were detected from all the four samples, including 36 olefins, 9 alkanes, 10 ketones, 12 esters, 2 ethers, 3 aldehydes, 7 alcohols, 4 arenes, and 2 sulfur-containing heterocyclic compounds. The four samples showed obvious differences in their compositions and contents of various volatile flavor compounds. In A, B, C and D samples, 65, 51, 49 and 41 compounds were detected, respectively, and the total volatile compounds detected in sample D were about twice as much as those in sample A. 25 volatile flavor compounds such as benzaldehyde, β-myrcene, D-limonene, trans-β-ocimene, α-phellandrene and γ-terpinene were commonly detected in all the four samples, but their contents varied largely among different samples. For example, the content of anethole was 2.20 μg/kg in sample A, 3.28 μg/kg in sample B, 10.49 μg/kg in sample C, and 118.99 μg/kg in sample D. Anethole is a major component of star anise and fennel (Bilia et al., 2002), indicating that a large amount of fennel was used in the production of sample D. These results also suggested that different recipes would result in different contents of flavor compounds. Besides the above mentioned 25 common compounds, each of the four samples also contained some particular flavor compounds respectively.
The results in Table 1 and Fig. 1 showed that among the detected volatile flavor compounds, olefins had the most varieties as well as the highest contents, which might be closely related to the addition of various spices and seasonings during the production of the pot-stewed lotus rhizomes. Olefin compounds have relatively low threshold values of detection with strong flavor, and thus contribute much to the flavor of pot-stewed lotus rhizomes. Therefore, it can be speculated that olefins may be the main volatile flavor compounds in pot-stewed lotus rhizomes. In all the four samples, the compound with the highest content was detected to be D-limonene, which is characterized by the fragrant and sweet aroma of fresh orange and lemon (Yao et al., 2015). D-limonene is a monocyclic monoterpene compound naturally present in lemon (Rao & McClements, 2012), orange (Fischer et al., 2008), cumin and Sichuan pepper with low threshold values and contributes much to the flavor (Moretti et al., 2004). Besides, the volatile flavor compounds with relatively higher contents in the four samples included β-myrcene, trans-β-ocimene, terpinene, terpinolene and caryophyllene, among which β-myrcene has the aroma of green grass and fruit and contributes much to the flavor (Nisperoscarriedo & Shaw, 1990). The content of β-myrcene was the highest in sample D (7.25%), followed by sample C (5.11%), and was nearly equal in sample A and B (3.21% and 4.87%, respectively). Trans-β-ocimene has the flavors of green grass and tropical fruit, and its content was the highest in sample C (2.84%) and the lowest in sample A (0.904%). Terpinenes include α-terpinene and γ-terpinene, which have the aroma of orange and lemon and are naturally present in limonene. Terpinolene has the flavor of lemon and pine resin, and its content showed no significant differences among the four samples. Cryophyllene has the aromas of spice, orange and clove, and is naturally present in lemon and clove. The olefin compounds commonly detected in the four samples, including β-myrcene, α-phellandrene, α-terpinene, D-limonene, trans-β-ocimene, γ-terpinene, terpinolene, β-elemene, caryophyllene, β-bisabolene and cadinene, were the volatile flavor compounds derived from the clove, fennel, fresh ginger and pepper added in the production process of pot-stewed lotus rhizomes.
Alkane compounds are mainly derived from the cleavage of fatty acid alkoxy radical (Champagne & Nawar, 1969). They have relatively high threshold values and do not contribute much to the flavor. Although only small amounts of alkane compounds were detected in the four samples, they might help to improve the overall flavor of the pot-stewed lotus rhizomes (Sanchez-Pena et al., 2005). Ketone compounds possibly originate from the thermal oxidation or decomposition of alcohols or esters under heating conditions (Mottram, 1998). They have relatively high threshold values and thus may contribute little to the flavor. Only small amounts of ketone compounds were detected in all the four samples, with the lowest content in sample D (3.73%). Ester compounds, which are formed from the interaction between the alcohols generated from fat oxidation and free fatty acids (Ai, 1997), generally have the aroma of fruit and have great influence on the flavor of pot-stewed lotus rhizomes. The highest content of ester compounds was detected in sample A (15.42%), followed by sample B (12.72%), C (3.46%), and D (1.67%). These ester compounds have their particular aromas. For example, linalyl acetate has the aroma of flower, but the flavor is not long-lasting; and ethyl cinnamate has sweet and spicy aromas, which may supplement and coordinate the overall flavor of pot-stewed lotus rhizomes. Anethole was detected in all the four samples, with the highest content in sample D (36.79%). Anethole is a flavor component belonging to ethers and the main component of spices such as anise (Bilia et al., 2002). Aldehyde compounds are mainly derived from the oxidative degradation of unsaturated fatty acids with the aroma of fat (Liu et al., 2010). They have relatively low threshold values and thus are important flavor compounds (Sánchez-Peña et al., 2005). Benzaldehyde and 2-methyl-3-phenyl-propanal were detected in all samples. Benzaldehyde has a special flavor of almond (Zardin et al., 2014) with a very low threshold value (0.35 μg/g) (Sansone-Land et al., 2014), and can be extracted from cinnamon and myrcia. Because it is unstable in property and easy to be oxidized in the air, it was rarely detected in the products of pot-stewed lotus rhizomes. Phellandral was only detected in sample A and B. It has a strong aroma similar to that of pimpinella anisum and hawthorn and is naturally present in anise. It has unstable properties and is slightly soluble in water and volatilized together with vapor. Hence, a very low content of phellandral was detected in the samples.
Alcohol compounds are derived from the oxidative degradation of fat and reduction of carbonyl compounds under heating conditions (Wurzenberger & Grosch, 1984). Besides olefin compounds, alcohol compounds were also detected in high contents in pot-stewed lotus rhizomes. In all the four samples, linalool, (-)-4-Terpineol, and α-terpineol were detected, among which linalool has the aromas of flower and berry. These alcohol compounds may originate from the spices and seasonings like myrcia, cinnamon, Sichuan pepper, star anise, fresh ginger and pepper. Alcohol compounds can be classified as saturated and unsaturated alcohols. The saturated alcohols have relatively high threshold values (0.5–20 mg/kg) and thus have little impact on the flavor; while the unsaturated alcohols have relatively lower threshold values than saturated alcohols, and thus have certain contributions to the flavor (Alasalvar et al., 2005). The detected alcohol compounds were all unsaturated alcohols, indicating that they contribute to the flavor of pot-stewed lotus rhizomes.
Arene compounds are the major components of the aroma of meats. Thus, these compounds provide the aroma of meats and play an important role in the overall flavor of pot-stewed lotus rhizomes. The highest content of arene compounds was detected in sample A (7.51%), while the contents in other three samples were all lower than 1.5%. Eugenol was commonly detected in all four samples. It indicated that the flavor of PSLR samples is better than that of market products.
Table 1. Volatile flavor compounds identified in four different samples of pot-stewed lotus rhizome products using GC-MS.
|
No |
Volatilescompounds |
Retention time/min |
Absolute content/(μg/kg) |
|||
|
A |
B |
C |
D |
|||
|
1 |
Butanoic acid, ethyl ester |
6.344 |
0.42±0.10 |
— |
— |
— |
|
2 |
α-Pinene |
14.404 |
0.07±0.03 |
0.45±0.15 |
— |
0.51±0.16 |
|
3 |
4-methyl-1-(1-methylethyl)-Bicyclo[3.1.0]hex-2-ene |
14.885 |
1.84±0.20 |
— |
0.50±0.24 |
0.45±0.15 |
|
4 |
Benzaldehyde |
17.564 |
0.08±0.04 |
0.26±0.01 |
0.25±0.09 |
2.44±0.16 |
|
5 |
4-methylene-1-(1-methylethyl)-Cyclohexene |
18.535 |
— |
1.07±0.18 |
— |
— |
|
6 |
Sabinene |
18.574 |
0.96±0.35 |
— |
— |
0.23±0.00 |
|
7 |
β-Myrcene |
19.921 |
4.09±1.76 |
6.58±0.06 |
10.74±3.55 |
23.47±4.62 |
|
8 |
Hexanoic acid, ethyl ester |
20.655 |
19.82±2.30 |
— |
— |
— |
|
9 |
α-Phellandrene |
20.668 |
1.00±0.12 |
1.02±0.11 |
1.22±0.68 |
0.98±0.10 |
|
10 |
α-Terpinene |
21.284 |
3.48±0.10 |
1.22±0.46 |
2.54±0.03 |
4.86±1.37 |
|
11 |
D-Limonene |
22.304 |
14.88±0.50 |
33.06±19.36 |
29.60±2.93 |
56.74±7.34 |
|
12 |
trans-β-Ocimene |
23.318 |
1.24±0.16 |
2.23±0.09 |
5.62±0.72 |
5.20±2.54 |
|
13 |
(Z)-3,7-dimethyl-1,3,6-Octatriene |
23.734 |
1.39±0.15 |
2.11±0.34 |
— |
11.32±5.11 |
|
14 |
γ-Terpinene |
24.214 |
4.29±0.49 |
3.86±0.64 |
3.74±0.96 |
6.92±2.12 |
|
15 |
di-tert-dodecyl Disulfide |
24.441 |
0.70±0.15 |
— |
— |
— |
|
16 |
4-methyl-Decane |
24.634 |
0.11±0.03 |
— |
— |
— |
|
17 |
Terpinolene |
26.008 |
2.81±0.07 |
1.93±0.21 |
2.64±0.79 |
2.51±0.02 |
|
18 |
1-methyl-4-(1-methylethenyl)-Benzene |
26.063 |
— |
— |
— |
2.68±0.04 |
|
19 |
Linalool |
26.915 |
7.86±1.83 |
15.23±0.96 |
58.95±15.58 |
21.91±0.65 |
|
20 |
(E,Z)-2,6-dimethyl-2,4,6-Octatriene |
28.732 |
1.65±0.07 |
2.00±0.17 |
2.65±0.83 |
6.62±0.97 |
|
21 |
2,3-dihydro-2-methyl-Benzofuran |
28.616 |
0.007±0.02 |
— |
— |
— |
|
22 |
(+)-2-Bornanone |
29.022 |
0.18±0.05 |
— |
— |
— |
|
23 |
3,5,5-trimethyl-3-Cyclohexen-1-one |
29.831 |
0.39±0.08 |
— |
— |
— |
|
24 |
4-methyl-Undecane |
30.182 |
— |
— |
0.08±0.04 |
— |
|
25 |
Benzoic acid ethyl ester |
30.624 |
— |
— |
— |
0.36±0.07 |
|
26 |
(-)-4-Terpineol |
30.895 |
16.26±1.70 |
6.83±0.34 |
8.42±1.97 |
10.81±2.10 |
|
27 |
4-(1-methylethyl)-2-Cyclohexen-1-one |
31.313 |
2.49±0.15 |
0.33±0.02 |
0.36±0.10 |
0.81±0.00 |
|
28 |
α-Terpineol |
31.631 |
6.23±0.83 |
4.92±0.30 |
7.15±2.86 |
7.04±0.16 |
|
29 |
trans-2-methyl-5-(1-methylethenyl)-Cyclohexanone |
32.101 |
1.05±0.02 |
— |
— |
— |
|
30 |
2-ethyl-3-hydroxy-4H-Pyran-4-one |
32.054 |
— |
17.34±4.02 |
19.02±4.79 |
11.09±2.65 |
|
31 |
Estragole |
32.037 |
0.17±0.03 |
— |
— |
1.81±0.06 |
|
32 |
9-methyl-Nonadecane |
32.518 |
— |
0.19±0.04 |
— |
— |
|
33 |
2,6-dimethyl-Undecane |
32.962 |
0.75±0.20 |
0.39±0.01 |
0.94±0.26 |
— |
|
34 |
4,8-dimethyl-Undecane |
33.352 |
0.31±0.11 |
0.23±0.01 |
0.42±0.13 |
— |
|
35 |
4-(1-methylethyl)-Phenol |
33.722 |
0.09±0.02 |
— |
— |
— |
|
36 |
2-methyl-3-phenyl-Propanal |
34.019 |
0.59±0.13 |
4.23±0.69 |
0.36±0.14 |
0.25±0.01 |
|
37 |
D-Carvone |
34.244 |
1.18±0.04 |
0.24±0.02 |
0.40±0.14 |
— |
|
38 |
Nerol |
34.57 |
— |
— |
0.10±0.07 |
— |
|
39 |
Piperitone |
34.71 |
— |
— |
1.35±0.08 |
— |
|
40 |
2-isopropyl-5-methyl-3-Cyclohexen-1-one |
34.753 |
15.98±0.71 |
1.42±0.07 |
— |
— |
|
41 |
3-Carene |
35.008 |
0.49±0.15 |
— |
— |
— |
|
42 |
3,7-dimethyl-2-aminobenzoate1-1,6-Octadien-3-ol |
35.057 |
— |
— |
15.02±3.46 |
— |
|
43 |
Linalyl acetate |
35.084 |
— |
11.78±0.69 |
— |
— |
|
44 |
4-methyl-Dodecane |
35.149 |
0.11±0.06 |
— |
— |
— |
|
45 |
Geraniol |
35.75 |
— |
0.22±0.01 |
0.26±0.03 |
— |
|
46 |
Phellandral |
35.726 |
0.47±0.21 |
0.41±0.04 |
— |
— |
|
47 |
Anethole |
36.089 |
2.20±0.53 |
3.28±0.55 |
10.49±3.42 |
118.99±23.59 |
|
48 |
2,6,11-trimethyl-Dodecane |
36.514 |
1.02±0.47 |
— |
— |
— |
|
49 |
4,6-dimethyl-Dodecane |
37.03 |
— |
0.20±0.01 |
0.39±0.17 |
— |
|
50 |
Myrtenyl acetate |
38.52 |
0.15±0.00 |
— |
— |
— |
|
51 |
4-Carene |
39.606 |
3.10±0.29 |
0.31±0.01 |
— |
5.38±1.69 |
|
52 |
Terpinyl acetate |
39.61 |
— |
2.17±0.17 |
2.67±0.34 |
— |
|
53 |
3-Allyl-6-methoxyphenol |
39.932 |
9.96±0.58 |
0.51±0.00 |
2.36±0.04 |
0.61±0.19 |
|
54 |
Neryl acetate |
40.321 |
0.27±0.06 |
1.35±0.07 |
1.80±0.07 |
1.89±0.12 |
|
55 |
Ylangene |
40.449 |
0.10±0.00 |
0.05±0.01 |
— |
— |
|
56 |
Copaene |
40.624 |
0.25±0.02 |
0.34±0.04 |
0.94±0.19 |
0.94±0.09 |
|
57 |
1-(4-methoxyphenyl)-2-Propanone |
40.965 |
— |
— |
— |
0.16±0.00 |
|
58 |
5-methyl-2-(1-methylethenyl)-4-Hexen-1-ol acetate |
41.082 |
0.62±0.12 |
— |
— |
— |
|
59 |
Geranyl acetate |
41.084 |
— |
1.71±0.11 |
2.43±0.03 |
2.33±0.05 |
|
60 |
β-Elemene |
41.294 |
0.61±0.02 |
0.47±0.01 |
0.34±0.03 |
2.31±0.86 |
|
61 |
α-Cubebene |
41.418 |
— |
0.04±0.00 |
0.08±0.01 |
|
|
62 |
Tetradecane |
41.66 |
0.07±0.01 |
— |
0.18±0.06 |
0.17±0.02 |
|
63 |
4,11,11-trimethyl-8-methylene-Bicyclo[7.2.0]undec-4-ene |
41.806 |
0.07±0.00 |
— |
— |
— |
|
64 |
Longifolene |
41.678 |
— |
0.18±0.01 |
— |
— |
|
65 |
Methyleugenol |
41.832 |
0.56±0.08 |
0.04±0.00 |
0.06±0.05 |
— |
|
66 |
Caryophyllene |
42.239 |
3.40±0.07 |
0.88±0.03 |
1.95±0.24 |
3.81±0.48 |
|
67 |
(+)-Calarene |
42.669 |
— |
— |
0.32±0.00 |
— |
|
68 |
γ-Elemene |
42.777 |
0.08±0.01 |
0.22±0.02 |
0.40±0.11 |
0.36±0.09 |
|
69 |
2,6-dimethyl-6-(4-methyl-3-pentenyl)-Bicyclo[3.1.1]hept-2-ene |
42.866 |
0.29±0.05 |
0.09±0.00 |
0.15±0.09 |
— |
|
70 |
Z,Z,Z-1,5,9,9-tetramethyl-1,4,7,-Cycloundecatriene |
43.402 |
0.62±0.12 |
0.42±0.03 |
0.88±0.23 |
— |
|
71 |
Ethyl cinnamate |
43.813 |
0.17±0.04 |
— |
— |
0.62±0.08 |
|
72 |
Alloaromadendrene |
43.646 |
|
0.10±0.01 |
0.12±0.08 |
0.34±0.06 |
|
73 |
γ-Muurolene |
44.181 |
0.15±0.09 |
0.25±0.05 |
0.32±0.06 |
0.58±0.01 |
|
74 |
γ-Himachalene |
44.381 |
0.18±0.06 |
— |
— |
— |
|
75 |
1-(1,5-dimethyl-4-hexenyl)-4-methyl-Benzene |
44.388 |
— |
— |
0.81±0.14 |
0.83±0.22 |
|
76 |
Naphthalene, decahydro-4a-methyl-1-ββ-Selinene- |
44.46 |
0.26±0.03 |
— |
— |
— |
|
77 |
α-Muurolene |
45.113 |
0.96±0.10 |
0.47±0.05 |
0.40±0.04 |
2.30±0.11 |
|
78 |
β-Bisabolene |
45.176 |
0.08±0.02 |
0.03±0.01 |
0.09±0.07 |
0.12±0.04 |
|
79 |
Cadinene |
45.687 |
0.63±0.05 |
0.79±0.08 |
1.37±0.07 |
2.50±0.67 |
|
80 |
Eugenol acetate |
45.72 |
0.34±0.08 |
— |
0.07±0.03 |
— |
|
81 |
Naphthalene, 1,2,3,4,4a,7-hexahydro-1,6-dimethyl-4-(1-methylethyl)- |
45.841 |
0.06±0.01 |
0.07±0.01 |
0.12±0.03 |
— |
|
82 |
(+)-Valencene |
45.906 |
0.03±0.00 |
— |
— |
— |
|
83 |
Apiol |
48.316 |
0.12±0.03 |
— |
— |
— |
|
84 |
Xanthoxylin |
49.443 |
1.54±0.14 |
0.35±0.01 |
0.20±0.07 |
— |
|
85 |
Dibutyl phthalate |
53.803 |
0.01±0.00 |
0.02±0.00 |
— |
0.20±0.05 |
|
|
Total |
|
141.34 |
133.89 |
201.27 |
323.45 |
Note: “—” means not detected
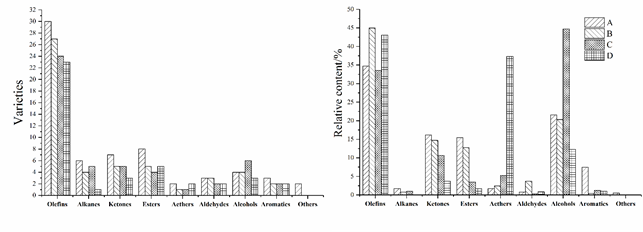
Fig 1. Varieties and relative contents of volatile flavor compounds in different samples (A, B, C, and D).
3.2. Discrimination of the flavor of pot-stewed lotus rhizomes by PCA
Principal component analysis (PCA) was performed for the 85 detected volatile flavor compounds, and the results were shown in Fig. 2. The contribution rates of the first (PC1) and second (PC2) principal components were 47.68% and 31.55%, respectively, and the cumulative contribution rate was 79.23%. Sample A was located between the negative axis of PC1 and positive axis of PC2, which included 28 flavor compounds. The flavor characteristics of sample A were determined by olefin and alcohol compounds, mainly including some volatile flavor compounds such as volatileα-phellandrene, γ-terpinene, terpinolene, D-limonene, linalool and α-terpineol. Sample B was located between the positive axis of PC1 and PC2, including 23 volatile flavor compounds of olefins and aldehydes such as α-terpinene, β-elemene, α-muurolene and phellandral. Sample C was located between the positive axis of PC1 and PC2 with 14 volatile flavor compounds, mainly including some ketone and aromatic compounds such as 4-(1-methylethyl)-2-Cyclohexen-1-one and eugenol acetate. Sample D was located between the positive axis of PC1 and negative axis of PC2 with about only five kinds of volatile flavor compounds, including some olefin and aromatic compounds such as ethyl cinnamate, 4-carene and sabinene. These results of PCA analysis revealed that different samples of pot-stewed lotus rhizomes could be well discriminated by the 85 detected volatile flavor compounds.
The 25 volatile flavor compounds commonly detected in all the four samples were also subjected to PCA analysis. As shown in Fig. 3, the contribution rates of PC1 and PC2 were 54.79% and 30.41%, respectively, and the cumulative contribution rate was 85.20%. It can be observed that except for benzaldehyde (No. 4) and anethole (No. 47), other 23 volatile flavor compounds were clustered around the four samples. Samples A, B and C were all located between the positive axis of PC1 and negative axis of PC2, and were close to each other in distribution, indicating great similarities among the three samples in these 25 compounds. The three samples included 16 volatile flavor compounds such as D-limonene, trans-β-ocimene, β-bisabolene, neryl acetate, γ-muurolene, linalool and cadinene. Sample D was located between the positive axis of PC1 and PC2, including seven compounds such as α-terpinene, caryophyllene and α-muurolene.
The results in Fig. 2 and Fig. 3 showed that both the 85 detected volatile flavor compounds and 25 common compounds could be used for the PCA analysis of the four samples of pot-stewed lotus rhizomes, particularly the 85 volatile flavor compounds, which showed a higher discrimination efficiency in PCA analysis. There was partial overlapping in the plot of PCA analysis for the 25 commonly detected volatile flavor compounds. However, from both figures, the main volatile flavor compounds corresponding to different samples could be obtained, which could be the major sources of the flavors of different samples. Hence, PCA analysis may be a highly effective approach to distinguish the flavors of different pot-stewed lotus rhizomes.
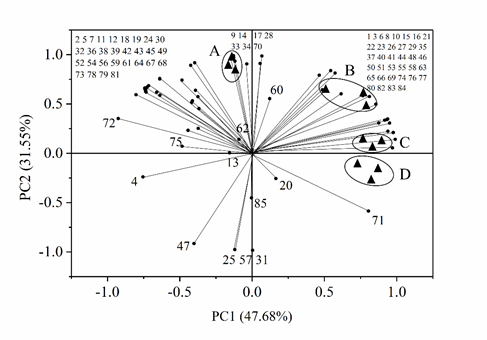
Fig 2. Principal component analysis of 85 volatile flavor compounds identified in four different samples of pot-stewed lotus products. The numbers indicate different compounds presented in Table 1.
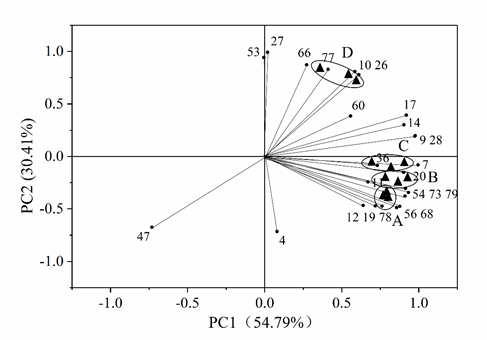
Fig 3. Principal component analysis of 25 common volatile flavor compounds identified in four different samples of pot-stewed lotus products. The numbers indicate different compounds presented in Table 1.
3.3. Discrimination of the flavor of pot-stewed lotus rhizomes using E-nose
The four samples of pot-stewed lotus rhizomes were subjected to E-nose analysis, and a radar graph was generated with the inbuilt software (Fig.4). The radar graph showed the response values of the 18 sensors in the E-nose to the flavors of the four different samples. Except for sample C, there were no significant differences among the other three samples. As can be seen from the graph, except for that the five sensors (LY2/G, LY2/AA, LY2/GH, LY2/gCTL and LY2/gCT) in chamber 1 showed negative response values, all other 13 sensors showed positive response values. Between sample C and other three samples, the response values of the sensors LY2/G, LY2/GH, LY2/gCTL, T30/1, T70/2, PA/2, P30/1 and P30/2 were the most significantly different, while those of sensors LY2/LG, LY2/gCT, P10/2, T40/1 and TA/2 were the least significantly different, indicating that samples A, B and D are similar in flavor, and are significantly different from sample C in flavor.
To better represent the differences between four samples, we analyzed the resistance values of the sensors by using PCA analysis. As shown in Fig. 5, the detection data of each sample constituted a separate cluster, and are distributed in their respective regions without overlapping, indicating the good reproducibility of the E-nose analysis and ability to well discriminate various products of pot-stewed lotus rhizomes. The contribution rates of PC1 and PC2 were 97.09% and 1.86%, respectively, and the cumulative contribution rate was 98.95%, suggesting that these two principal components were highly informative about the flavor of the samples, and could represent the overall characteristics of the samples with good reproducibility. PC1 clearly distinguished sample C from other samples, as sample C was located on the positive axis of PC1, while other samples were on the negative axis. The four samples were also different in PC2. Samples B and C were near the axis origin of PC2, while samples A and D were far from the axis origin. Compared with the PCA analysis of GC-MS results, that of E-nose results seems to better discriminate the differences between different samples.
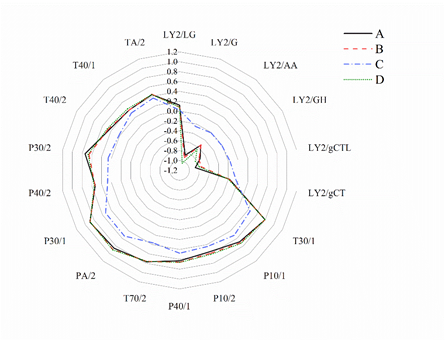
Fig 4. Radar graph with the E-nose data of different samples of pot-stewed lotus rhizomes.
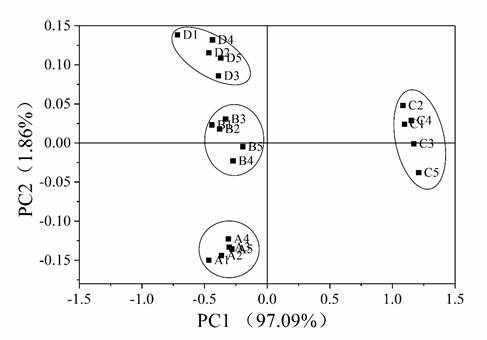
Fig 5. Principal component analysis on the E-nose data of different samples of pot-stewed lotus rhizomes.
This study investigated the flavor characteristics of four different samples of pot-stewed lotus rhizome using headspace solid-phase microextraction combined with GC-MS and E-nose. The result showed that the flavor of PSLR samples is better than that of market products. Specifically, a total of 85 volatile flavor compounds were identified and quantified, mainly including olefin, alcohol, ester, ether and aldehyde compounds, which are mainly derived from various spices, seasonings and meats. Twenty-five volatile flavor compounds were commonly detected in all the four samples. The compounds such as β-myrcene, caryophyllene, α-terpinene, γ-terpinene, trans-β-ocimene, linalool, (-)-4-terpineol, D-limonene, α-terpineol, anethole, terpinolene were found to be abundant, which can be regarded as the main volatile flavor compounds in pot-stewed lotus rhizome. The results of PCA based on SPME-GC-MS method showed that both the 85 detected compounds and the 25 common compounds could be used to discriminate the four samples. However, the PCA of E-nose data showed better effects and higher efficiency in discriminating the samples. Hence, E-nose could be recommended to identify the differences between various products of pot-stewed lotus rhizomes, and headspace solid-phase microextraction combined with GC-MS and E-nose could be used for the quantitative analysis of the volatile flavor compounds in pot-stewed lotus rhizomes.
This work was financially supported by NSFC (31972001) and the Fund of Aquatic Vegetable Processing and Preservation (2019ABA108).
Declaration of interests: The authors declare that they have no known competing financial interests or personal relationships that could have appeared to influence the work reported in this paper.
Ai, J. (1997). Headspace solid phase microextraction. Dynamics and quantitative analysis before reaching a partition equilibrium. Analytical Chemistry, 69(16), 3260-3266.
View ArticleAlasalvar, C., Taylor, K. D. A., & Shahidi, F. (2005). Comparison of volatiles of cultured and wild sea bream (Sparus aurata) during storage in ice by dynamic headspace analysis gas chromatography mass spectrometry. Journal of Agricultural and Food Chemistry, 53(7), 2616-2622. PMid:15796602
View Article PubMed/NCBIBilia, A. R., Flamini, G., Taglioli, V., Morelli, I., & Vincieri, F. F. (2002). GC-MS analysis of essential oil of some commercial Fennel teas. Food Chemistry, 76(3), 307-310. 00277-1
View ArticleChampagne, J. R., & Nawar, W. W. (1969). Volatile components of irradiated beef and pork fats. Journal of Food Science, 34(4), 335-339.
View ArticleChen, H., Zhao, C., Li, J., Hussain, S., Yan, S., & Wang, Q. (2018). Effects of extrusion on structural and physicochemical properties of soluble dietary fiber from nodes of lotus root. LWT - Food Science and Technology, 93, 204-211.
View ArticleChen, Q., Song, J., Bi, J., Meng, X., & Wu, X. (2018). Characterization of volatile profile from ten different varieties of Chinese jujubes by HS-SPME/GC-MS coupled with E-nose. Food Research International, 105(October 2017), 605-615. PMid:29433254
View Article PubMed/NCBIDu, J., Fu, Y., & Wang, N. (2009). Effects of aqueous chlorine dioxide treatment on browning of fresh-cut lotus root. LWT - Food Science and Technology, 42(2), 654-659.
View ArticleFischer, A., Grab, W., & Schieberle, P. (2008). Characterisation of the most odour-active compounds in a peel oil extract from Pontianak oranges (Citrus nobilis var. Lour. microcarpa Hassk.). European Food Research and Technology, 227(3), 735-744.
View ArticleGong, H., Yang, Z., Liu, M., Shi, Z., Li, J., Chen, W., & Qiao, X. (2017). Time-dependent categorization of volatile aroma compound formation in stewed Chinese spicy beef using electron nose profile coupled with thermal desorption GC-MS detection. Food Science and Human Wellness, 6(3), 137-146.
View ArticleHu, M., & Skibsted, L. H. (2002). Antioxidative capacity of rhizome extract and rhizome knot extract of edible lotus (Nelumbo nuficera). Food Chemistry, 76(3), 327-333. 00280-1
View ArticleL.Han, C.Huang , J.LI, S. Y. (2020). Comparison of Flavor Substances of Water-boiled Lotus Roots from Different Varieties. Food Science, v.41;No.63(22), 254-260.
Lara, G., Yakoubi, S., Villacorta, C. M., Uemura, K., Kobayashi, I., Takahashi, C., Nakajima, M., & Neves, M. A. (2020). Spray technology applications of xanthan gum-based edible coatings for fresh-cut lotus root (Nelumbo nucifera). Food Research International, 137(September), 109723. PMid:33233292
View Article PubMed/NCBILiu, Y., Xu, X. L., & Zhou, G. H. (2010). Comparative study of volatile compounds in traditional Chinese Nanjing marinated duck by different extraction techniques. International Journal of Food Science & Technology, 42(5), 543-550.
View ArticleMachiels, D., van Ruth, S. M., Posthumus, M. A., & Istasse, L. (2003). Gas chromatography-olfactometry analysis of the volatile compounds of two commercial Irish beef meats. Talanta, 60(4), 755-764. 00133-4
View ArticleMan, J., Cai, J., Cai, C., Xu, B., Huai, H., & Wei, C. (2012). Comparison of physicochemical properties of starches from seed and rhizome of lotus. Carbohydrate Polymers, 88(2), 676-683.
View ArticleMoretti, V. M., Madonia, G., Diaferia, C., Mentasti, T., Paleari, M. A., Panseri, S., Pirone, G., & Gandini, G. (2004). Chemical and microbiological parameters and sensory attributes of a typical Sicilian salami ripened in different conditions. Meat Science, 66(4), 845-854. PMid:22061017
View Article PubMed/NCBIMottram, D. S. (1998). Flavour formation in meat and meat products: a review. Food Chemistry, 62(4), 415-424. 00076-4
View ArticleNisperoscarriedo, M. O., & Shaw, P. E. (1990). Comparison of volatile flavor components in fresh and processed orange juices. Journal of Agricultural and Food Chemistry, 38(4), 1048-1052.
View ArticleQiu, S., Wang, J., Tang, C., & Du, D. (2015). Comparison of ELM, RF, and SVM on E-nose and E-tongue to trace the quality status of mandarin (Citrus unshiu Marc.). Journal of Food Engineering, 166, 193-203.
View ArticleRao, J., & McClements, D. J. (2012). Impact of lemon oil composition on formation and stability of model food and beverage emulsions. Food Chemistry, 134(2), 749-757. PMid:23107687
View Article PubMed/NCBISanchez-Pena, C. M., Luna, G., Garcia-Gonzalez, D. L., & Aparicio, R. (2005). Characterization of French and Spanish dry-cured hams: influence of the volatiles from the muscles and the subcutaneous fat quantified by SPME-GC. Meat Science, 69(4), 635-645. PMid:22063141
View Article PubMed/NCBISánchez-Peña, C. M., Luna, G., García-González, D. L., & Aparicio, R. (2005). Characterization of French and Spanish dry-cured hams: influence of the volatiles from the muscles and the subcutaneous fat quantified by SPME-GC. Meat Science, 69(4), 635-645. PMid:22063141
View Article PubMed/NCBISansone-Land, A., Takeoka, G. R., & Shoemaker, C. F. (2014). Volatile constituents of commercial imported and domestic black-ripe table olives ( Olea europaea ). Food Chemistry, 149(8), 285-295. PMid:24295708
View Article PubMed/NCBISun, L., Chen, J., Li, M., Liu, Y., & Zhao, G. (2014). Effect of star anise ( illicium verum) on the volatile compounds of stewed chicken. Journal of Food Process Engineering, 37(2), 131-145.
View ArticleThanushree, M. P., Sudha, M. L., & Crassina, K. (2017). Lotus ( Nelumbo nucifera ) rhizome powder as a novel ingredient in bread sticks: rheological characteristics and nutrient composition. Journal of Food Measurement & Characterization, 1, 1-9.
View ArticleTripathi, J., Chatterjee, S., Gamre, S., Chattopadhyay, S., Variyar, P. S., & Sharma, A. (2014). Analysis of free and bound aroma compounds of pomegranate (Punica granatum L.). LWT - Food Science and Technology, 59(1), 461-466.
View ArticleWurzenberger, M., & Grosch, W. (1984). Stereochemistry of the cleavage of the 10-hydroperoxide isomer of linoleic acid to 1-octen-3-ol by a hydroperoxide lyase from mushrooms ( psalliota bispora ). Biochimica Et Biophysica Acta, 795(1), 163-165. 90117-6
View ArticleYao, Y., Pan, S., Fan, G., Dong, L., Ren, J., & Zhu, Y. (2015). Evaluation of volatile profile of Sichuan dongcai, a traditional salted vegetable, by SPME-GC-MS and E-nose. LWT - Food Science and Technology, 64(2), 528-535.
View ArticleYe, K., Liu, M., Liu, J., Jiang, J., & Guo, C. (2017). Microbial diversity of different modified atmosphere packed pot-stewed duck wings products during 8°C storage. Letters in Applied Microbiology, 64(3), 225-230. PMid:28191705
View Article PubMed/NCBIYe, Keping, Jiang, J., Wang, Y., Hou, Y., Liu, M., Liu, J., & Guo, C. (2017). Microbial analysis of MAP pot-stewed duck wings under different conditions during 15 °C storage. Journal of Food Science and Technology, 54(5), 1073-1079. PMid:28416856
View Article PubMed/NCBIZardin, Erika, Tyapkova, Oxana, Buettner, Andrea, Beauchamp, & Jonathan. (2014). Performance assessment of proton-transfer-reaction time-of-flight mass spectrometry (PTR-TOF-MS) for analysis of isobaric compounds in food-flavour applications. LWT - Food Science and Technology, 56(1), 153-160.
View Article