Dr. Oleg Paliy,
260 Diggs Laboratory, Wright State University, 3640 Col. Glenn Hwy, Dayton, OH 45435, USA,
Email: oleg.paliy@wright.edu
© 2019 Sift Desk Journals. All Rights Reserved
VOLUME: 4 ISSUE: 7
Page No: 846-851
Dr. Oleg Paliy,
260 Diggs Laboratory, Wright State University, 3640 Col. Glenn Hwy, Dayton, OH 45435, USA,
Email: oleg.paliy@wright.edu
Sumudu Rajakaruna1, Darcy A. Freedman2, Ashwini R. Sehgal2, Xem Bui2, and Oleg Paliy1 *
1 Department of Biochemistry and Molecular Biology, Boonshoft School of Medicine, Wright State University, Dayton, Ohio, USA,
2 School of Medicine, Case Western Reserve University, Cleveland, Ohio, USA
Yu Bai(yubaijlucau@163.com)
Shuji Ogino(shuji_ogino@dfci.harvard.edu)
Enza D Auria(enza.dauria@unimi.it)
Laurits J Holm(laurits.juulskov.holm@regionh.dk)
Sumudu Rajakaruna, Darcy A. Freedman, Ashwini R. Sehgal, Xem Bui, Oleg Paliy, Diet quality and body mass indices show opposite associations with distal gut microbiota in a low-income cohort (2019)Journal of Food Science & Technology 4(7) p:846-851
In this study we assessed the extent to which diet quality and eating habits affected the composition of distal gut microbiota. Twenty six adult subjects from low-income communities with a recently established food hub were recruited, and their fecal microbiota was analyzed via interrogation of 16S rRNA gene. Among the dietary and biometric parameters recorded for each subject, age was a statistically significant contributor to microbiota composition variability. While healthy eating and body mass indices had no direct correlation between themselves, they displayed opposite effects in structuring microbiota composition. Thus, adopting healthier eating habits might potentially counteract the obesity-related shifts in gut microbial communities.
Keywords: microbiota, nutrition, BMI, Western diet, obesity, healthy eating index
Chronic disease disparities are persistent across the United States with rates of diabetes [1], obesity [2], cardiovascular disease [3], and some cancers [4] trending higher for people of low socioeconomic status and racial/ethnic minorities [5]. Diet is central to both preventing and treating these disparities through the provision of nutrients that influence numerous physiological mechanisms including those mediated by gut microbiota.
One strategy to reduce diet-related chronic disease disparities is to improve dietary behaviours through individual, community, and systems interventions [6]. This approach is focused on improving diet quality (i.e., the balance of healthy and unhealthy consumed foods), which can be measured using a standardized Healthy Eating Index (HEI) based on national dietary guidelines [7]. There is evidence that diet quality is worse among populations at greatest risk for diet-related chronic disease, with gaps in diet quality increasing rather than decreasing over time [8].
It is now well recognized that gut microbes mediate many dietary effects on human health. That is because a substantial amount of ingested foods avoids digestion and absorption in the small intestine and traverse to the colon, a section of the gastrointestinal tract that is packed with microbes. The list of such compounds includes dietary fiber and resistant starches, small amounts of sugars, dietary proteins and fats, active compounds released in the small intestine - bile salts and protein enzymes [9]. Majority of these unabsorbed compounds are processed in the colon by the gut microbiota. Whereas end-products of carbohydrate fermentation (various short chain fatty acids) have positive functions in the gut [10], protein fermentation is more detrimental to the host health because it results in the production of harmful hydrogen disulfide, phenolic compounds, and ammonia [11]. Less is known about colonic fermentation of dietary fatty acids, and the available evidence points to several detrimental effects on the host [12, 13].
Multiple prior studies have shown that long-term consumption of different diets leads to drastically different gut microbiota profiles, and that these microbial community differences can have an impact on the host physiology and well-being [14, 15]. Findings from clinical studies reveal consistent though not unambiguous evidence that people with diet-related chronic diseases have less diverse gut microbiota than healthy controls [16]. Just like diet quality varies by socioeconomic status and race/ethnicity, emerging evidence suggests that composition of gut microbiome also varies based on these social factors, with lower income children and adults and
African Americans housing less diverse distal gut microbiota compared to higher income and Caucasian populations [17, 18].
In this study, we sought to profile fecal microbiota in a cohort of people consuming a typical Western diet and living in low-income urban neighbourhoods with poor access to healthy food retailers such as supermarkets (i.e., food deserts). Microbial composition was tested for associations with the healthy eating index, subjects’ BMI and age, as well as dietary consumption patterns.
Subject cohort
This project was part of a longitudinal study that started in 2015-16 to examine changes in diet quality over time among residents living in food desert neighbourhoods in Cleveland and Columbus, Ohio, USA [19]. Participants were recruited to join the ancillary fecal microbiome study in 2017 during Time 2 data collection of the parent study. They were purposefully selected based on their Time 1 (time of initial enrolment) Healthy Eating Index 2010 (HEI-2010) scores, a measure of diet quality based on conformity to 2010 dietary guidelines [7]. HEI-2010 was calculated based on the data collected and processed using the Nutrition Data System for Research, a standardized and comprehensive 24-hour dietary recall method [7]. Three dietary recalls per person were collected at each time period reflecting two weekdays and one weekend within a 30-day window to limit within-subject seasonal variability [20]. The average of the three HEI-2010 scores was derived for each time point, with higher average scores (on 0-100 scale) indicating greater adherence to dietary guidelines. HEI-2010 scores were categorized into three groups reflecting high (56-100), medium (44-55), and low (043) levels of diet quality for each subject. This study has been approved by Case Western Reserve University IRB Committee.
Collection of fecal samples and isolation of DNA
All experiments were performed in accordance with relevant guidelines and regulations. During Time 2 period, participants were invited to take part in the fecal microbiome study. Inclusion criteria included: (1) enrolled in longitudinal study, (2) provided informed consent in the parent study to be contacted for enrolment in other studies, (3) randomly selected to take part based on HEI-2010 score, (4) not taking any antibiotics, probiotics, antacids, or acid reducing medications in the prior four months based on self-report, and (5) provided informed consent to join fecal microbiome study after reviewing all study procedures via a face-to-face session. Participants were compensated for time and effort and for providing fecal sample. Analysis of fecal microbiomes was approved by Wright State University Institutional Research Board committee.
Fecal samples were collected during Time 2 dietary recall collection period from 28 volunteers. For all participants, Healthy Eating Index was re-calculated at Time 2 based on the dietary recall at the time of stool collection. Approximately 500 mg of fresh stool was obtained from each participant using OMR-200 collection kit (DNA Genotek, Canada). Microbial genomic DNA was isolated using ZR Fecal DNA MiniPrep kit (Zymo Research) and purified using HRC-IV column to remove potential PCR inhibitors in fecal material [21]. Two volunteers did not provide fecal material of acceptable quality and their samples were excluded from further analysis.
PCR amplification and high throughput DNA sequencing
Isolated genomic DNA was amplified using conserved degenerate primers targeting 16S rRNA gene V1-V2 and V4 regions as we described previously [13]. Two different regions were used in order to reduce biases in community composition estimates when only a single rRNA gene region is used. PCR amplification was performed as described [22]. Purified amplicons were sequenced on Ion Torrent Personal Genome Machine. We obtained an average of 48,942 sequence reads per sample, which were then processed in QIIME [23] using default pipeline and parameters. Sequences were annotated against Ribosome Database Project database. Cell counts were calculated from read counts using our previously described strategy that took into consideration the number of 16S rRNA genes per species genome [14]. The cell counts obtained independently for each sample based on the sequencing of V1-V2 and V4 16S rRNA gene regions were merged together into a single taxon abundance estimate via
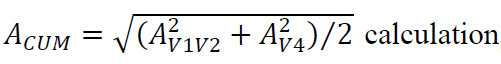
where A is an abundance value for each taxon. PICRUSt was used to predict total functional capacity of each subject’s distal gut microbiome as we did previously [13]. Sequence dataset has been deposited into the Sequence Read Archive repository (BioProject ID PRJNA563912).
Statistical analyses
Principal coordinate analysis and redundancy analysis were performed in MATLAB and R on the genus-level microbial abundance dataset as we described [24]. Phylogenetic UniFrac distance was used to calculate sample (dis)similarity.
We profiled fecal microbiota of 26 adult subjects living in low-income neighbourhoods and consuming a typical Western diet. A food hub was recently established in these communities providing improved access to higher quality fresh foods. A wealth of biometric and dietary information was recorded for each subject (Table 1). Healthy Eating Index [7] was calculated based on the dietary recall at the time of stool collection. While all subjects were free of gastrointestinal symptoms (two subjects reported mild diarrhea at the time of stool collection) and have not consumed antibiotics or probiotics in the prior 4 months, many subjects could be classified as overweight (25 ≤ BMI < 30) or obese (BMI ≥ 30). Participants varied significantly in BMI, age, daily caloric intake, and consumed macronutrient amounts (Table 1).
Table 1. Characteristics of subject cohorts
|
Measured variable |
Low HEI group (N=7) |
Medium HEI group (N=11) |
High HEI group (N=8) |
|||
|
mean ± SD |
range |
mean ± SD |
range |
mean ± SD |
range |
|
|
HEI |
37.4±3.4 |
32-43 |
47.8±3.4 |
44-53 |
63.8±6.4 |
57-75 |
|
Age, years |
44.6±8.5 |
30-51 |
51.3±13.0 |
29-64 |
49.1±12.7 |
33-66 |
|
BMI |
26.8±3.8 |
22.6-34.4 |
27.4±8.1 |
17.9-44.1 |
28.3±4.3 |
22.7-34.7 |
|
Daily calories, cal |
2113±905 |
1055-4159 |
1784±775 |
897-3522 |
2318±1175 |
1175-4971 |
|
Daily carbs, g |
240±128 |
93-515 |
217±112 |
95-488 |
295±208 |
111-782 |
|
Daily proteins, g |
73±41 |
23-144 |
75±26 |
41-112 |
89±36 |
48-148 |
|
Daily fats, g |
97±40 |
55-184 |
69±31 |
23-130 |
90±35 |
48-152 |
|
Daily fiber, g |
12±6 |
7-25 |
14±7 |
6-26 |
25±17 |
9-63 |
All fecal samples were subjected to 16S rRNA gene-based high throughput sequencing. While we observed significant subject-to-subject variability in microbiota composition, no consistent differences were found among HEI groups at either class or genus taxonomic levels (Figure 1A). All samples were dominated by classes Clostridia, Bacteroidia, and Actinobacteria.
Interestingly, several subjects housed substantial numbers of Methanobacteria (member of Archaea). Unconstrained weighted UniFrac-distance based principal coordinates analysis did not separate samples according to HEI group (data not shown). Orthogonal projections to latent structures discriminant analysis of the genus abundance dataset which used HEI as classifying variable similarly failed to produce an acceptable model, indicating that there were no microbial genera that could separate the interrogated fecal microbiota according to subject’s HEI. Similarly, PICRUSt-generated predicted functions of gut microbial metagenomes did not separate samples according to HEI index (data not shown), and no correlation was evident between macronutrient consumption and abundances of the corresponding nutrient degradation pathways (e.g., there was no association between higher daily protein intake and higher prevalence of amino acid metabolism genes).
To assess the contribution of our biometric and dietary variables to fecal microbiota composition, we carried a weighted UniFrac-distance based redundancy analysis (RDA), where microbial genus abundance dataset was constrained by our explanatory variables [25]. Among all explanatory variables tested, age was a statistically significant contributor to the microbiota variation in the constrained RDA space (Figure 1B). Similarly, to the PCoA output, there was only a minor dispersion of samples according to HEI group along the constrained axis 2. Intriguingly, HEI and BMI indices displayed opposite effects on the observed distribution of samples in the RDA space. There was no direct correlation between the subjects’ HEI and BMI values (Pearson correlation coefficient Rp=0.08), indicating that the revealed relationships were due to the effect of each explanatory variable on the fecal microbiota composition. Dietary variables did not contribute appreciably to the observed microbiota composition (see Figure 1B).
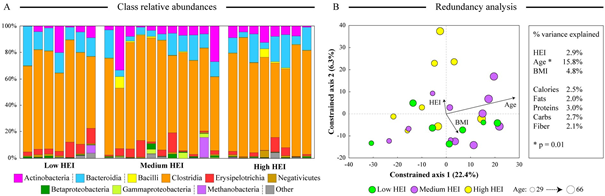
Figure 1. Differences in fecal microbiota composition among subjects. Panel A shows the microbial community structure at the class level. Classes are ordered according to the phylum (see legend). Samples are ordered from the lowest (left-most sample) to the highest (right-most sample) HEI value. Panel B displays a biplot output of the constrained redundancy analysis of the genus-level microbiota abundance dataset. Each sample is shown as circle colored according to the HEI group (see legend); three main explanatory variables are represented by arrows that denote the magnitude and the direction of the effect of each variable. The diameter of each circle is proportionate to the subject’s age. The percent of dataset variability explained by each constrained axis is shown in parentheses in axis titles. Overall contribution of each tested explanatory variable to the total variance of the genus abundance dataset is displayed to the right of the biplot.
Dietary patterns have been shown to influence the composition and functional capacity of human gut microbiota in multiple studies [14, 15]. In this work we sought to assess if diets of different nutritional quality (expressed by HEI) can be associated with differences in subject’s gut microbiota. We found no such consistent associations in our dataset, in part due to significant variability among subjects in age, BMI, and daily caloric intake (see Table 1). Constrained redundancy analysis indicated that age was the dominant (and the only statistically significant) predictor of microbiota composition, consistent with previous reports of age-related shifts in gut microbial composition [26]. Other dietary and biometric variables did not contribute above 5% to the overall microbiota composition variability (see figure 1B). Interestingly, we observed an opposite effect of diet quality (HEI) and weight (BMI) on microbiota composition. It is tempting to speculate that adopting healthier dietary habits thus shifts gut microbiota towards a healthier state, as opposite to the detrimental effects that were reported in studies of obesity-related microbiota [27, 28]. However, the cohort size in this study was small, and this finding needs to be further evaluated in a larger sample set.
We are thankful to Alex Gordon for his assistance in processing and aliquoting OMR-200 tubes, to Denise Kramer for her assistance in acquiring sequencing data, and to Chaturia Rouse for her assistance with data collection. This research was supported by the National Institute of Diabetes and Digestive and Kidney Diseases of the National Institutes of Health under Award Number R01DK108184 to DAF and ARS and by the National Science Foundation award DBI-1335772 to OP.
AUTHOR CONTRIBUTIONS
DAF, ARS, and OP conceived and designed the study. SR and XB collected samples, processed dietary information, and generated sequencing data. SR and OP analyzed the data. OP, DAF, and ARS wrote the manuscript.
Spanakis, E.K. and S.H. Golden, Race/Ethnic Difference in Diabetes and Diabetic Complications. Current diabetes reports, 2013. 13(6): p. 10.1007/s11892-013-0421-9. PMid:24037313
View Article PubMed/NCBIJackson, C.L., et al., Black-White Disparities in Overweight and Obesity Trends by Educational Attainment in the United States, 1997-2008. Journal of Obesity, 2013. 2013: p. 140743. PMid:23691282
View Article PubMed/NCBIEgan, B.M., et al., Hypertension in the United States, 1999 to 2012: progress toward Healthy People 2020 goals. Circulation, 2014. 130(19): p. 1692-9. PMid:25332288
View Article PubMed/NCBIO'Keefe, E.B., J.P. Meltzer, and T.N. Bethea, Health Disparities and Cancer: Racial Disparities in Cancer Mortality in the United States, 2000-2010. Frontiers in Public Health, 2015. 3: p. 51. PMid:25932459
View Article PubMed/NCBIBleich, S.N., et al., Health inequalities: trends, progress, and policy. Annu Rev Public Health, 2012. 33: p. 7-40. PMid:22224876
View Article PubMed/NCBIStory, M., et al., Creating healthy food and eating environments: Policy and environmental approaches. Annual Review of Public Health, 2008. 29: p. 253-272. PMid:18031223
View Article PubMed/NCBIGuenther, P.M., et al., Update of the Healthy Eating Index: HEI-2010. J Acad Nutr Diet, 2013. 113(4): p. 569-80. PMid:23415502
View Article PubMed/NCBIWang, D.D., et al., Trends in dietary quality among adults in the United States, 1999 through 2010. JAMA Intern Med, 2014. 174(10): p. 1587-95. PMid:25179639
View Article PubMed/NCBICummings, J.H. and H.N. Englyst, Fermentation in the human large intestine and the available substrates. Am J Clin Nutr, 1987. 45(5 Suppl): p. 1243-55. PMid:3034048
View Article PubMed/NCBIClausen, M.R. and P.B. Mortensen, Kinetic-Studies on Colonocyte Metabolism of ShortChain Fatty-Acids and Glucose in Ulcerative-Colitis. Gut, 1995. 37(5): p. 684-689. PMid:8549946
View Article PubMed/NCBIDavis, C.D. and J.A. Milner, Gastrointestinal microflora, food components and colon cancer prevention. J Nutr Biochem, 2009. 20(10): p. 743-52. PMid:19716282
View Article PubMed/NCBIDevkota, S., et al., Dietary-fat-induced taurocholic acid promotes pathobiont expansion and colitis in Il10-/- mice. Nature, 2012. 487(7405): p. 104-8. PMid:22722865
View Article PubMed/NCBIAgans, R., et al., Dietary Fatty Acids Sustain the Growth of the Human Gut Microbiota. Applied and Environmental Microbiology, 2018. 84(21): p. e01525-18. PMid:30242004
View Article PubMed/NCBIShankar, V., et al., Differences in Gut Metabolites and Microbial Composition and Functions between Egyptian and U.S. Children Are Consistent with Their Diets. mSystems, 2017. 2(1): p. e00169-16. PMid:28191503
View Article PubMed/NCBIWu, G.D., et al., Linking long-term dietary patterns with gut microbial enterotypes. Science, 2011. 334(6052): p. 105-8. PMid:21885731
View Article PubMed/NCBILozupone, C.A., et al., Diversity, stability and resilience of the human gut microbiota. Nature, 2012. 489(7415): p. 220-30. PMid:22972295
View Article PubMed/NCBIHester, C.M., et al., Fecal microbes, short chain fatty acids, and colorectal cancer across racial/ethnic groups. World Journal of Gastroenterology: WJG, 2015. 21(9): p. 27592769. PMid:25759547
View Article PubMed/NCBIMiller, G.E., et al., Lower Neighborhood Socioeconomic Status Associated with Reduced Diversity of the Colonic Microbiota in Healthy Adults. PLoS One, 2016. 11(2): p. e0148952. PMid:26859894
View Article PubMed/NCBIPike, S.N., et al., Examining the food retail choice context in urban food deserts, Ohio, 2015. Preventing Chronic Disease, 2017. 14(160408). PMid:28981402
View Article PubMed/NCBIMa, Y., et al., Number of 24-Hour Diet Recalls Needed to Estimate Energy Intake. Annals of Epidemiology, 2009. 19(8): p. 553-559. PMid:19576535
View Article PubMed/NCBIRigsbee, L., et al., Optimizing the analysis of human intestinal microbiota with phylogenetic microarray. FEMS Microbiol Ecol, 2011. 75(2): p. 332-42. PMid:21155851
View Article PubMed/NCBIPaliy, O. and B.D. Foy, Mathematical modeling of 16S ribosomal DNA amplification reveals optimal conditions for the interrogation of complex microbial communities with phylogenetic microarrays. Bioinformatics, 2011. 27(15): p. 2134-40. PMid:21653518
View Article PubMed/NCBICaporaso, J.G., et al., QIIME allows analysis of high-throughput community sequencing data. Nat Methods, 2010. 7(5): p. 335-6. PMid:20383131
View Article PubMed/NCBIPaliy, O. and V. Shankar, Application of multivariate statistical techniques in microbial ecology. Mol Ecol, 2016. 25(5): p. 1032-57. PMid:26786791
View Article PubMed/NCBIShankar, V., R. Agans, and O. Paliy, Advantages of phylogenetic distance based constrained ordination analyses for the examination of microbial communities. Sci Rep, 2017. 7(1): p. 6481. PMid:28743891
View Article PubMed/NCBIMarathe, N., et al., Changes in human gut flora with age: an Indian familial study. BMC Microbiol, 2012. 12: p. 222. PMid:23013146
View Article PubMed/NCBIZhang, C., et al., Dietary Modulation of Gut Microbiota Contributes to Alleviation of Both Genetic and Simple Obesity in Children. EBioMedicine, 2015. 2(8): p. 968-984. PMid:26425705
View Article PubMed/NCBIRidaura, V.K., et al., Gut microbiota from twins discordant for obesity modulate metabolism in mice. Science, 2013. 341(6150): p. 1241214. PMid:24009397
View Article PubMed/NCBI