Weichun Pan
Telephone Number: 86-571-28008972; ORCID number: 0000-0002-4030-8363
Email address: panweichun1@yahoo.com
© 2019 Sift Desk Journals. All Rights Reserved
VOLUME: 4 ISSUE: 1
Page No: 563-580
Weichun Pan
Telephone Number: 86-571-28008972; ORCID number: 0000-0002-4030-8363
Email address: panweichun1@yahoo.com
Weiwei Lin1, Xiuzheng Zhang1, Weichun Pan1,*, Beijing Han1, Jiamei Fan1, Ang Li1
1Food Safety Key Laboratory of Zhejiang Province, The School of Food Science and Biotechnology, Zhejiang Gongshang University, Hangzhou, China 310018
Jinfa Ming(mingjinfa@qdu.edu.cn)
Yan-Yan Zhao(zhaoyanyan@hfut.edu.cn)
Vasiliki Evageliou(evageliou@aua.gr)
Weichun Pan, Influence of Shear on the Gelation of Myofibrillar Protein Extracted from Humboldt Squid (Dosidicus gigas)(2019)SDRP Journal of Food Science & Technology 4(1)
The effects of heat and shear at various pH and salt concentrations on the denaturation of myofibrillar protein extracted from Humboldt squid (Dosidicus gigas) are investigated. Squid tissues subjected to heating and simultaneous heating and shear force treatments differ in the extent of myofibrillar protein conformational change and composition. Gel formation processes differ in these two treatments, as determined by the complex viscosity (h*) measurement and light-scattering technique. Low-field nuclear magnetic resonance spectroscopy suggests shear promotes hydrophobic patch exposure during the gelation process to generate a product with high water content and compact structure. Shear-treated products therefore have large T2 values with small proportions compared with untreated products. A comparison of gelation and protein crystal nucleation suggests that protein gelation is driven by hydrophobic interactions.
Keywords: shear; myofibrillar protein gelation; Humboldt squid; structure; hydrophobic interactions
In a moving fluid system, shear stress is incurred wherever a solid boundary exists. Given both the highly sensitive nature of protein molecules to their physicochemical environment, and the pervasive existence of shear stress, the influence of shear stress on protein molecule stability has been studied extensively. The pharmaceutical industry is particularly interested in the effects of shear stress on protein molecule stability, given denaturation might influence the shelf-life of protein pharmaceuticals, and maybe even cause clinical side-effects [1-2].
Contradictory accounts of the influence of shear stress on protein molecule stability exist. The mechanical energy contributed by shear stress should be comparable to heat energy to observe lysozyme molecule denaturation [3]. However, Ashton et. al. [4] found shear stress to be 3 orders of magnitude smaller to repetition the same effect, a result also reported by Byington et. al. [5-6]. In rheological assessments the phenomena of lysozyme reversible conformation change [7] and cluster formation [5] suggests some conformations could be created only via shear treatments. In addition, some conformations can be generated only by shear treatment, endowing a gel with textural properties not otherwise obtained by heating. This stems from the fact that the pattern of exposed residues is dictated by molecular conformation and regulates the bond-formation between neighbor protein molecules in the gelation process, thereby determining a gel’s textural properties.
This work is inspired by the result of Charm and Lai [8], which state the parameter of ( the shear rate and the time of exposure) instead of or/and governing protein molecule conformation change when shear field exists. It is common in food industry that the shear rate could be small but the exposure time could be long. As a result, the product of could be comparative to the value reported in abovementioned literature. But since the traditional wisdom in food industry usually focuses on the shear rate, its influence on protein conformation is ignored.
The second motivation comes from the fact that non-globular protein molecules are pervasive in food and have an innate asymmetrical geometrical structure, giving them an orientational preference in a shear field [2]. Bond-formation in the gelation process is also orientational. Therefore, the introduction of a shear field could be used to influence the protein gelation process. A large gel size might also generate remarkable tensile force, exacerbating conformation change due to a shear field [9].
Whether the influences generated by the shear field occur in protein gels is not well studied [10]. On the other hand, the results presented in Fig S1 revealed the potential of this technique to regulate myofibrillar protein gelation extracted from Humboldt squid.
We studied myofibrillar proteins of Humboldt squid for two reasons: 1) their physical properties are well-known, and 2) this squid is abundant and highly nutritious [11]. Unfortunately, without pretreatment, Humboldt squid tissues are bitter, and their proteins highly soluble, limiting demand for consumption [12]. Application of a chemical (like sodium carbonate (Na2CO3)) to the flesh removes bitterness, increasing the potential for use of this squid as a raw material for surimi, once its poor gelation properties are overcome [13-14].
As pH and salt concentration can significantly influence interactions between protein molecules and molecular conformation [15], a pH range of 5.5–9.5 (covering the isoelectric point (pI) of the myofibrillar proteins) and potassium chloride (KCl) as a salt at concentrations 0.1, 0.5 and 0.9 M were applied in this study.
Solutions were subjected to three treatments: 1) controls (without treatment); 2) heating only (a traditional gelation process); and 3) simultaneous heating and shearing (HS).
2.1 Raw materials
Humboldt Squid, caught and immediately frozen at −20°C, were obtained from the Zhoushan Second Marine Fisheries Company in Zhejiang, China. Within three months of collection squid (usually four of average mantle length 1 m) were defrosted at room temperature, deheaded, gutted, and cleaned using water. Mantle and fin tissues were bagged and stored at −80°C for further experiments.
Reagent grade Na2HPO4, KH2PO4, KCl, CH3CH2OH, and CH3COOH were provided by Huipu Inc. (Hangzhou, China). All other reagent grade chemicals were purchased from Sigma (St. Louis, MO, USA).
2.2. Gel formation
Mixtures containing a pellet of myofibrillar protein extracted from squid (procedure detailed in Supporting information) and a KCl solution of the appropriate pH in a 1:2 weight ratio were prepared for gel formation. The solutions were left to stand for 3 h for maximum protein dissolution.
Myofibrillar protein gels were prepared using two methods. The first comprised three consecutive steps: heating the solution at 40°C for 60 min, then at 90°C for 30 min, before cooling to 0°C for 30 min. The solution was refrigerated overnight before being centrifuged at 2000 × g for 10 min at 4°C, after which the supernatant and sediment were collected. All procedures occurred in a parafilm-covered 100 mL beaker to prevent water loss during heating.
In the second method, the protein gel was created using a rheometer (MCR 302, Anton Paar GmbH, Graz, Austria) with a concentric cylinder system (CC50), at operating parameters 0.3% strain (in the region of linear elasticity) and 1 Hz, after which the solution was transferred to a 100 mL beaker and cooled to 0°C for 30 min. Other procedures were as described for heating gelation.
In both methods, water temperature was maintained using a water tank connected to a refrigerated/heating circulator (F12-MA, Julabo GmbH, Seelbach, Germany). The cooling procedure was similar as the heating gelation.
2.3 Circular dichroism (CD) analyses
CD spectra were recorded in the far-UV range (250–190 nm) using a CD spectropolarimeter (J-815, Jasco Corp., Tokyo, Japan) and a 0.1-cm quartz CD cuvette at 25 °C. The protein concentration for analysis was maintained at 50 µg mL−1 for all samples; the corresponding solutions without protein were used as blank buffers. The scan rate, response, bandwidth, and sensitivity were set at 50 nm min−1, 0.25 s, 1.0 nm, and 0.1°, respectively. Each spectrum was recorded in triplicate. The percentages of α-helix, β-sheet, β-turn, and random coil structures were assessed using the protein secondary structure estimation program provided with the Jasco J-815 spectropolarimeter [16].
2.4 SDS-PAGE
PAGE using dissociating SDS and a Tris–glycine–SDS buffer system in a continuous gel (from 6% to 18%) was performed as described by Laemmli [17] using a Mini-Protean™ Tetra system (Bio-Rad Laboratories, Richmond, CA, USA). All proteins were analyzed using their electrophoretic protein patterns. Samples were subjected to a dissociating system containing 0.1 M Tris–HCl, 4% SDS (w/v), 20% glycerol (v/v), 5 × 10⁻⁵ bromophenol blue (3′,3ʺ,5′,5ʺ-tetrabromophenolsulfonephthalein, w/v), and 200 mM dithiothreitol, denatured by heating at 100 °C for 5 min and then cooling to room temperature (~20 °C) before loading. The loading sample concentration was 2 mg mL−1. The electrophoretic runs were performed at 17–25 °C for half an hour at 70 V, then 3 h at 110 V. A broad range of molecular weight protein standard solutions were used (Bio-Rad Laboratories), namely myosin (200 kDa), β-galactosidase (116 kDa), phosphorylase b (97.2 kDa), bovine serum albumin (66.4 kDa), ovalbumin (44.3 kDa), carbonic anhydrase (29 kDa), trypsin inhibitor (20.1 kDa), lysozyme (14.3 kDa), and bovine aprotinin (6.5 kDa). After electrophoresis, the gel was stained with 0.1% (w/v) Coomassie Brilliant Blue R-250 (Bio Basic Inc., Markham, Canada) in 40% ethanol and 10% acetic acid and then destained with 40% (v/v) ethanol and 10% acetic acid. The patterns of the constituents of the myofibrillar proteins at various pH values and salt concentrations were analyzed with Quantity One software (Bio-Rad) using a computer with a scanner (GS800, Bio-Rad).
2.5 Theory of light scattering
For static light scattering (SLS) (since particle size is close to the wavelength of the detecting light), Zimm plots were used to determine the intermolecular interactions, the second virial coefficient A2, and the radius of gyration Rg in accordance with Zimm [18]:
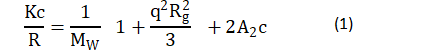
where: K is a system constant defined as k=〖((2πn0)⁄(λ2))〗2/NA (〖dn/dc)〗2 [19], in which n0 is the refractive index of the solvent, ~ 1.3342, 1.3383 and 1.3424 for 0.1 M, 0.5 M and 0.9 M KCl solutions, respectively [20]; λ is the wavelength of laser light, 632.8 nm; NA is Avogadro’s number, dn/dc is the derivative of the refractive index n with respect to solution mass concentration; MW is the molecular weight of the solute molecule; and q is the scattering wave vector =4πn_0 sin(θ⁄2)/λ, where q is the angle of the detector.
For dynamic light scattering (DLS), the correlation function of the light scattering intensity g2(t) was expressed after Pan et al.[21]:

where: D is the amplitude of light intensity; t is the characteristic time of the diffusion of the scatterer, determined by numerically inverting the Laplace transform 〖(g_2 (τ)-1)〗(1/2) of with the aid of the software package provided by ALV-Gmbh based on CONTIN algorithm [22-23]; and e is noise. Based on the Stokes-Einstein relation, the equivalent hydrodynamic radius RH could be estimated by:
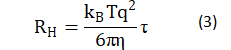
where η is the viscosity of solvent in the measured solution.
Light-scattering was performed using the ALV/CGS-3 goniometer (ALV, Langen, Germany) with a He–Ne laser. Refractive index increments were determined by a SEC-3010 DN/DC differential refractometer (WGE Dr. Bures, Dallgow-Doeberitz, Germany), operating at 620 nm wavelength and 25°C.
For SLS measurement, sample concentrations ranged from 0.1 to 1 mg mL-1 to maintain a single phase and monomeric protein in the solution. Measurement angles varied from 15–90° in 5° increments. Data were analyzed using software provided by the ALV Company.
For DLS determination, a protein solution of concentration 1 mg mL−1 was prepared. To eliminate dust or air bubbles, supernatants from samples centrifuged at 5000 × g for 15 min at 4°C were collected. Each DLS measurement was performed at 25°C, a measurement angle of 90° at acquisition time of 1 min; measurements were performed in triplicate.
2.6. Apparent viscosity measurement during protein gelation
The saturated myofibrillar protein solution at pH 7.5 and KCl 0.1 M (similar to the actual surimi process) was used to record apparent viscosity via the MCR 302 rheometer with a concentric cylinder system (CC50) during gelation. Heating rates were 1°C min-1 and 5°C min-1; shear rates were 0.1s-1, 1s-1 and 10s-1; the temperature range was 20–90°C. Each sample was tested in triplicate.
2.7. Water-holding capacity (WHC)
The WHC of gels was determined using a modified version of Kuhn and Foegeding [24]. Gels were cut with a metal cork borer to obtain cylindrical samples of height 1 cm and diameter 1 cm. Before centrifugation, tube weight with and without core samples was determined by balance (ME204E, Mettler-Toledo LLC., Columbus, OH). Core samples were then inserted into centrifugal filtration units (Changsheng Biotech. Co., Hangzhou, China) and spun at 10000 × g for 10 min at 4°C. After removal of expelled fluid, samples were reweighed. Each gel was tested in triplicate; the WHC of each was determined according to:
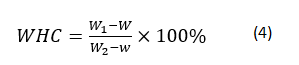
where W represents the weight of the centrifugation tube, and W1 and W2 are the weights of the tube with gel before and after centrifugation, respectively. Each sample was tested in triplicate.
2.8. Low-field nuclear magnetic resonance (LF-NMR) measurements
We used an NMR analyzer (PQ 001, Niumag Co., Ltd., Shanghai, China) for LF-NMR measurements. Samples (5.0 g) were placed in NMR glass tubes of diameter 60 mm. T2 relaxation times were measured using the Carr-Purcell and Meiboom-Gill sequence. T2 measurements were performed using a t value of 400ms (time between 90° and 180° pulses). Data from 1200 echoes were acquired as 32 scan repetitions, with a 1 s repetition time between successive scans, with all measurements made within 2 min. These steps were repeated four times at 25°C. The data were analyzed using MultiExp Inv. analysis software (Niumag Co., Ltd., Shanghai, China) by fitting a curve to the continuous distribution of exponentials using the following:
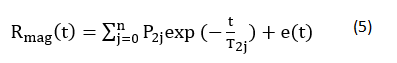
where: Rmag, represents the total magnetization signal from the sample; P2j and T2j represent the spin-spin relaxation amplitude and time, respectively, of the jth fraction; and e(t) represents the residual error. Each sample was tested in triplicate.
The T20 value is the relaxation time of water molecules at 1–10 ms, and indicates whether water molecules are closely associated with macromolecules; T21 is the relaxation time of water molecules at 30–60 ms, and identifies whether water molecules are trapped in highly organized protein structures such as tertiary or quaternary structures; and T22 is the relaxation time of water molecules at 100–400 ms, and indicates whether water molecules are highly mobile and occur within large pores of the gel [25-26].
The T20 value suggests weak interactions between water molecules and surrounding macromolecules, the T21 value reveals that large spaces exist to host these water molecules, and the T22 value reveals the corresponding water molecules can be easily removed from the gel.
2.9 Statistical analysis
One-way analysis of variance was used to determine the significance of any differences between means, followed by Duncan’s multiple-range test, using SPSS version 20.0 (IBM, USA).
3.1. Effect of shear on molecular conformation
Since there is a remarkable molecular conformation change when salt concentration shifts from 0.1 M to 0.5M but no further changes occurs when salt concentrated to 0.9 M, the range of salt concentration in this study was defined from 0.1 M – 0.9 M [15].
The protein conformational changes caused by pH and KCl variations were supported by CD analysis. Fig. 1a and 1b show that [q] in samples via heating gelation is larger than that in HSs, which may comes from the fact that solutions of heating gelation contains more soluble proteins than HS solutions (Fig. S2). Spectral shifts due to shear cause change in the distributions of secondary structures (Fig. 1c and 1d). Shear treatment at pH 5.5 and low salt concentrations (0.1 M, 0.5 M) increased the a-helix and b-sheet contents, whereas at 0.9 M KCl, only the b-sheet content increased. Furthermore, all changes occurred at the cost of turn content, suggesting that shear treatment favored regular protein conformations at low pH (5.5). a-helix content increase due to shear treatment is astounding since shear treatment favors the stable secondary structure, b-sheet, and against a-helix [27-28]. This odd phenomenon may come from the covalent bond formation between neighbor protein molecules, which could benefit a-helix survive during gelation process. Since protein molecule position distribution in solution remarkably modifies with shear induction, the patterns of covalent bond formation between neighbor protein molecules vary significantly as well.
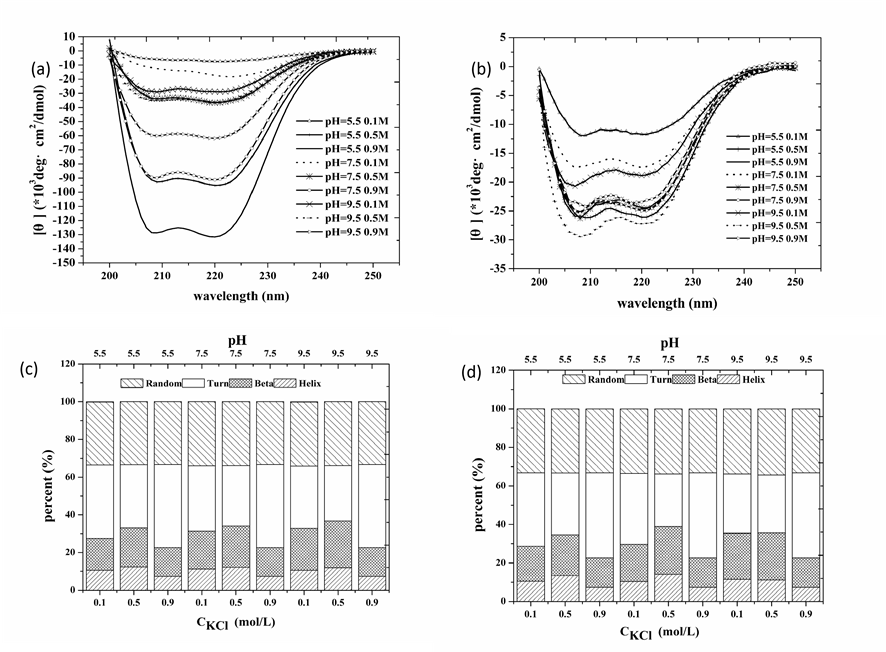
Figure 1. Effects of shear treatment during myofibrillar protein gelation on protein molecule secondary structure. (a) and (b) are CD spectrums of myofibrillar protein with the absence of (a) and the presence of shear treatment (b) respectively, while (c) and (d) the corresponding secondary structure distributions
Not only does shear affect the secondary structure distribution of a protein, it affects its composition in solution also. Fig. 2 reveals that heating created new protein species of low molecular weight at the cost of myosin heavy chain (MHC) and heavy meromyosin (HMM) proteins, such as those above actin in the SDS-PAGE electrophoresis patterns in samples via heating gelation and HS, respectively. This implies molecular degradation of MHC and of HMM during heating. HS contains more tropomyosin but less myosin light chain (MLC) than solutions of heating gelation.
3.2. Effects of shear on intermolecular interactions
Since the intermolecular interactions regulate the phase transitions in solutions [29-30], it is worth to investigate the shear influence on these properties. Meanwhile, the state of individual protein and its time evolution in gel are other key facts to determine the gel properties but are hard to be accessed by current techniques. Regarding to this question, the fluorescence spectroscopy is a promise solution [31]. However myofibril contains at least 10 species of protein (Fig. 2). It is almost impossible to distinguish molecular conformation changes of each protein species via fluorescence signals. Although the gene engineering could solve this question via plugging the special fluorescence residue in the amino acid sequence of target protein molecule, this procedure is very difficult and the new residue could complicate the study since its influence on the properties of host molecule needs to be assessed. The alternative way is to probe protein molecules and its aggregators in coexisting solution of gel. The philosophy behind this is that all protein species in solution are equilibrium to gel thermodynamically. Thus, the properties of these species could be used to estimate the ones to construct gel, and thereby to assess the thermodynamic properties of gel, key information to control gelation process.
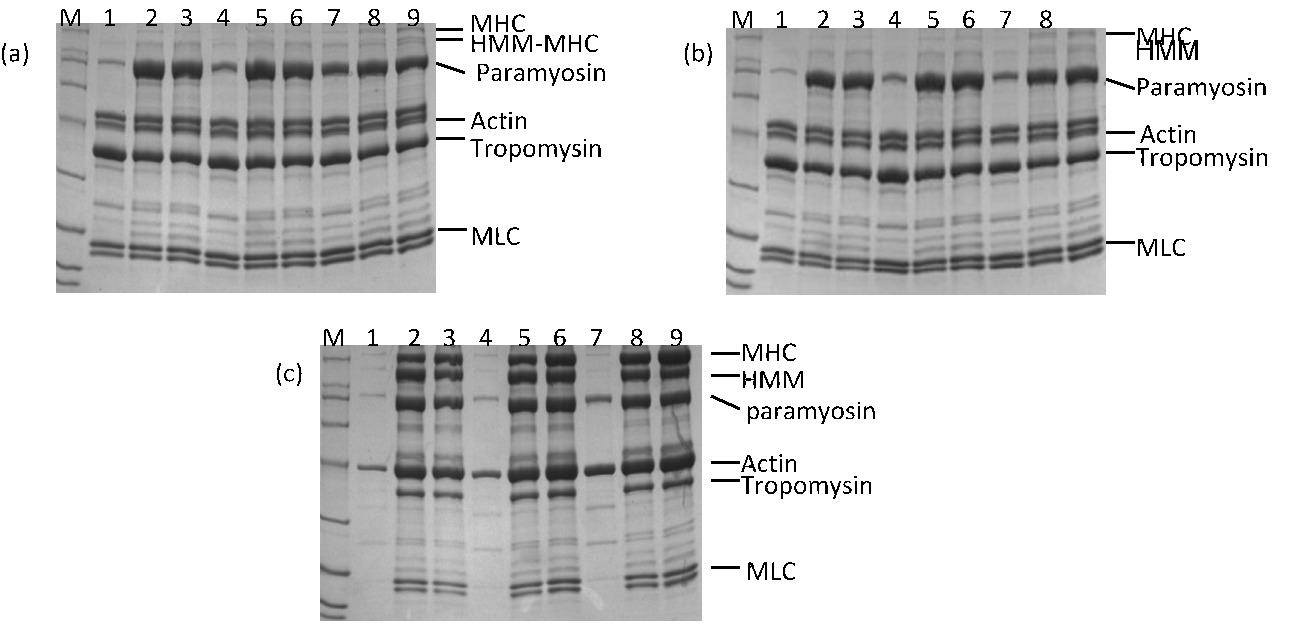
Figure 2 SDS-PAGE electrophoresis analyses of supernatants after myofibrillar protein gelation (a) without and (b) with shear treatment; M indicates markers. Bands 1–3 represent solutions of pH 5.5 and KCl concentrations from 0.1 M to 0.9 M with a step of 0.4 M. Bands 4–6 represent solutions of pH 7.5 and the same order of KCl concentrations as for bands 1–3. Bands 7–9 represent solutions the same as those for 1–6, except at pH 9.5. (c) Untreated reference solution.
Fig. 3 shows that intermolecular interactions, characterized by the second virial coefficient A2, are affected by the pH and KCl concentration. For control solutions, A2 increased with salt concentrated until it attained to 0.5 M. However salt with further increase did not affect A2. This complex salt concentration dependency of intermolecular interactions comes from two facts, 1) the double-layer force via tune the Debye-length modification, and 2) protein molecule conformation change. But in high salt concentration region (>0.5 M), both facts would be almost independent of salt concentration [15]. In addition, in this high salt concentration range, A2 is independent of pH, which is contrast to low salt concentration (0.1 M) in which A2 reduces with pH enhancement. This is due to protein molecule conformation modification by pH [32].
In heating gelation experiments, at pH 5.5, increased slightly as KCl concentration increased from 0.1 to 0.9 M. In contrast, at pH 9.5, A2 kept increase with salt concentrated throughout the whole study range. The interest phenomenon occurred at pH 7.5, in which attained maximal at 0.5 M KCl (Fig. 3). On the other hand, pH influence depends on salt concentration as well. In 0.1 M KCl solutions, attained minimal at pH 7.5. With salt concentration further rising to 0.5 M, A2 increased and eventually saturated with pH rising. In 0.9 M KCl solutions, the local minimum appeared at pH 7.5 while the maximum value presented at pH 9.5. This complicate picture of A2 dependency on salt concentration and pH indicates that these two parameters have dramatic influence on myofibrillar protein gelation process and thus are promise means to tune gel properties.
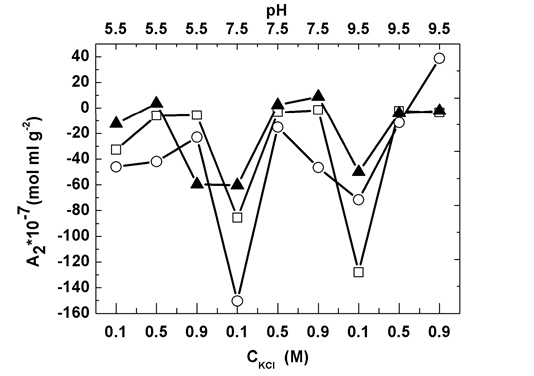
Figure 3. Static light-scattering measurements for second virial coefficient, in myofibrillar solutions subject to three types of treatment: control (open squares), heating gelation (open circles), and HS (solid triangles).
It is noticed that A2s in control solutions has uncorrelation with the ones in heating gelation solutions. This observation hints the complexity of myofibrillar gelation process. The slight change at initial solutions, no matter solution conditions or protein molecule conformation, could cause the unpredictable and remarkable difference in the final solutions during this process, which is one factor to endow food research as art rather than science and is due to the existence of multiply-step reactions, generally speaking, including two steps, protein molecule unfolding and then bond formation between protein molecules [33]. In principle, the variation of intermolecular interactions is able to affect the collision of protein molecules in solution [34] and thereby affect the pattern of bond formation between protein molecules in gel. The existence of protein molecule conformation change due to the surrounding solution condition modification even exacerbates the complexity of protein gelation process. Caveat: protein molecule conformation variation always associates with intermolecular interactions change. Thus, it is hard to investigate the conformation change effect alone in gelation process. Due to the two-fold effect of salt concentration, it is pervasive that salt concentration is widely unitized to optimize protein process [35-36].
The second issue contributing to this uncorrelation phenomenon is the myofibrillar protein composition variation (Fig. 2) because
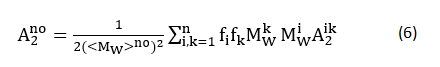
where the subscript k and superscript k denote species k; f is the weight fraction, Mw is the molecular weight, A2jk is the second virial coefficient between species j and k [37]. So far, we are unable to identify which issue dominates this uncorrelation phenomenon!
In HS experiments, the pattern of A2 dependency on salt concentration at fixed pH from 5.5 to 9.5 with 2 steps shifted from the local maximum, to strictly monotonic increase and then to increase to a saturate value (Fig. 3). In contrast, the pattern of A2 dependency on pH changed from the local minimum, to the almost constant value and then to increase to a saturated value.
Furthermore, at low salt concentration range (≤0.5 M), A2s in HS are always larger than the ones in control solutions and solutions of heating gelation. In other words, heat and shear treatment in myofibrillar protein solutions reduces the attraction force between molecules. Since the strong attraction force between protein molecules leads to less solubility [29], while one barrier for Humboldt squid application in surimi industry is the high solubility of its protein [12], shear indeed deteriorates Humboldt squid application in this salt concentration range. However, at 0.9 M, except pH 7.5, A2 obtained in HS was less than the one in solutions via heating gelation.
And the uncorrelation of A2s obtained in three types of solutions with same salt concentration and pH suggests that shear indeed plays a role in myofibrillar protein gelation via modifying not only protein molecule collision during gelation but also its unfolding process, supported by Fig. 1.
3.3. Effects of shear on aggregators
In gelation, a 3D structure nucleates and grows consecutively; therefore the solution equilibrium with gels should have intermediate products which are named by aggregators. The apparent molecular weight and geometrical information (Fig. 4 and Table 1), quantified by the radius of gyration and the hydrodynamic radius, of aggregators provide an avenue to investigate the protein gelation process.
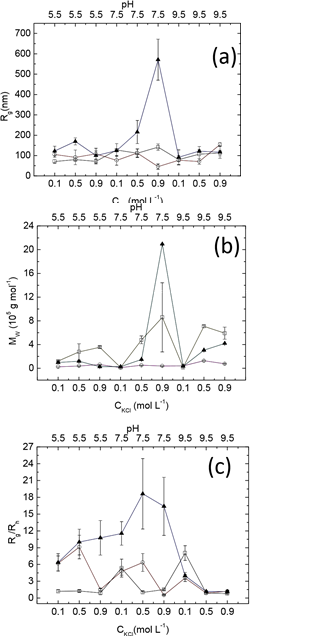
Figure 4. Static light-scattering measurements for the radius of gyration (a), molecular weight (b), and Rg/RH ratios(c), in myofibrillar solutions subject to three types of treatment: control (open squares), heating gelation (open circles), and HS (solid triangles).
Table 1: Dynamic light-scattering results for myofibrillar solutions. Each set of two rows contains the decay time (the upper row) and the corresponding light-intensity percentage (the bottom row). NS denotes the initial untreated myofibrillar solution; ST denotes the supernatant of the heat-treated myofibrillar solution, and SHT denotes the gelation solution subjected to simultaneous heating and shearing.
|
pH CKCl(M) |
5.5 |
7.5 |
9.5 |
|||||||
|
0.1 |
0.5 |
0.9 |
0.1 |
0.5 |
0.9 |
0.1 |
0.5 |
0.9 |
||
|
Decay time (ms)& light intensity percent--age |
NS |
0.77±0.12ax 99.5% |
0.83±0.12ax 99.0% |
1.03±0.25ay 99.7% |
0.31±0.17ax 99.3% |
1.45±0.43ay 80.1% |
1.20±0.41ay 97.0% |
0.13±0.11ax 64.2% |
1.57±1.01ay 65.5% |
1.88±0.67ay 80.2% |
|
ST |
0.22±0.09bx 98.7% |
0.13±0.10bx 59.2% |
0.93±0.42ay 59.0% |
0.21±0.06ax 99.3% |
0.23±0.09bx 99.1% |
1.10±0.83ay 57.6% |
0.28±0.14bx 99.8% |
1.04±0.79ay 84.3% |
1.67±0.44ay 89.5% |
|
|
SHT |
0.25 ±0.11bx 99.2% |
0.22±0.10cx 97.5% |
0.12±0.05bx 88.3% |
0.14 ±0.10ax 50.9% |
0.15±0.14bx 67.4% |
0.45±0.20bx 99.5% |
0.30±0.15bx 99.1% |
1.36±0.96ay 86.5% |
1.31±0.79ay 89.3% |
|
a-c Within columns, means with different superscripts are significantly different (p < 0.01).
x-y Within rows of pH value, means with different superscripts are significantly different (p < 0.01).
A control solution contains aggregators with the radius of gyration fluctuating around 100 nm (Fig. 4a), but the corresponding apparent molecular weights vary by about two orders of magnitude (Fig. 4b). At pH 5.5 and 7.5, molecular weight increased with salt concentration increasing, whereas at pH 9.5, a maximum value appeared at 0.5 M KCl. On the other hand, the pattern of molecular weight dependency on pH shifts from a concave function, to a monotonic one and eventually to a convex one. This observation indicates that an aggregator becomes compact with salt concentrated when pH fixed and is due to the enhancement of screening-effect [38]. The compactness of aggregators could be estimated by the value MW⁄(Rg3 ) of as well (Table 2). This value at pH 5.5 is larger than the ones at pH 7.5 and 9.5.
Table 2: The value of Mw/Rg3
|
pH CKCl(M) |
5.5 |
7.5 |
9.5 |
||||||
|
0.1 |
0.5 |
0.9 |
0.1 |
0.5 |
0.9 |
0.1 |
0.5 |
0.9 |
|
|
NS |
0.34±0.12ax |
0.53±0.36ax |
0.98±0.21ay |
0.01±0.01az |
0.34±0.13au |
0.3±0.21au |
0.02±0.02av |
0.36±0.09aw |
0.42±0.11aw |
|
ST |
0.02±0.02bx |
0.05±0.03bx |
0.05±0.03bx |
0.03±0.03ax |
0.04±0.02bx |
0.41±0.26ay |
0.09±0.05bz |
0.36±0.16ax |
0.02±0.02by |
|
SHT |
0.05±0.04bx |
0.02±0.02bx |
0.03±0.03bx |
0.01±0.01ax |
0.01±0.01bx |
0.01±0.01bx |
0.04±0.02bx |
0.17±0.09by |
0.26±0.12cy |
a-b Within each pair (ST vs. SHT), means with different superscripts are significantly different (p < 0.01).
u-z Within columns, means with different superscripts are significantly different (p < 0.01).
On the other hand, when salt concentration is low (0.1 M), pH change causes charge redistribution around the aggregator surface. Since pH 7.5 close to pI of myofibrillar protein of Humboldt squid, the net charge number an aggregator carrying could decrease and follows up with increase when pH shifts from 5.5 to 7.5 and then to 9.5. The corresponding repulsive interactions among aggregators should have the same trend. And compared with pH 9.5, pI of myofibrillar protein closes to pH 5.5. Thus, based on the abovementioned observation, when pH shifting from 7.5 to 5.5 and then to 9.5, an aggregator become more and more loss with salt concentration maintaining constant.
Unlike the gyration radius, the corresponding hydrodynamic radius of aggregator in myofibrillar protein solutions (Table 1), which is proportional to the decay time RH=(kB Tq2)/6πη τ, demonstrated a distinct pattern of salt and pH dependence. Generally, the hydrodynamic radii of aggregators of control solutions are larger than the ones in solutions of heating gelation and HS. However, the relative position of this value in solutions of heating gelation and HS solutions varies with various pH and salt conditions. This observation reveals that the size of particle is a collective effect of salt concentration, pH and flow field.
In control solutions, generally, with salt concentrated, the hydrodynamic radius increases at each pH value, which could be the consequence of “screening effect” enhancement to reduce the repulsive double-layer force [39]. The other reason behind this phenomenon may be due to salting-in effect [40], a similar behavior observed in globular protein solutions [21, 41]. In contrast, the pH dependency of hydrodynamic radius is complex. In 0.1 M salt solutions, an aggregator shrank due to pH rising, opposite to the trend occurred in 0.5 M and 0.9 M salt solutions.
The traditional theory states that pH regulates the charge distribution around protein molecules and thereby determines the value of net charge protein molecule carrying [42]. On the other hand, salt concentration could modify the Debye-length and thereby influence the double-layer force. But muscle protein molecules distinguish from the abovementioned case and could be suffered conformation change when pH and salt concentration vary [43], which complicates the study of protein gelation process.
On the other hand, heating gelation solutions with high salt concentration (0.9 M) always preferred to contain larger size of aggregators. However, the difference of hydrodynamic radii of aggregator in HS solutions becomes less significant (p>0.01). Only at pH 9.5 the similar behaviors appears as the one in heating gelation solutions. In other pH values, no obvious (p>0.01) hydrodynamic radii difference occurred. Furthermore, the influence of pH on the hydrodynamic radius was not obvious (p>0.01) as well. This observation strongly implies three aspects. 1) Heating process not only denatures protein molecules but also dissolves aggregators. This dissolution process could come from high solubility of itself due to temperature change and/or single molecule denaturation, in which the bond to maintain a protein molecule attachment to an aggregator is broken with this protein molecule leaving to solutions. So far, it is not possible to evaluate which one dominates this size shrinking process. 2) One of the shear influences on gelation is the reduction of the size of aggregator, which could ascribe to the acceleration of protein molecule dissolution from aggregator in heating process with the presence of flow field. And the second potential mechanism is the collective effect of shear and heating to speed up protein molecule denaturation process compared with heating alone. But the difference between these two types of solutions (heating gelation and HS) has low possibility of occurrence, only at 0.9 M salt with pH 5.5 and 7.5, which is reasonable since the extra energy input due to shear is small (~10-3) compared with heating energy [4]. 3) Both salt concentration and pH are able to affect intermolecular interactions and molecular conformation as well. However, regarding to hydrodynamic radius assessment, salt concentration has small influence on aggregator than pH during heating gelation, which could stem from the modification of charge distribution along the aggregator surface and thus affect the stability of bonds between individual molecules and/or even between the one along aggregator surface and the other residing the layer next inside surface. Salt concentration could play the same role as pH doing but at less extent.
Furthermore, except (pH 7.5, 0.9 M) and (pH 9.5, 0.5 M), the values of Mw/Rg3 in solutions of heating gelation are much less than the ones in control solutions, which suggests that heating may cause aggregator dissolution with the pattern of pH and salt concentration dependencies. The shape of aggregator in solutions of heating gelation is different from the one in control solutions as well via the ratio of Rg/Rh (Fig. 4c). In control solutions, except (pH 7.5, 0.1 M) and (pH 9.5, 0.1 M), the geometrical shapes of aggregator are close to spherical. On the other hand, the geometrical shapes of aggregator in solutions of heating gelation depend on detail solution conditions. At pH 5.5, when salt concentration was lower than 0.5 M, aggregators presented as a rod (Rg/Rh >2) [44], in contrast to in 0.9 M solutions in which they were spherical. Similar pattern occurred again at pH 7.5 in ST solutions. However, aggregators had a less length-to-radius ratio compared with the one at pH 5.5. When pH rose to 9.5, in solutions of heating gelation with 0.1 M salt aggregators had less a length-to-radius ratio than in control solutions. And further concentrating salt led the shape of aggregator to spherical.
Generally, the radius of gyration of aggregator in HS solutions is larger than in control solutions and solutions of heating gelation respectively. However, the corresponding apparent molecular weight of aggregator is not so. Only at pH 7.5 and 0.9 M, this value in HS solutions was larger than the one in two other types of solutions. This observation hints the external flow assists protein molecules affinity to aggregator along the particular direction and facilitates the dissolution of protein molecules in other areas of aggregator surface. In other words, compared with an aggregator in control solutions and solutions of heating gelation, the one in HS solutions has large ration of Rg/Rh (Fig. 4c). It is true but at high pH of 9.5 and high salt concentration (≥ 0.5 M), in which this ratio is independent of the types of solutions.
The values of Mw/Rg3 in SHT provide more information of aggregator geometrical properties. At low pH (≤7.5), this value was almost indistringuishable between in solutions of heating gelation and in HS ones but at pH 7.5 and 0.9 M, in which an aggregator was more compact in solutions of heating gelation than the one in HS ones. However, with salt concentrated the relative compactness of aggregator in solutions of heating gelation and HS solutions changed at pH 9.5. At 0.1 M, the compactness of aggregator in both types of solutions (heating gelation and HS) was same. But at 0.5 M, an aggregator in solutions of heating gelation presented more compact while the one in HS solutions did at 0.9 M.
3.4 Effects of shear on the complex viscosity
The time/temperature evolution of rheological properties in myofibrillar protein solutions opens an avenue to probe protein molecule structure changes during the gelation process [45]. However, as shear was generated by rotational movement, the routine rheological properties, such as the storage modulus (G’) and loss modulus (G’’), are difficult to assess using the shear-treatment method. An alternative means to evaluate a solution’s rheological properties uses the complex viscosity η*, as variation in this parameter can reflect changes in solute composition and structure development [46].
The result of apparent viscosity determination at (0.1s-1; 1°C min-1) is unique with the pattern of reduction, enhancement and small fluctuation. The corresponding gel formation process might involve protein denaturation, gel growth, and structure reformation, resulting in a product with the peculiar geometrical shape depicted in Fig. S1a. η* fluctuation may come from the linear geometrical structure formation with the cooperation effect of size increasing and the hydrophobic feature shifting as additional protein molecules join the linear gel (Fig. S1a, c).
Regardless of heating rate, low shear rate in myofibrillar protein solutions was generally associated with high η* (Fig. 5). Since polymer solution viscosity is affected by the volume of solid particles, high viscosity indicates a loose structure with low shear rate. At low shear rate (<1s-1), solutions with low heating rate (1°C min-1) have greater η* than those at high heating rate (5°C min-1). But as shear rate increased to 10s-1, the relative positions between solutions treated by the two heating rate scenarios changed, suggesting that heating rate affected gel structure. η* reduced during the initial heating period (with the exception of 10s-1, 1°C min-1)¾an observation consistent with Egelandsdal et. al. [45], who reported at ~46°C the myosin subfragment-1 denatured to form a 3D network. At lower temperatures, with heating, more and more hydrophobic residues exposure to solution due to the protein molecule conformation change, reducing η* of the solution [47]. Furthermore, tη* reduction suggested the process of protein molecule aggregation was rare in this temperature range. An intriguing question arises from the results of Landoll [47], in which η* first increases, then decreases, as the hydrophobic content of the target polymer increases. Additionally, our results suggest that solutions containing native proteins have greater η* than solutions containing proteins of other conformational states. The reason for this phenomenon is not clear.
The temperature ranges over which η* reduced depended on shear rate. As shear rate increased (at 1°C min-1 heating rate) the rate of reduction in η* increased. However, minimum η*s at different shear rates occurred at almost the same temperature, suggesting this temperature marked the onset of protein molecule conformation change and was independent of shear rate in myofibrillar protein solutions. The occurrence of molecule aggregation depended solely on temperature; it was independent of protein conformation at low heating rate (1°C min-1). In contrast, at the higher heating rate (5°C min-1), minimum η*s occurred at both high temperature and high shear rates. An intriguing phenomenon occurred at 10s-1 and 1°C min-1, in which η* evolution contained the reduction part and fluctuation period. This pattern indicated the failure of a 3D network during heating, supported by Fig. S1c. Results at 0.1s-1 (5°C min-1) and 1s-1 (1°C min-1) are also of interest, as following reduction, η* continued to increase. In accordance with aforementioned theory, the 3D network continued to grow after the initial period of protein denaturation, supported by Fig S1b and d, gels with large volume. Our results suggest that heat rate has a greater influence on protein gelation than does shear rate.
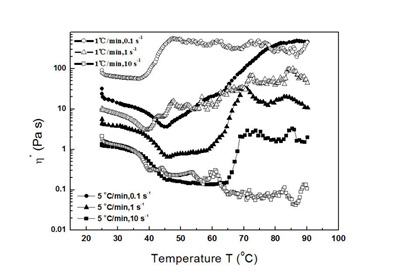
Figure 5. Apparent viscosities of myofibrillar protein solution at different temperatures (1°C min-1 (open symbol), 5°C min-1 (solid symbol)) and shear rates (0.1 s-1 (circle), 10 s-1 (square)).
3.5. Effects of shear on water distribution in gel
Gel water contents reveal positive relationships between WHC, pH and KCl concentration (Table 3). All trends were independent of gelation method. Generally, gel water contents formed from solutions treated by HS were higher than those of gels formed by heating gelation. At 0.1 M KCl, differences between the WHC of these two gel types decreased with increasing pH. However, at 0.5 M KCl, the difference was greatest in three salt concentrations. At 0.9 M KCl and pH 5.5, the WHC was greatest for gels formed by heating gelation. The difference between the WHC of these two gel types (HS and heating gelation) disappeared with increasing pH. This observation is crucial because this trend is inconsistent with the aggregator observations and apparent viscosity measurement.
A second parameter used to evaluate WHC is T2, obtained using LF-NMR spectroscopy. T2 can also be used to determine the microstructural properties of a gel [48].
Figs. 6a and c illustrate how the T2 values of a gel formed using simultaneous heating and shearing are usually larger than those of a gel formed using heating alone. A large T2 implies that the corresponding proton is less restrained and has more freedom [49]. Exposure of hydrophilic residues to the solvent is the main factor restricting proton movement in water for T20 measurements, while the effect of a confined space is the main factor reducing T21 and T22. Therefore, simultaneous heating and shearing reduces the hydrophilic residue content around the gel surface, but the spaces inside protein molecules and gels are large. Figs. 6b and d show the water contents corresponding to each type of water molecule. Although the contents of type 1 water molecules with T20 are similar in the two types of gel, the contents of the other two types of water molecule depend on solution conditions. A likely explanation for this is that protein or protein aggregators in HSs prefer hydrophilic patch exposure to solutions with high polarization.
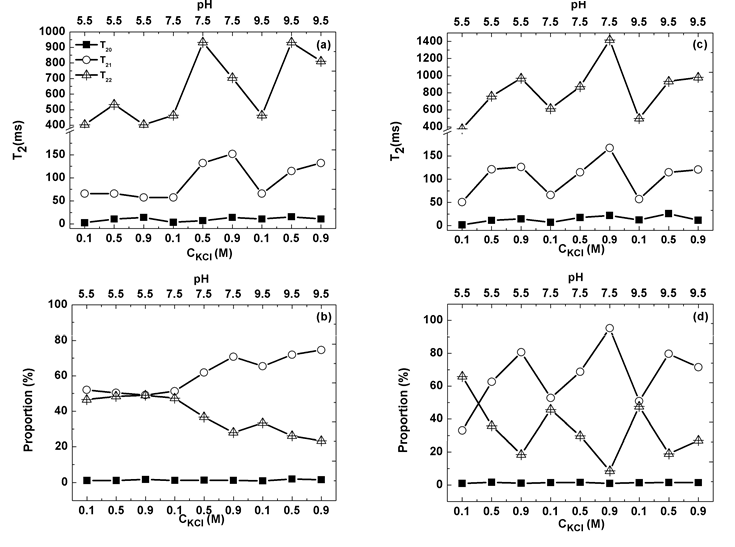
Figure 6. Water distributions in gels produced in ST (a, b) and SHT (c, d); a and c show the decay times of three types of water molecules in gels, determined using low-field nuclear magnetic resonance spectroscopy; b and d show area distributions of these three types of water molecules in gels.
3.6. Hydrophobic interactions during protein gelation
The development of a 3D protein structure involves two competing steps [50]: 1) single protein molecule denaturation, and 2), bond formation between protein molecules. The driving force causing attraction between neighboring protein molecules that enables them to stay together long enough for bond formation needs to be better understood. Bond distances in a protein gel are comparable to or less than the minimum required for intermolecular interactions, and the bond orientation is specific; accordingly, development of a protein gel 3D structure should be similar to protein crystal nucleation and growth processes. However, the difference between the speeds of these two processes is several orders of magnitude. As such, the driving force in protein gelation should be greater than the intermolecular forces normally present in protein solutions, such as Van der Waals and double-layer forces [38]. In gelation, a protein molecule is first denatured, with hydrophobic patch exposure during this step creating a hydrophobic force. Theoretical simulations and experimental results suggest hydrophobic forces are driving forces in gelation [38].
Any factor that affects a hydrophobic force could be used to tune protein gelation. An edible solvent or glycerin that significantly modifies interactions between water molecules and the host protein molecule could be used to tune a hydrophobic force, and therefore modify the protein gelation process. Another potential agent could modify the evolution of protein denaturation or change the speed of this process, such as, for example, calcium ions that affect myofibrillar protein gelation [51].
In Figs. 6a and b, T20 and its proportion are almost constant without significant difference throughout the measured range. Since T20 and its proportion represent the polarity of exposure hydrophilic residue and its area, respectively, the aforementioned observation suggests that the polarity and area of exposure of hydrophilic residue are almost the same in all studied cases. This conclusion implies that protein molecules in all cases undergo similar evolution in molecular conformation. As hydrophobic interactions drive protein gelation, they are independent of KCl concentration and pH in Humboldt squid myofibrillar protein solution. It is well known that ion concentration can reduce the number of water molecules around protein molecules [52]. However, KCl concentration did not influence hydrophobic interactions, suggesting at least some water did not strongly interact with host protein molecules. This result is corroborated by the picture of water structure around a lysozyme molecule, in which three layers characterized by the inside water structure exist: the compact, loose, and buck water layers, from the host molecule to the buck solution [53].
Table 3: Water-holding capacity (WHC) of myofibrillar protein gels.
|
WHC |
CKCl (M) |
||||||
|
pH |
0.1 |
0.5 |
0.9 |
||||
|
ST |
SHT |
ST |
SHT |
ST |
SHT |
||
|
5.5 |
40.7±5.3ax |
55.3±3.5bx |
47.3±5.5ax |
49.9±8.5ax |
59.1±5.1ax |
53.7±2.0bx |
|
|
7.5 |
44.3±7.8ax |
62.5±6.0by |
53.8±5.0ay |
63.8±2.7by |
58.4±4.5ax |
64.5±7.9ay |
|
|
9.5 |
66.7±4.2ay |
73.8±7.9bz |
69.7±8.3az |
74.5±8.8az |
72.6±7.9ay |
74.3±4.4az |
|
a-b Within each pair (ST vs. SHT), means with different superscripts are significantly different (p < 0.01).
x-z Within columns, means with different superscripts are significantly different (p < 0.01).
The effects of shear on gelation in solutions of myofibrillar protein extracted from Humboldt squid were investigated. Generally, shear during gelation favored formation of a gel with high water content and compact structure, and exposure of a high number of hydrophobic patches inside the gel. High pH was beneficial to gel mechanical properties, while the influence of KCl concentration on gel properties depended on pH. The similarity between protein crystallization and gelation processes suggests that hydrophobic interactions are driving forces in the process of gelation.
Our results confirm the feasibility of assessing structural changes ranging from single molecules to 3D networks in the gelation process via the apparent viscosity measurement in food protein systems, differentiating them from the routine biophysical targets due to complex compositions with the strong interactions between them [54]. Both heating rate and shear rate can be manipulated to generate gels with diverse geometrical structures on scale ranging from micrometers to millimeters (Figs. S1, S2). However, predicting combinations of parameters to generate gels with ideal physical properties is not yet possible given unpredictable factors, such as the confinement of 3D network [55].
Our results provide baseline data on the effects of shear on food protein gelation, and could therefore enable the development of surimi processes via optimization of protein gelation using shear. Identification of the forces driving protein gelation might shed further light on developing areas of research, such as neurological disease treatment, and new materials development based on protein aggregation.
Supporting Information: Myofibrillar protein extraction; gelation of myofibrillar protein extracted from Humboldt squid, Fig. S1; scanning electron microscopy (SEM) observations; Figure S2.
This work was supported by grants from the National Natural Science Foundation of China (31171713, 31701650), the Foundation of Food Science and Engineering, the Most Important Discipline of Zhejiang Province (JYTsp20142014), The Natural Science Foundation of Zhejiang Province (LY17C200004).
I. B. Bekard, P. Asimakis, J. Bertolini and D. E. Dunstan, Biopolymers 95, 733-745 (2011). PMid:21544798
PubMed/NCBIE. D. Stasio and R. D. Cristofaro, Biophys. Chem. 153, 1-8 (2010). PMid:20797815
View Article PubMed/NCBIJ. Jaspe and S. J. Hagen, Biophys. J. 91, 3415-3424 (2006). PMid:16891374 PMCid:PMC1614479
View Article PubMed/NCBIL. Ashton, J. Dusting, E. Imomoh, S. Balabani and E. W. Blanch, Biophys. J. 96, 4231-4236 (2009) . PMid:19450493 PMCid:PMC2712145
View Article PubMed/NCBIM. C. Byington, M. S. Safari, J. C. Conrad and P. G. Vekilov, J. Phys. Chem. Lett. 7, 2339-2345 (2016). PMid:27267087
View Article PubMed/NCBIM. C. Byington, M. S. Safari, J. C. Conrad and P. G. Vekilov, J. Cryst. Growth 468, 493-501 (2017).
View ArticleR. Giordano, M. P. Fontana and F. Wanderlingh, J. Chem. Phys. 74, 2011-2015 (1981).
View ArticleS. E. Charm and C. J. Lai, Biotechnol. Bioeng. 13, 185-202 (1971). PMid:4931754
View Article PubMed/NCBIJ. E. Sadler, Annu. Rev.Med. 56, 173-191 (2005). PMid:15660508
View Article PubMed/NCBIA. Lazidis, R. D. Hancocks, F. Spyropoulos, M. Kreuss, R. Berrocal and I. T. Norton, Food Hydrocolloids 53, 209-217 (2016).
View ArticleH. Yamanaka, M. Matsumoto, K. Hatae and H. Nakaya, NIPPON SUISAN GAKKAISHI 61, 612-618 (1995).
View ArticleG. Y. Sánchez-Brambilia, G. Alvarez-Manilla, F. Soto-Cordova, B. G. Lyon and R. Pacheco-Aguilar, J. Aquat. Food Prod. Technol. 13, 55-67 (2004).
View ArticleJ. A. Cortés-Ruiz, R. Pacheco-Aguilar, M. Elena Lugo-Sánchez, M. Gisela Carvallo-Ruiz and G. García-Sánchez, Food Chem. 110 (2), 486-492 (2008). PMid:26049243
View Article PubMed/NCBIM. C. Gómez-Guillén, P. Montero, M. T. Solas and A. J. Borderías, J. Agric. Food Chem. 46, 3440–3446 (1998).
View ArticleR. Zhang, R. Zhou, W. Pan, et al., Food Chem. 215, 256-262 (2017). PMid:27542474
View Article PubMed/NCBIL. Whitmore and B. A. Wallace, Nucleic Acids Res. 32, W668–W673 (2004). PMid:15215473 PMCid:PMC441509
View Article PubMed/NCBIU. K. Laemmli, Nature 224, 680-685 (1970).
View ArticleB. H. Zimm, J. Chem. Phys. 16 (12), 1093–1099 (1948).
View ArticleD. Eisenberg and D. Crothers, Physical Chemistry: with Applications to Life Sciences. (The Benjamin/Cummins, Menlo Park, 1979), pp
CRC Handbook of Chemistry and Physics. (2005).
W. Pan, O. Galkin, L. Filobelo, R. L. Nagel and P. G. Vekilov, Biophys. J. 92, 267-277 (2007). PMid:17040989 PMCid:PMC1697867
View Article PubMed/NCBIS. W. Provencher, Comput. Phys. Commun. 27 (3), 213-324 (1982). 90173-4
View ArticleS. W. Provencher, Comput. Phys. Commun. 27 (3), 229-242 (1982). 90174-6
View ArticleP. R. Kuhn and E. A. Foegeding, J. Food Sci. 56 (3), 789–791 (1991).
View ArticleH. C. Bertram, A. H. Karlsson and H. J. Andersen, Meat Sci. 65, 1281-1291 (2003). 00038-X
View ArticleJ. P. Renou, t. l. J. Kopp, P. Gatellier and G. Monin, Meat Sci. 26, 101-114 (1989). 90033-8
View ArticleT. Giesa, C. C. Perry and M. J. Buehler, Biomacromolecules 17, 427-436 (2016). PMid:26669270
View Article PubMed/NCBII. B. Bekard, P. Asimakis, J. Bertolini and D. E. Dunstan, Biopolymers 95:, 733-745 (2011). PMid:21544798
PubMed/NCBIM. G. Noro and D. Frenkel, J. Chem. Phys. 113, 2941 (2000).
View ArticleM. Muschol and F. Rosenberger, J. Chem. Phys. 107 (6), 1953-1962 (1997).
View ArticleJ. R. Lakowicz, Principles of Fluorescence Spectroscopy, 3rd ed. (Springer Science + Business Media, LLC, New York, NY, USA, 2006).
View ArticleW. Lin, L. Jianrong, P. Weichun, F. Yuying and L. Ang, J. Chin. Inst. Food Sci. Technol. 17, 39-46 (2017).
J. D. Ferry, Adv. Protein Chem. 4, 1-78 (1948). 60004-2
View ArticleD. A. McQuarrie, Statistical Mechanics. (University Science Books, Sausalito, CA, 2000).
T. Dapcevic-Hadnadev, M. Hadnadev, A. Lazaridou, T. Moschakis and C. G. Biliaderis, Food Hydrocolloids 81, 481-489 (2018).
View ArticleN. Chen, C. Chassenieux and T. Nicolai, Food Hydrocolloids 77, 66-74 (2018).
View ArticleH. Yamakawa, Modern Theory of Polymer Solutions. (Haper & Row, New York, 1971). PMCid:PMC285097
J. N. Israelachvili, Intermolecular and Surface Forces, 3 ed. (Academic Press, San Diego, CA, USA, 2011).
P. Atkins, Physical Chemistry, 6th ed. (Freeman, New York, 1998).
J. O. M. Bockris, J. Bowler-Reed and J. A. Kitchener, Trans. Faraday Soc. 47, 184–192 (1951).
View ArticleW. Pan, P. G. Vekilov and V. Lubchenko, J. Phys. Chem. B 114, 7620-7630 (2010). PMid:20423058
View Article PubMed/NCBIA. Fersht, Structure and Mechanism in Protein Science. (W. H. Freeman, New York, 1999).
R. Zhou, Q. Ni, W. Lin, et al., J. Chin. Inst. Food Sci. Technol., 32–39 (2015).
W. Schärtl, Light Scattering from Polymer Solutions and Nanoparticle Dispersions. (Springer, Leipzig, Germany, 2007).
B. Egelandsdal, K. Fretheim and K. Samejima, J.Sci. Food Agric. 37, 915-926 (1986).
View ArticleJ. M. Dealy and J. Wang, Melt Rheology and its Applications in the Plastics Industry, 2nd ed. (Springer Springer Dordrecht Heidelberg New York London, 2013). PMCid:PMC4060279
View ArticleL. M. Landoll, J. Polym. Sci. Part A: Polym. Chem. 20, 443-455 (1982).
View ArticleM. Han, P. Wang, X. Xu and G. Zhou, Food Res. Int. 62, 1175-1182 (2014).
View ArticleH. Yang, M. Han, Y. Bai, Y. Han, X. Xu and G. Zhou, Meat Sci. 102, 69-78 (2015). PMid:25553411
View Article PubMed/NCBIA. Lomakin, D. S. Chung, G. B. Benedek, D. A. Kirschner and D. B. Teplow, Proc. Natl. Acad. Sci. U. S. A. 93 (3), 1125-1129 (1996). PMid:8577726
View Article PubMed/NCBIJ. Yongsawatdigul and S. Sinsuwan, Food Hydrocolloids 21, 359-367 (2007).
View ArticleS. Shimizu, Proc. Natl. Acad. Sci. U. S. A. 101, 1195-1199 (2004). PMid:14732698 PMCid:PMC337029
View Article PubMed/NCBIW. Pan, University of Houston, 2006.
R. Mezzenga, P. Schurtenberger, A. Burbidge and M. Michel, Nat. Mater. 4, 729-740 (2005). PMid:16195765
View Article PubMed/NCBID. Lucent, V. Vishal and V. S. Pande, Proc. Natl. Acad. Sci. U. S. A. 104, 10430-10434 (2007). PMid:17563390 PMCid:PMC1965530
View Article PubMed/NCBI