Khaled A. Selim
e-mail: kas00@fayoum.edu.eg
© 2019 Sift Desk Journals. All Rights Reserved
VOLUME: 4 ISSUE: 7
Page No: 860-876
Khaled A. Selim
e-mail: kas00@fayoum.edu.eg
Khaled A. Selim*, Osama H. Ismaael and Mohamed S. Abdel Bary
Food science and technology dept., Faculty of agriculture, Fayoum University, Fayoum, Egypt
Jes%c3%bas Salafranca(fjsl@unizar.es)
Silvia C S R de Moura(smoura@ital.sp.gov.br)
Loredana Dumitra%c8%99cu(ldumitrascu@ugal.ro)
Khaled Abdel-Hamid Selim, Influence of incorporation of orange juice by-product on the quality properties of sponge cake and low-fat beef burger(2019)Journal of Food Science & Technology 4(7)p:860-876
The purpose of this study was to evaluate the properties of the orange juice by-product as potential ingredient and to investigate the effect of incorporation of this by-product as wheat flour replacer in cake and fat replacer in low-fat burger on physicochemical and sensory characteristics of sponge cake and low fat beef burger. The analysis comprised: chemical composition, total phenolic and flavonoids content and antioxidant activity of the dried orange juice by-product.
The results showed that dried orange by-product contents 8.23% ash, 1.02% fat, 8.12% protein, 78.19% total carbohydrate and 63.05% total dietary fiber. The results showed that the extract yield was 29.89 and 28. 25% and total polyphenolic content recorded 22.615 and 21.045mg/g dried extract while the total flavonoids content recorded5.166 and 4.937mg/g dry extract for methanol: water and ethanol: water extracts respectively.
The antioxidant activity of the methanolic and ethanolic extracts of orange juice by-product was assessed using stable DPPH radical. Both orange juice by-product extracts exhibited very strong antioxidant activity with EC50 of 11.67 and 13.21µg extract/ µg DPPH, respectively.
Effects of replacement of cake wheat flour with different levels of dried orange by-products (5%, 7.5% and 10%) were investigated regarding sensory aspects. The sensory profile of cake with OJBP showed that addition 5% orange juice by-product as wheat flour replacer in the cake formula improved the appearance, color, taste, odor and overall acceptability of the cakes comparing to the control sample. When the replacement level was increased to 7.5 and 10% all the sensory properties showed significant decrease comparing with the control sample.
Orange juice by-product was evaluated as a fat replacer on physicochemical and sensory characteristics of low-fat burger. The results showed that OJBP at all replacement levels reduced the cooking loss, shrinkage % and prolonged the storage stability of the produced burger compared to the control samples. The replacement of fat by OJBP in burger at low level (2.5%) led to improvement of all the sensory parameters. Whoever, at the highest level (7.5%) partially impairs the acceptance of the product compared to the control samples.
Keywords: Orange juice by-product, bioactive compounds, sponge cake, low-fat burger
During fruits and vegetables processing, a significant amount by-product is traditionally discarded. At the same time, huge quantities of food processing by- products are generated and not utilized, creating considerable environmental pollution if not properly disposed. If these by-products could be used as a dietary fiber source, it would reduce pollution and add value (Sharma et al., 2016). These by-products consist of the core, peel, pips and kernel of the fruits/vegetables being processed. At present, foods processing by products have become an important sanitary problem material to be studied. Such efforts have been made for converting these refused materials into valuable products (Raninen et al., 2011). Many studies have demonstrated that fruit and vegetables contain large amounts of dietary fiber (DF), which benefits the physiological activities of humans by decreasing cholesterol levels, reducing hyperlipidemia and hypertension, and maintaining gastrointestinal health (Huang and Ma, 2016). Dietary fiber can include soluble dietary fiber (SDF) and insoluble dietary fiber (IDF). SDF refers to fibers that cannot be digested or absorbed by human bodies but are partly soluble in water, such as pectin, gum Arabic, guar gum, and glucan, and also include some biological polysaccharides and synthetic polysaccharides. IDF is a fiber that cannot be digested or absorbed by human bodies and is insoluble in water. IDF includes some components of the structure of cell walls, such as cellulose, hemicellulose, and lignin. (Macagnan et al., 2016). The insoluble dietary fiber acts as a bulking agent, normalizing intestinal motility, preventing constipation while soluble fiber is associated to decreasing the intestinal absorption of cholesterol and glucose (Rodríguez et al., 2006). However, the SDF/IDF ratio is important for both, dietary and functional properties. The suitable fiber sources for use in food should have an SDF/IDF ratio close to 1:2 (Jaime at al., 2002). Due to all of these benefits of dietary fiber intake, a tendency in the development of products enriched with fiber or with specific fiber claims has already been observed for some time. It is important to note that the composition of dietary fiber cannot be completely deter-mined, and the concept of dietary fiber will likely continue to evolve (Rainakari et al., 2016). This material is not able to be decomposed in the human gut and affects the moisture absorption in the digestive system. It can increase the volume of food inside the intestines and stomach, increase satiety, and facilitate weight loss (Manzoni, et al., 2008). It can promote gastrointestinal peristalsis to alleviate constipation (Tse et al., 2000) and absorb the harmful materials in the gut, promoting their removal (Borycka et al., 2010). Additionally, dietary fiber can improve the intestinal flora and provide energy and nutrition for probiotics proliferation (Wu et al., 2011). Recent studies have shown that dietary fiber helps to reduce postprandial blood glucose, insulin, and triglyceride concentrations (Ma and Mu, 2016).
Epidemiological studies have reported that the consumption of foods that are rich in dietary fiber plays a significant role in the reduction and treatment of cardiovascular diseases, various types of cancer, gastrointestinal disorders, type 2 diabetes, and obesity and possibly improve body function regulation (Figuerola et al., 2005). Many foods with added dietary fiber have been introduced. At present, dietary fiber application research mainly includes addition of dietary fiber to flour products, meat products, and dairy products or use as additives (Zong et al., 2006). Compared with non-modified food, this kind of improved dietary product has attracted consumer interest and is sold for higher prices. The dietary fiber is often added in our products, such as whole grain bread, noodles, biscuits and steamed bread. Fiber addition in meat products is becoming more common, and dietary fiber addition may effectively increase acceptability by giving meat products higher quality, improving the processing characteristics of meat products, improving the yield of meat products, and lengthening the shelf time (Galanakis et al., 20110).
Among all the types of fruit trees, orange is one of the most well-known and widely studied worldwide. Orange by-product contains many nutrients like essential oil, protein, fiber, vitamin C etc. During the production of orange juice, only 50% of the gross weight of the fruit is converted to juice; the rest is considered to be the byproducts (Fernandez-Lopez et al., 2009). Although the juice is the main product derived from orange, many thousands of tons of pomace are produced as by-product includes the rind, albedo, sacs and seeds. It has distinctive characteristics that can be applied in the food industry (Baptistella et al., 2009). This pomace may contain valuable substances, such as pigments, sugars, organic acids, flavours and bioactive compounds, such as antioxidants, enzymes, antimicrobial compounds and fibers, therefore they could be applied in food production generating products with higher added value (Martínez et al., 2012).
Accordingly, the purpose of the present study was to determine the chemical composition of orange juice processing be-product, total phenolic and flavonoids content and investigate the antioxidant activity of its methanolic extract using DPPH procedure, utilization of these by-products in powder form in some food products as (sponge cake, and low fat beef brogue as a sources of dietary fiber and natural antioxidant compounds) and to evaluate the quality characteristics of the produced food products.
2.1. Material Procurement:
Balady orange fruits (Citrus sinensis) were purchased from local market in Cairo governorate, Egypt. Refined wheat flour, sugar, eggs and baking powder, meat, fat, and spices were purchased from local market, Cairo, Egypt. All solvents and chemicals used were purchased from El- Goumhouria Co. 23, Cairo, Egypt,
2.2. Preparation of orange juice by- products:
The fruits were washed thoroughly with water to remove dirt and adhering extraneous materials, peeled manually with a sharp kitchen knife. Kitchen juice extractor was used to extract the juice and the seeds removed. The collected by-products (peels and pulp remaining after juicing) were boiled for one minute to remove undesirable compounds associated with albedo (essentials oils) and decrease microbial load then dried at temperatures below 50ºC to avoid changes in the functional properties and in the content of polyphenols, tannins, and proteins in an electric oven drier according to Kethireddipalli et al. (2002). The obtained dry materials were then finely milled using the laboratory hammer mill and sieved through a 60μm sieve size into fine powder and packaged in polythene bags protected from light and moisture and stored at refrigerator temperature until further analyzed.
2.3. Analytical Methods.
2.3.1. Moisture, fat, crud fiber, ash, crude protein, and carbohydrates content were determined according to A.O.A.C. (2005). Soluble pectin content was determined according to the method described by (Lees, 1975)
2.3.2. Total phenolic compounds:
Samples (10g) were extracted by 50ml mixture two different extraction solutions {ethanol and water (80:20 V/V) and ethanol and water (80:20)} for 24 h. in dark at 4°C. The supernatants were collected, and the residuals were extracted once more with another 40 ml of the extraction solutions for further 24 hour at 4 °C in the dark. The two supernatants were mixed, and volume was adjusted to 100ml. Total phenolic compounds were determined using modified folin ciocalteu reagent according to Asami et al. (2003). TPC was calculated from the calibration splot and expressed as mg gallic acid equivalents (mg GAE) of phenol/g dried extract. The calibration equation for gallic acid was y = 0.0248x + 0.237, R2 = 0.997, where y is absorbance and x is concentration of gallic acid in µg/mL. All measures were performed in triplicate
2.3.3. Total flavonoids contents;
Total Flavonoids content of the extracts was determined by the method of Ordon et al. (2007). The intensity of pink colour was measured at 510 nm and the calibration equation for 9+) catechin was y = 0.0035x + 0.0258, R² = 0.9929. The results were expressed as mg of (+)-catechin equivalents (CEs) per g of dried extract
2.3.4. Determination of radical scavenging activity:
The free radical scavenging activity of the methanolic and ethanolic extracts was analyzed by using the 1, 1-dipheny-2-picrylhydrazyl (DPPH) assay according to Abba Pacôme et al., (2014). Different concentrations of the orang by-product extracts were pleased in 10ml tube and 2 ml of 0.1 mM of DPPH solution were added to each tube. The mixture was left to stand at room temperature for 30 min in the dark before absorbance measurement at 515 nm. Control sample was prepared, which contained the same volume without any extract. The scavenging or inhibition percentage was calculated according to the following equation:
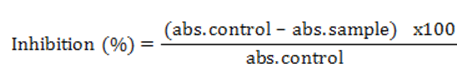
Where: abs. is absorbance at 515nm
Measurement was performed in triplicate. Inhibition was expressed as a percentage, and the effective concentration 50 % (EC50) was obtained from the inhibition curve.
2.4. Sponge Cake Manufacture
Four cake samples were prepared, control and three different treatments with different refined wheat flour replacement ratio (5, 7.5 and 10% dried orange juice by-products). The ingredients were weighed and the liquid ingredients were blended in a mixer at low speed for 5 minutes, sugar was added to the bowl and mixed on the low speed for one minute, then dry ingredients (flour, baking powder, and orange by-products powder) were gradually added to the bowl and mixed for one minute at low speed. The produced mixture was placed in aluminum pans (8.5 and 16.5 cm) and baked in electric oven at 180±5°C for 20 minutes. After baking, cakes were removed from pans, cooled for 30 minutes at ambient temperature (25± 5°C) and then packed in polypropylene bags.
2.4.1. Rheological properties of cake dough
The effect of powdered OJBP on dough properties during mixing was determined by the Brabender Farinograph, following the AACC Approved methods (54 – 21, 1983). The parameters determined were: percentage water absorption (% WA) of flour to form standard dough with consistency 500 Brabender Unit (BU), dough development time (DDT) that is the time taken to form the dough, dough stability (DS) and fall-off time (FOT) which indicate the strength of dough. The rheological properties of dough was determined by the Brabender Extensigraph, following the AACC Approved methods (54 – 10, 1983). The main parameters assessed were resistance (R) of dough to stretching, extensibility (E) which is the extent to which the dough will stretch before tearing, and the Resistance to Extension (R/E) ratio used to evaluate the overall strength of dough
2.4.2. Physical characteristics of sponge cake
The physical characteristics of the sponge cake, including specific gravity, baking loss rate, volume, weight, Specific volume, height and dough yield, were measured in quadruplicate for the same sponge cake dough as described by (Sahin and Sumnu, 2006).
The weight (g) for cake was determined individually within one hour after baking the average was recorded. The volume (cm3) of different types of produced cakes was determined by rape seeds displacement method according to (AACC, 2000).
Specific volume was calculated as the ratio of the cake volume to weight of cake as follows:
Specific volume (cm3/g) = volume (cm3) /weight of cake (g).
Dough yield (g/100g) = Weight of cake/Weight of dough × 100
2.4.3. Sensory evaluation of cake
After baking cakes were removed from pans, cooled for 30 minutes at ambient temperature (25± 5°C), then presented on plastic plates coded with four digits numbers and served randomly. Water was used for rinsing the mouth between each sample. The panel evaluated the cake samples for shape, crust appearance, crust colour, crumb colour, texture, taste, odor and overall acceptability.
.
2.5. Low-fat burger preparation:
A simple traditional formulation was used to obtain a beef burger as illustrated in Table (1) according to Aleson-Carbonell et al. (2005). The OJBP was added as fat replacer at three levels (2%, 5%, and 7.5%).Control sample was prepared without adding any fat replacers. Each treatment mixed separately for 5 min at medium speed, using a Moulinettemachaine (Model 320, cod 25, France) to obtain homogeneous mixture. This mixture was shaped using a commercial burger maker (9 cm internal diameter) to obtain patties of approximately 70 g and 1 cm thickness. The produced burger samples were packaged in aplastic films and stored at -18°C for farther analysis.
Table (1): Formula for low fat beef burger blended with different levels of dried orange juice by-product (2.5%, 5% and 7.5 %) as fat replacer.
|
Replacement Levels % |
Beef Meat |
Orang by-product |
Fat |
Water added |
Onion and spices |
Salt |
|
Control |
70 |
0 |
20 |
8 |
0.5 |
1.5 |
|
T1 |
70 |
2.5 |
17.5 |
8 |
0.5 |
1.5 |
|
T2 |
70 |
5 |
15 |
8 |
0.5 |
1.5 |
|
T3 |
70 |
7.5 |
12.5 |
8 |
0.5 |
1.5 |
T1= treatment with 2.5 OJBP and 17.5 fat, T2= treatment with 5% OJBP and 15% fat and T3= treatment with7.5% OJBP and 12.5 fat.
2.5.1. Cooking characteristics:
The burger samples were cooked at 220°C in electric oven, then cooled to 21°C for 1 h and blotted before weighing. Samples were weighted before and after cooking to estimate the amount of fat and moisture retained in the samples, the following calculations were performed according to Aleson-Carbonell et al. (2005).
Cooking yield % = 100 X [Cooked weight (g)] / Raw weight (g)
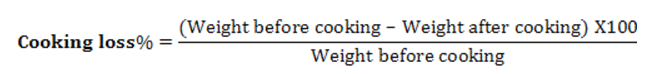
2.5.2. Cooking loss %:
Cooking loss values were determined by calculated the weight difference of three burgers before and after cooking using following equation according to Crehan et al. (2000).
2.5.3. Shrinkage measuring %:
Samples areas were measured before cooking (A1) and after cooking (A2) respectively, and shrinkage was calculated according to the method of El-Akary (1986) as follows;

2.5.4. Storage stability of beef burger
Fifty grams of each prepared sample were extracted three times with 150 ml chloroform using a Stomacher lab- blender 400, the chloroform extract was filtered through whatman No. 1 filter paper over anhydrous sodium sulphate. From this extract ten mls. were pipetted into a weighted dried dish and the solvent was removed in an oven at 70°C, then the residue was weighted and the quantity of fat in 10 ml extract were calculated.
2.5.4.1. Determination of Free fatty acids:
The free fatty acids (FFA) were determined and calculated (as % oleic acid) according to OACC (2005). An aliquot of 25 ml of chloroform extract were pipetted into a conical flask and mixed with 25 ml of neutral ethyl alcohol (95%).The mixture was titrated with 0.1 N sodium hydroxide using phenol phethalein as an indicator. The percentage of free fatty acids was calculated as oleic acid from the following equation:
%Free Fatty Acid (FFA) =V×N×2.82/W
Where: V= volume of NaOH
N=normality of NaOH, W= weight of fat in 25 ml chloroform extract.
2.5.4.2. Determination of Peroxide value:
Peroxide value was determined and calculated as milliequivelant peroxide in kilogram fat according to OACC (2005).
The peroxide value (milliequivelant P/kg) = V×N× 1000/W
Where: V= volume of sodium thiosulphate, N=normality of sodium thiosulphate
W= weight of fat in 25 ml extract
2.5.5. Sensory evaluation of low fat burger with different levels of OJBP.
All burger samples were cooked at the same time. One burger was cut into 8 equalized parts. All samples were served simultaneously to each panelist after reaching room temperature. The panel evaluated the cooked burger samples for colour, odour, texture, juiciness, taste, hardness and overall acceptability.
2.6. Statistical analysis
The experimental data were conducted in triplicate and the differences between treatment means were analyzed statistically using Duncan’s procedure at p < 0.05 using SPSS statistics 19. The expressed values are means ± standard deviation of the measurements.
3.1. Proximate composition of orange juice by-products.
Orange juice by-products (peels and pulp) were analyzed for their chemical composition and the data recorded are presented in the Table (2). Results showed that the moisture content of dried orange juice by-products was 4.25%.
Table (2): Proximate chemical composition of dried orange juice by-products
|
% |
Components |
|
4.25 |
Moisture (%) |
|
8.23 |
Ash (%) |
|
1.02 |
Lipids (%) |
|
8.12 |
protein |
|
78.19 |
Total carbohydrate |
|
7.42 |
Pectin |
|
63.05 |
Crud Fiber |
Results in the same table indicated that dried orange by-products contents 8.23% ash, 1.02% fat, 8.12% protein, 78.19% carbohydrate and 63.05% crud fiber. It could be seen that the dried orange by-products contain high level of crud fiber and low level of fats. our results are in agreement with those reported by (Wang et. al., 2018) who found that orange waste contains 4.7% moisture, 7.39% ash, 1.85% fat, 7.0% pectin. The results also in agreement with those by Sharoba et al. (2013) for balady orange by-products and Huang and Ma (2016) for orange pomace. Aastha and Dorcus (2012) pointed that the orange peel powder contained 3.5% moisture, 2.67% protein, 6.69% ash, 2% fat, 62.35% fiber. On the other hand, O’Shea et al. (2015) reported a lower result for TDF 40.47% and ash 3.68% and similar results for fat 1.08% for the chemical composition of orange pomace. The compositional differences are most likely attributed to different growing conditions and maturity of the fruit (Sturm et al., 2003).
3.2. Yield %, Total polyphenolic and flavonoids content of orange juice by-products.
The yield %, the total polyphenlic and total flavonoids content of the dried orange juice by-products were determined using methanol: water (80: 20) and ethanol: water (80:20) as extraction solvents and the data collected are presented in table (3). The results showed that the extract yield was 29.89% and 28.25% for Methanol: water and ethanol: water respectively. Total polyphenolic content recorded 21.615 and 22.165 mg/g dried extract while the total flavonoids content recorded 4.937 and 5.166mg/g dry extract for Methanol: water and ethanol: water respectively. These results are similar to that reported by Hegazy and Ibrahium (2012) how found that the methanolic extract of orange peel showed the highest (p < 0.05) values for yield (%),total polyphenolic content and, total falvonoids content and Espinosa-Pardo et al. (2017) investigated extraction of phenolic compounds from dry and fermented orange pomace sing supercritical CO2 and co-solvents and found that the extraction yield was ranged from 2.01 to 2.62%, and total polyphenolic content was ranged from 18 to 21.8 mg GAE/g dry extract) .
Table (3). Effect of extraction solvent on yield %, total polyphenolic and total flavonoids contents of orange juice by products
|
Extraction solvent |
% Yield of extract |
TPC (mg/g extract) |
TFC (mg/g extract) |
EC50 (µg/ µg) |
Antiradical efficiency |
|
Methanol :water ( 80: 20) |
29.890 |
22.165 |
5.156 |
11.67 |
0.0868 |
|
Ethanol : water (80: 20) |
28.25 |
21.615 |
4.937 |
13.21 |
0.0757 |
The use of natural and low-cost antioxidants to replace synthetic butylated hydroxyanisole (BHA) and butylated hydroxytoluene (BHT) could be of interest due to the carcinogenic and toxic effects of the later (Hocman, 1988).
The antioxidant activity of different concentrations of the methanolic and ethanolic extracts of orange juice by-product was assessed using stable DPPH radical and the obtained data are presented in Table (4). The results showed that there was correlation between the scavenging activity and the extract concentration. The inhibition ratio was 39.69% and 34.81 at concentration of 6.92 and 6.54µg extract/µg DPPH for methanoilc and ethanolic extract respectively. While it increased to 89.06 and% at concentration of 55.35µg methanolic extract/µg DPPH. The IC50 values for the methnolic and ethanoilc extracts recorded 11.67 and 13.21µg extract/ µg DPPH. These results are in agreement with those found by (Seleim, A. M., 2008, Ghasemi, et al., (2009) and Hegazy and Ibrahium, 2012).
Table:(4). Antioxidant activity of different concentration of orange by-product methanolic and ethanolic extracts
|
Methanolic extract |
Ethanolic extract |
||
|
Concentration µg/µg DPPH |
Inhibition ratio % |
Concentration µg/µg DPPH |
Inhibition ratio % |
|
3.58 |
32.51 |
3.92 |
31.87 |
|
6.92 |
39.69 |
6.54 |
34.81 |
|
12.85 |
55.05 |
13.92 |
52.67 |
|
20.77 |
69.53 |
21.82 |
64.58 |
|
27.69 |
77.19 |
28.05 |
73.64 |
|
34.62 |
83.53 |
35.27 |
80.27 |
|
41.54 |
86.33 |
41.86 |
83.87 |
|
48.47 |
87.97 |
48.53 |
85.43 |
|
55.35 |
89.06 |
56.28 |
85.58 |
Antioxidant activity of methanolic orange peels extract was assessed by measuring free fatty acid content, peroxide value and iodine value during 6 months storage of sunflower oil containing 2000 ppm orange peel extract (Seleim, 2008) who reported that the treated samples showed lower FFAs content (0.968%) and PV (4.71 meq/kg-1) and higher iodine value (98.0) compared to control sample. Likewise, citrus peel extract as a natural source of antioxidant was evaluated during 6 months storage of refined corn oil at 25 and 45°C. (Zia-ur-Rehman, 2006). He reported that after 6 months of storage at 45 °C, corn oil containing 1600 and 2000 ppm citrus peel extract, showed lower FFA contents (1.5% and 1.0%), and POVs (8.38and 7.0 meq kg−1) and higher iodine values (81, 89) than the control sample (FFA 17.0% POV 101 meq kg−1 IV 47).
3.4. Rheological parameters of wheat flour (72% extraction) dough with 5% replacement by orange juice by- products
3.4.1. Farinograph characteristics:
The effect of replacing wheat flour with 5 % of dried orange juice by-products on mixing dough properties is presented in Table (5). Data shows the effect of replacement 5% of wheat flour (72 %) with orange juice by-products on the farinograph parameters, i.e. water absorption, arrival time, dough development time, dough stability and dough weakening. The data showed that percentage of water necessary to be added to flour in order to form dough of 500 Barabender Units (B. U.) recorded as water absorption percentage was changed among the different samples. The results showed that dough made from wheat flour 72% extraction recorded water absorption of 61.2%. While replacement 5% of wheat flour by orange juice by- products flour increases the water absorption of the dough. It was increased from 61.2% to 64.20 % for wheat flour and wheat flour with 5% orange juice by- products replacement, respectively.
Table (5). Effect of wheat flour replacement with 5% orange juice by-products on the rheological parameters of cake dough.
|
|
Farinogragh parameters |
|||||||
|
Parameters Treatment |
Water absorption % |
Arrival time (min) |
Developing time (min) |
Stability time (min) |
Weakening value (BU) |
|||
|
Control |
61.2 |
1.5 |
1.0 |
25.0 |
90 |
|||
|
5% |
64.25 |
2.5 |
2.0 |
8.5 |
70 |
|||
|
Extensograph parameters |
||||||||
|
Parameters Treatment |
Extensibility (mm) |
Resistance to extension (B.U) |
proportional number |
Energy (cm2) |
||||
|
Control |
170 |
325 |
1.91 |
101 |
||||
|
5% |
110 |
810 |
7.3 |
88 |
||||
The increased water absorption was attributed to the increased fiber content associated with orange juice by-product flour. The greater number of hydroxyl groups that exist in the fiber structure allows for more water interaction through hydrogen bonding. These results are agreed with Ghanbari and Farmani (2013). Garden (1993) reported that incorporating ground orange juice by-product into wheat flour significantly increased water absorption of dough.
Regarding to the dough arrival time, the results showed that there was a significant difference (P<0.05) among the samples. The dough arrival time of the wheat flour 72% recorded 1.5 min while the sample with 5% OJBP substitution level recorded 2.5 min. The results also indicated that replacement of wheat flour with orange juice by-product lead to increase in dough arrival time. The longer dough arrival time could result from the dilution of gluten and the difficulty of mixing fiber and wheat flour homogeneously (Koca and Anil, 2007). The same trend was observed for development time. Pourabedin et al. (2017) reported that dough development time significantly increased in the samples containing orange juice by-product flour compared to the control sample (p < 0.05). The longer development time could be attributed of gluten dilution and difficult OJBP fiber and wheat flour mixing process.
The results showed that the dough stability value of 5% orange juice by-product dough's was higher than that of wheat flour without orange juice by-product. Our results are agreed with that reported by Sharoba et al. (2013) who reported that the replacement of wheat flour by orange by-product increased the dough stability. Likewise, Doweidar (2001) found that the addition of dietary fiber source led to increase water absorption and stability. Degree of weakening decreased due to replacement of wheat flour with orange juice by-product; this might be due to increasing of fibrous materials, which contribute gluten net development.
3.4.2. Extensograph characteristics
The effect of replacement of wheat flour 72% by orange juice by-product at 5% on the Extensograph measurements throughout 135 min resting time was measured and the obtained results are listed Table (5). Resistance to extension of dough samples was measured as the force required pulling the dough strip apart. Resistance to extension of dough samples are presented in Table (5). According to the results, resistance to extension of control sample was seen to be less than that of wheat flour 72% extraction with 5% OJBP replacement. The control sample recorded 325 B.U. while the sample with 5% orange juice by-product recorded 810 B.U.
These results were confirmed by Sharoba et al. (2013). Such increment in the resistance to extension could be due to the interaction of orange juice by-product fibers and gluten of wheat flour. Negative effect of adding insoluble fiber on the formation of gluten network due to dilution of gluten has been reported in previous studies (Wang et al., 2002).
The extensibility of wheat flour + orange juice by-product dough remained significantly lower than that of wheat flour 72% extraction dough which recorded extensibility value 170 mm. The energy values of dough made from wheat flour (72% extraction) and the wheat flour with orange juice by-product were 101 and 88 for wheat flour (72%), wheat flour (72%) + 5% orange juice by-product, receptively. Maximum resistance and energy under Extensograph can be used as indicators of dough strength (Preston and Hoseney, 1991). The present results indicate that orange juice by-product decreases dough strength. These results are agreed with that reported by (Gilbert, 2002).
3.5. Effect of orange juice by-product on physical characteristics of sponge cake
The effects of replacement of wheat flour with deferent substitution levels of ground orange juice by-product on the physical characteristics of sponge cake were evaluated and the results are shown in Table (6). Cake volume is an important quality feature of cake. Many factors can affect the volume of cake, such as viscosity, amylose and amylopectin content, protein aggregation once heated and surface-active components (Alvarez-Jubete et al., 2010). Replacing fine wheat flour by 10% proportion of orange juice by-product in cake revealed a significant reduction of volume index from 130 to 55cm3. These results are agreement with that reported by (Lebesi and Tzia, 2011).
The results of the specific volume response propose that addition of the orange juice by-products (OJBP) had significant effect on specific volume (p < 0.0001). It was observed that addition of orange juice by-product powder caused significant decreasing of specific volume of samples (from 1.18 for the control sample to 0.55 cm3/100g-1 for the sample with 10% orange juice by-product substitution level). This effect is due to the dilution of gluten, and also could result from the interaction between gluten and fiber material (Chen et al., 1988).
Sabanis et al. (2009) documented similar results (i.e. a lowering of volume) with the addition of maize fiber to a gluten-free formulation. These authors suggest another potential reason for the lower loaf volumes may be due to the extra water available in their gluten-free formulation. This additional water creates a low dough consistency; consequently creating unstable air vacuoles within the crumb structure which can become weak and uneven, developing large holes in the crumb or it may even cause the structure to collapse. A significant increase in sponge cake specific gravity and dough yield were noted with the increase in orange juice by-product level (P < 0.05). The specific gravity was found to be increase with increasing the substitution level. It was 9.21 for the control sample and increased for 12.61, 19.65 and 2024 for 5, 7.5 and 10% replacement. These finding are supported by those of (kim et al., 2012).
Table (6). Effect of different substitution levels of wheat flour with orange juice by-product on the physical characteristics of sponge cake.
|
Sample |
Volume cm3 |
cake weight g. |
Specific volume |
Dough yield g/100 g |
Baking loss % |
Highest cm |
|
Cont. |
130±1.52a |
109.88±1.20c |
1.18± 0.01a |
91.57±0.55c |
8.43±0.12a |
8.5±0.20a |
|
5% |
80±2.45b |
110.56±1.55c |
0.75±0.01ab |
92.13±0.86bc |
7.87±0.06ab |
7.5±0.15ab |
|
7.5% |
60±2.60c |
112.29±.85b |
0.59±0.02b |
93.58±0.58b |
6.42±0.03bc |
6.5±0.25bc |
|
10% |
55±1.55d |
115.5±1.80a |
0.55±0.01b |
95.25±0.75a |
4.75±0.08c |
6.2±0.18c |
Values refer to the mean ± standard error of the results.
a,b Different letters in the same column indicate significant differences (P < .05).
Thus, the increase in specific gravity would be due to the TDF of the orange juice by-products. Specific gravity (i.e., foam density) is commonly used to evaluate whipping properties. Many air cells are incorporated into cake batter when the specific gravity is low whereas air is decreased in the cake batter when the specific gravity is high, and therefore, the volume of bakery products is decreased (Park et al., 2009). The more air incorporated during whipping, the lower the specific gravity (foam density); the more air present in the foam, the higher the whip ability. However, in a study by Lu et al. (2010), as cake batter viscosity increased, volume tended to decrease. This relationship may be due to the increased replacement of flour resulting in excessively. Regarding to the baking loss rate, the results showed that replacement of wheat flour with orange juice by-products reduced baking loss rate in sponge cake. In the baking process, gas is produced and vapor pressure is increased because liquids expand when heat permeates the cake batter. If gas escapes, damage occurs; this process is called baking loss (kim et al., 2012). in the present study, water capacity is believed that have increased as a result of the dietary fiber in the orange juice by-product powder, and baking loss is believed that have decreased as the addition of orange juice by-product increased. This result is in agreement with that reported by (Dhen et. al., 2016) who attributed the reduction of weight loss the high water retention capacity of the fiber content which does not allow water evaporation during the baking process.
The results also showed the volume and the high of the produced cake were decreased with increasing substitution level. These results are in agreement with that obtained by (Sudha et al., 2007a) how reported that addition of 0 to 30% apple pomace to the sponge cake reduced cake volume and increased cake density possibly due to the high ability of the apple pomace to preserve water.
3.6. Sensory evaluation of sponge cake with orange juice by-products
Effects of replacement of wheat flour with different levels of orange juice by-products powder (5%, 7.5% and 10%) on the sensory proprieties of sponge cake were investigated. The produced cake samples were evaluated for their shape, crust appearance, crust color, crumb color, texture, taste, odor and overall acceptability. Results were statistically analyzed, and data are presented in Figure (1).
Regarding to the shape, results showed that there was no significant difference between the control sample and the sample with 5% orange juice by-product replacement level. When the replacement level was increased to 7.5 and 10% the shape value showed a significant decrease comparing with the control sample. The results indicated that replacement 5% of wheat flour with OJBP improved the crust and crumb color of the cake and recorded higher scores than the control treatment. The cake-samples with OJBP had a crust and crumb color with more pronounced light-yellow color due to the presence of the color components in orange juice by-product. The scores given to crust and crumb color decreased with increase in OJBP level from 5% to 7.5%, all the scores were in the range of good to excellent. However, a remarkable decrease in the cake color was observed when 10% orange juice by-product was added. Increasing addition level OJBP to 10% led to crust and crumb of the cakes turn into more yellow and was not perceived by the sensory panelists as unpleasant.
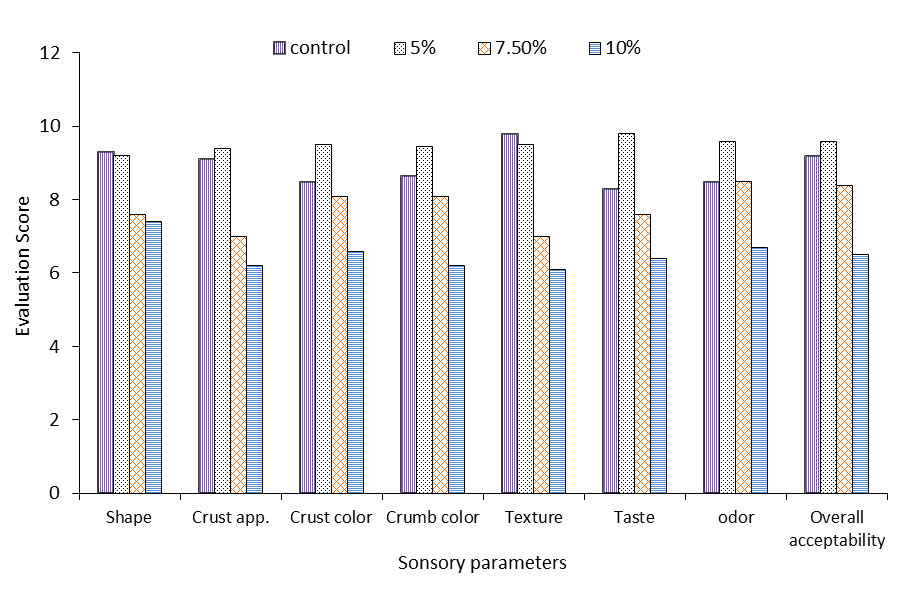
Figure (1). Effect of wheat flour replacement with different levels of orange juice by-product on sensory parameters of sponge cake
These results are in agreement with (Majzoobi et al., 2015) who reported that increasing the level of oat fiber resulted in the increase in batter density and consistency. In addition, they also found that cakes containing no more than 20% oat fiber had acceptable sensory characteristics. Our findings of sensory attributes of cake are in accordance with those of (Qureshi et al., 2017) who reported sensory attributes of muffins enriched with date fruit fiber. According to them enrichment of fiber in muffin is acceptable up to a limit after that fiber enriched product got lower marks by panelist. But average results showed that all the treatments had good scores, between 6 and 8 on a 9-point scale.
Results in Figure (1) proved that replacement 5% of wheat flour with orange juice by-product did not affect the texture of the produced cake. It is also proved that increasing the addition level to 7.5 and 10% led to a significant difference in the texture compared to the control sample.
Regarding to the taste and odor of the cake samples with different wheat flour replacement levels, the results cited in Figure (1) showed that the samples with 5% orange juice by-product resulted in cakes with higher approval by the panelist. While there was no significant difference between the control cake and the samples with 7.5 % orange juice by-product regarding to the odor of the products. On the other hand, increasing the level of replacement to 10% lead to significant difference compared with the control. It can be concluded that the inclusion of orange juice by-product up to 5% resulted in cakes with higher approval by the panelists. Nevertheless, the overall acceptability of the cakes containing 10% orange juice by-product was the lowest compared to the other samples. The acceptability decrease may be related to the hardness of the texture and darkness of the color.
3.7. Effect of orange by-product as fat replacer on quality properties of low-fat beef burger:
Strategies to reduce the fat content in meat products are based on using lean meat cuts that can increase cost and/or replacing the fat with dietary fiber plus water, bringing a functional appeal and reducing the impact on sensory properties (Wang et al., 2018).
3.7.1. Effect of orange by-product on physical properties of burgers.
Table (7) presents the physical properties of burger samples made with different substitution levels of fat by orange by-products. According to these results it was possible to conform that cooking yield significantly improved by fiber levels in beef burger. This improvement could be attributed to increase in moisture binding by the added orange juice by-product which had high fiber content. High fat beef burger (control) 20% fat had highest cooking loss (24.91.7%) whereas burgers with orange juice by-product at 2.5, 5 and 7.5 % had significantly lower cooking loss (16.05, 11.60 and 10.49 %) respectively. The high cooking loss in control may attribute to excessive fat separation and water released during cooking. Dietary fibers decreased cooking loss because of their high ability to keep moisture and fat in the matrix. These results are agreed with that reported by (Selani et al., 2016). Significantly lower cooking loss or higher cooking yield of burgers with fiber was also observed lemon albedo (Aleson-Carbonell et al., 2005). Yılmaz (2005) observed significant decline in the weight loss of meat balls having 5, 10, 15, and 20% of cereal bran. Regarding to the shrinkage percent of the produced burger, the data showed that shrinkage of burger as a result of frying is decreased with increasing fiber substitution level; since the lowest shrinkage percent was observed for the samples contain 7.5% orange juice by-product. These results are in agreement with those of Kim et al. (2015). The reduction on the shrinkage percent was attributed to formation of hydrogen bonding between water molecules and fiber, which reduce the displacement of water by oil (Fiszman and Salvador, 2003).
Ammar (2017) reported that the addition of fiber sources increased frying yield of chicken meat nuggets especially with the higher addition level (10 %) orange albedo. He also found that, the addition of fiber sources decreased chicken meat nuggets shrinkage, since chicken meat nuggets formulated with 10 % orange albedo powder exhibited significantly lower shrinkage values as compared to control.
Table (7): Effect of fat replacement with different level of orange juice by product on physical properties of low-fat beef burger.
|
Shrinkage% |
cooking loose% |
Weight after cooking |
Weight before cooking |
Treatments |
|
24.39±1.52a |
24.91±2.31a |
53.18±2.81c |
70.83±3.15a |
Control. |
|
22.98±1.08b |
16.05±2.05b |
60.8±3.1b |
72.43±2.82a |
T1 |
|
18.73±2.01c |
11.60±2.17c |
62.78±3.58ab |
71.02±3.54a |
T2 |
|
12.57±1.54d |
10.49±1.82c |
65.15±2.94a |
72.79±2.31a |
T3 |
T1= samples containing 17.5% fat and 2.5% OJBP, T2= samples containing 15% fat and 5% OJBP and T3= samples containing 12.5% fat and 7.5% OJBP, Values refer to the mean ± standard error of the results.
a,bDifferent letters in the same column indicate significant differences (P < .05).
Loss of weight occurred during cooking mainly due to moisture evaporation and drip of melted fat (Alakali et al., 2010). The sample with orange by-product 7.5% and 12.5 fat has the lowest weight loss among samples. It may be because of less fluid was lost during cooking due to its lower fat content. These results are in agreement with that obtained by (Gujral et al., 2009) who found that addition of fiber and non-meat protein ingredients may reduce diameter shrinkage and weight loss. Loss of weight occurred during cooking chicken burger mainly due to moisture evaporation and drip of melted fat.
3.7.2. Effect of orange by-product on storage stability of produced low fat burger
3.7.2.1. Acid value
Acid values of the processed burger held under freezing condition for three months are presented in figure (2). The results showed that the addition of orange juice by-product (OJBP) into burger formulations resulted in a slight increase in acid values of burger samples when compared with acid value of control sample. This may be due to the acidic effect of OJBP as reported by Ballard et al. (2010). On the other hand, acid value continuously decreased in all beef burger treatments during storage at -18 ± 2°C for 3 months. Degradation of burger protein during frozen storage resulted in formation of some basic compounds (such as volatile nitrogen compounds, amines and hydrogen sulfide) leading to increase pH value (Oroszvári et al., 2006). These results are in agreement with those reported by Ibrahium et al. (2015). They concluded that incorporation of orange peel extracts into beef burger formulations caused improving or retention of physiochemical quality criteria (such as pH value, WHC, cooking loss, TVBN and TBA contents) during frozen storage at -18 ± 2°C for 3 months.
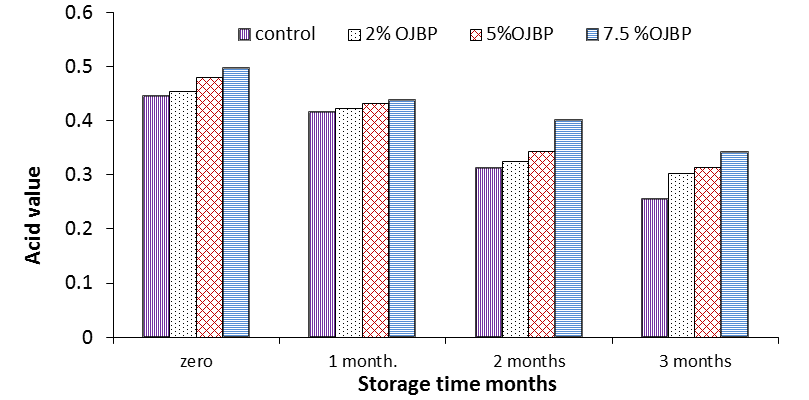
Figure (2): Effect of OJBP at different substitution levels on the acid value of low fat beef burger during storage
3.7.2.2. Peroxide value
Effect of orange juice by-product at different substitution levels on the peroxide value of low fat beef burger was investigated, and the results are presented in figure (3). The results indicated that the peroxide value in all treatments tended to increase significantly by the progress of storage period up to 3 months. Data revealed that the initial PV value was 4.65 (meq/kg fat) in the control sample and 2.963, 0.2, and 0.15 (meq/kg fat) for burgers formulated with orange juice by-products (2.5, 5, and 7.5%) respectively (at time zero). The results also revealed that PV value had gradually increased during storage at -18±2˚C for 3 months, the highest level was recorded for the control sample after 3 months storage (26.076 (meq/kg fat) while the lowest level was recorded for the sample with 7.5% OJBP as fat replacer which recorded 9.53 meq/kg fat in the end of the storage period.
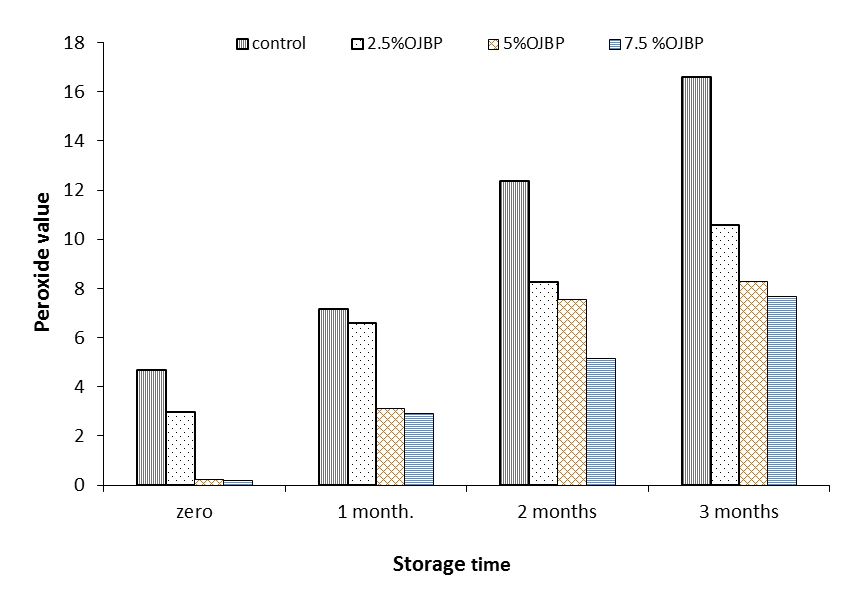
Figure (3): Effect of OJBP at different substitution levels on the peroxide value of low-fat beef burger during storage
The results indicated that replacement of fat with orange juice by-products lower the oxidation rat in all substitution levels examined. This finding could be attributed to the high phenolic and carotenoids content of the orange juice by-product which acts as antioxidant and minimize the fat oxidation proses. These results are in agreement with those for Alina et al. (2012). Ramadan et al. (2013) reported that addition of cereal grain fractions as natural antioxidants led to the oxidative stability of chicken burgers. Ibrahim et al. (2018) concluded that the addition of plant waste extracts (such as orange peel) into beef burger formulations as a good source of antioxidant compounds improved the oxidative stability and nutritional value as well as microbiological quality of produced beef burgers.
3.7.3. Sensory evaluation of low-fat beef burger with different levels of orange by- product as fat replacers.
Effect of adding orange juice by-product as fat replacer on sensory properties of beef burger was investigated and the obtained data are summarized in figure (4). The mean values of the appearance, color, odor, texture, taste and tenderness were evaluated to determine overall acceptability of the product. The results showed that addition of 2.5% OJBP in burger formula led to higher sensory score in the entire sensory evaluated parameters compared to the control sample. The improvement of color and taste of the burger with 2.5% OJBP could be attributed to the pigments and the flavor content of the dried OJBP. On the other hand, the high score recorded for the texture and tenderness of the products compared to control sample might be attributed to the incorporation of orange by-product in burger which resulted in the decreased protein binding and increases the moisture and fat retention in the products as cleared by Huda et al., (2014). This finding is in agreement with those of Choi et al. (2009), who found that hardness of control meat batters (30% animal fat) was lower than those found in reduced fat meat batters (10% animal fat) containing vegetable oils and rice bran fiber.
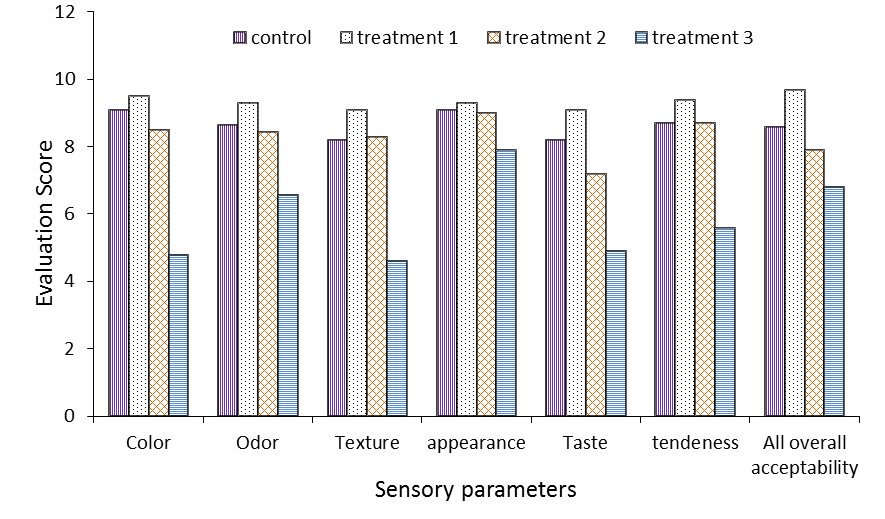
Figure (4): Effect of orange by-product powder as a fat replacer at different levels on sensory parameters of low-fat Burger
The results in Figure (4) proved that no significant differences (p ≥ 0.05) between the control sample and the sample with 5% substitution level in odor, texture, appearance and tenderness. It could also note that increasing the substitution level to 7.5% led to detrimental decrease in all the sensory parameters of the burger samples and has negative effect on the acceptability of burger. This reduction in the acceptance of texture is probably the result of the highly hydrated fiber level and the larger reduction of fat, which caused a mushy, too soft texture in this sample. For the overall quality attribute, consumers did not attribute differences (P > .05) among the burgers with up to 5% of JPBP as source of fiber and the control burgers (without added fiber). These results are agreed with that obtained by (Kokare, 2013 and Ammar, 2017). Salem (2013) reported that addition of tomato peels 3% did not have any negative effect on the acceptability of sausages rather it has partially improved the color of the product. Choe et al. (2013) reported that a wheat fiber mixture could be used as a fat replacer without altering the sensory attributes of low-fat frankfurter-type sausages.
The replacement of wheat flour by dried orange juice by-product in cake at 5% level found to be effective in improving the physical and sensory parameters of the sponge cake. However, the high replacement level (10%) caused significant differences in the acceptance of the product compared to the control samples. The use of orange juice by-product was found to be effective in improving the cooking characteristics of the product, affecting positively the yield and appearance of low-fat burgers. The burgers with up to 5% orange juice by products and as fat replacer present either higher or non-significant changes in the technological characteristics and sensory acceptability as compared to the Control samples. In conclusion, it could be seen that dried orange juice by-product may use as interesting source for fiber and bioactive compounds in sponge cake and beef burger for people who want to reduce energy intake and/or increase the proportion of insoluble fiber in their diet.
A.A.C.C. (2000). Official methods of analysis, of AACC International, American association of cereal chemists. Washington, D.C., U.S.A
A.O.A. C. (2005). Official Method of Analysis of the Association of Official Analytical Chemists, published by the Association of Official Analytical Chemists Inc. Arlington, Virginia, 22209, U.S.A.
Aastha R. and Dorcus M. (2012). Physicochemical and rheological properties of wheat flour bun supplemented with orange peel powder. International Journal of Science and Research, 3: 358 - 361.
Abba Pacôme, O., Bernard, D. N., Sékou, D., Joseph, D. A., David, N. J., Mongomaké, K. and Hilaire, K. T. (2014). Phytochemical and antioxidant activity of roselle (Hibiscus sabdariffa L.) Petal Extracts. Research Journal of Pharmaceutical, Biological and Chemical Sciences. 5(2):1453-1456.
Abd El-Moniem, G.M. and Yassen, A.A. E. (1993). High dietary fiber cookies from several sources of bran or husk. Egypt, Journal of Food Science, 21: 157-170.
Alakali, J. S., Irtwange, S. V. and Mzer, M. T. (2010). Quality evaluation of beef patties formulated with bambara groundnut (Vigna subterranean L.) seed flour. Meat Science, 85(2): 215-223.
View ArticleAleson-Carbonell, L., Fernandez-Lopez, J., Perez-Alvarez, J.A. and Kuri, V. (2005). Characteristics of beef burger as influenced by various types of lemon albedo. Innovative food science and emerging technologic, 5: 220-226.
Alina, A., Syuhada, H. S., Syazamawati, Z. H. and Thema, M. J. (2012). Effect of different cooking methods on formation of cholesterol oxidation products in pork and beef. World Applied Sciences Journal 17:17-20.
Alvarez-Jubete, L., Arendt, E. and Gallagher, E. (2010). Nutritive value and chemical composition of pseudo cereals as gluten-free ingredients. International Journal of Food Sciences and Nutrition, 60: 240-257.
View ArticleAmmar, M.S. (2017). Producing of high fiber chicken meat nuggets by using different fiber sources, Food Science and Technology Department, Faculty of Agriculture, Al Azhar University, Cairo, Egypt, 06 (02): 415-423.
Anderson, E. T. and Berry, B.W. (2000).Sensory, shear and cooking properties of low-fat beef patties made with inner pea fiber. Journal of Food Science, 65(5):805-810.
View ArticleAsami, D. K., Yun-Jeong, H. and Alyson E M. (2003). Comparison of the total phenolic and ascorbic acid content of freeze-dried and air-dried marionberry, strawberry, and corn grown using conventional, organic, and sustainable agricultural practices. Journal of Agricultural and Food Chemistry, 51(5):1237-1241.
View ArticleBallard, T. S., Mallikarjunan, P., Zhou, K., and O'Keef, S. F. (2010). Microwave-assisted extraction of phenolic antioxidant compounds from peanut skins. Food Chemistry, 120(4):1185-1192.
View ArticleBaptistella, L. H. B., Imamura, P. M., Melo, L.V. and Castello, C. (2019). Preparation of (+)-α-terpineol from (+)-limonene: monoterpenes with pleasant odor in a project for undergraduate organic chemistry laboratory. Quím. Nova, 32:.1069-1071.
View ArticleBenavente-Garcia O. and Castillo, J. (2008). Update on uses and properties of citrus flavonoids: new findings in anticancer, cardiovascular, and anti-inflammatory activity. Journal Agriculture Food Chemistry, 56:6185-6205
View ArticleBorycka, B. K. R. (2010). "Binding cadmium and lead using natural polysaccharide fibers from some fruit and vegetable wastes," Zywnosc: Nauka, Technologia, Jakosc, vol. 69, no. 2: 104-110, 2010.
Chen, H., Leung, H. K., Rubnthaler, G. L. and Baranowski, J. D. (1988).Chemical, physical, and baking properties of apple fiber compared with wheat and oat bran. Cereal Chemistry 65(3).101-106.
Choe, J.H., Kim, H.Y., Lee, J.M., Kim, Y.J., Kim, C.J. (2013). Quality of frankfurter-type sausages with added pig skin and wheat fiber mixture as fat replacers. Meat Science, 93 (4) (2013), pp. 849-854
View ArticleChoi, Y.S., Choi, J.H., Han, D.-J., Kim, H.-Y., Lee, M.-A., Kim, H.-W., Kim, C.-J. (2009). Characteristics of low-fat meat emulsion systems with pork fat replaced by vegetable oils and rice bran fiber. Meat Science, 82(2), 266-271.
View ArticleCrehan, C. M., Hughes, E., Troy, D. J. and Buckley, D. J. (2000). Effect of fat level and maltodextrin on the functional properties of frankfurters formulated with 5, 12 and 30% fat. Meat Science, 55:403-409. 00006-1
View ArticleDhen, N., Román, L., Rejeb, I. B., Martínez, M. M., Garogouri, M. and Gómez, M. (2016).Particle size distribution of soy flour effecting the quality of enriched gluten-freecakes. LWT- Food Science and Technology, 66: 179-185.
View ArticleDoweidar, M. M. (2001). Chemical and physical studies on some natural resources used in improving bakery products. Ph. D. Thesis, Fac. of Agric. Cairo Univ. Egypt.
El-Akary, M.O. (1986). The technology and characteristics of beef burger containing plant substituents. M.Sc. Thesis, Fac. of Agric. Alex Univ. Egypt.
Espinosa-Pardo, F.A., Martinez, J. and Martinez-Correa, H.A. (2017).Extraction of bioactive compounds from peach palm pulp (Bactrisgasipaes) using supercritical CO2. Journal Superscript Fluids, 93:2-6.
View ArticleFernandez-Lopez, J., Sendra-Nadal, E.m Navarro, C., Sayas, E.,Viuda-Martos, M. and Alvarez, J. A. (2009).Storage stability of a high dietary fiber powder from orange by-products. International Journal of Food Science and Technology, 44(4):748-756.
View ArticleFiguerola, F., Hurtado, M. L., Estévez, A. M., Chiffelle, I. and Asenjo, F. (2005).Fiber concentrates from apple pomace and citrus peel as potential fiber sources for food enrichment. Food Chemistry, 91: 395-401
View ArticleFiszman, S. M. and Salvador, A. (2003). Recent developments in coating batters. Trends Food Science and Technology, 14: 339-407. 00153-5
View ArticleGalanakis, C., Tornberg, E. and Gekas, V. (2010). Dietary fiber suspensions from olive mill wastewater as potential fat replacements in meatballs, LWT-Food Science and Technology, 43 (7): 1018-1025.
View ArticleGarden, J. (1993). Flaxseed gum: Extraction, characterization and functionality. PhD dissertation. Fargo, ND USA: Department of Cereal Science, North Dakota State University.
Ghanbari, M., and Farmani, J. (2013). Influence of hydrocolloids on dough properties and quality of Barbary: an Iranian leavened flat bread. Journal of Agricultural Science and Technology, 15 (3): 545-555.
Ghasemi, K., Ghasemi, Y. and Ebrahim-zadeh, A. M. (2009). Antioxidant activity, phenol and flavonoid contents of 13 citrus species peels and tissues, Pakstanian Journal Pharmaceutical Science, 22 (3):.277-281
Gilbert, J. C. (2002). Evaluation of flax and rice bran on the physical and chemical properties of bread for achieving health benefits. MSc Thesis, Purdue University, West Lafayette, IN.
Gujral, H. S., Kaur, A., Singh, N. and Sodhi, N.S. (2009). Effect of liquid whole egg, fat and textured soy protein on the textural and cooking properties of raw and baked patties from goat meat. Journal of Food Engineering, 53 (4): 377-385. 00180-7
View ArticleHegazy A. I. and Ibrahium M. I. (2012). Antioxidant activities of orange peel extracts. World Applied Sciences Journal, 18 (5):684-688.
Hocman, G. (1988).Chemoprevention of cancer: Phenolic antioxidants (BHT, BHA). International Journal of Biochemistry, 20 (7):639-51. 90158-9
View ArticleHuang, L.Y. and Ma, S.Y. (2016).The effect of extrusion processing on the physiochemical properties of extruded orange pomace. Food Chemistry, 192: 363-369.
View ArticleHuda, B.A., Shahnaz, P., Sajad, A.R., Rehana, A. and Massarat, H. (2014). Effect of incorporation of apple pomace on the physico-chemical, sensory and textural properties of mutton nuggets. International Journal of Advanced Research, 2(4): 974-983.
Ibrahim, H.M., Ibrahim, M. H and Hamed, A.M. (2018). Application of lemon and orange peels in meat products: Quality and Safety. International Journal of Currant Microbiological Applied Science, 7(4): 2703-2723.
View ArticleIbrahium, M. I., Osheba, A.S. and Nageib, A.M.(2015). Using of some natural antioxidants extracted from food processing wastes for iImprovement quality attributes of beef burger products. Middle East Journal of Applied Sciences, 5 (4): 929-939
Jaime, L., Molla, E., Fernandez, A., Martin-Cabreja, S. M., Lopez-Andreu, F. and Esteban, R. (2002). Structural carbohydrates differences and potential source of dietary fiber of onion (Allium cepa L.) tissues. Journal of Agricultural and Food Chemistry, 50: 122- 128.
View ArticleKethireddipalli, P., Hung, Y.C., Phillips, R. O. and Mc Watters, K. H. (2002). Evaluating the role of cell material and soluble protein in the functionality of cowpea (Vigna unguiculata) pastes. Journal of Food Science, 67(1): 53-59.
View ArticleKim, J. H., Lee, H. J., Lee, H. S., Lim, E. J., Imm, J. Y. and Suh, H. J. (2012).Physical and sensory characteristics of fiber-enriched sponge cakes made with Opuntia humifusa. LWT- Food Science and Technology, 47: 478-484
View ArticleKim, T. K., Hwang, K. E., Sung, J. M., Park, J. D., Kim, M. H., Jeon, K. H. and Choi, Y. S. (2015). Replacement of pork back fat with pre-emulsion of wheat (Triticum aestivum L.) sprout and collagen and its optimization for reduced-fat patties. Journal of Food Processing and Preservation, 42:1-7.
View ArticleKoca, A. and Anil, M. (2007). Effect of flaxseeds and wheat flour blends on dough rheology and bread quality. Journal of the Science of Food and Agriculture. 87:1172-1175.
View ArticleKokare, P.G. (2013). Development of functional chicken nuggets by incorporation of orange peel and pulp powder. M. V. Sc. thesis submitted to Maharashtra Animal and Fishery Sciences University, Nagpur.
Lario, Y., Sendra, E., Garcia- perez, J., Fuentes, C., Sayas- barbera, E. , Fernandez-lopez, J. and Perez-alvarez. .J. A. (2004). Preparation of high dietary fiber from lemon juice by-products. Innov. Food Science Emerg. and Technology, 5: 113-117.
Lebesi, D. M. and Tzia, C. (2011). Effect of the addition of different dietary fiber and edible cereal bran sources on the baking and sensory characteristics of cupcakes. Food Bio products Technology, 4: 710-722.
View ArticleLees, R. (1975).Food analysis: analytical and quality control methods for the food manufacturer and buyer .laboratory handbook of methods of analysis, lenoard Hill Book Publisher, London, England.
Lu, T. M., Lee, C. C., Mau, J. L. and Lin, S. D. (2010). Quality and antioxidant property of green tea sponge cake. Food Chemistry, 119: 1090-1095.
View ArticleMa, M.-M. and Mu, T-H. (2016). Effects of extraction methods and particle size distribution on the structural, physicochemical, and functional properties of dietary fiber from deoiled cumin. Food Chemistry, vol. 194. 237-246.
View ArticleMacagnan, F. T.; da Silva, L. P. and Hecktheuer, L. H. (2016). Dietary fiber: The scientific search for an ideal definition and methodology of analysis, and its physiological importance as a carrier of bioactive compounds. Food Research International, 85: 144-154.
View ArticleMajzoobi, M., Habibi, M., Hedayati, S., Ghiasi, F. and Farahnaky, A. (2015). Effects of commercial oat fiber on characteristics of batter and sponge cake. Journal of Agriculture. Science and Technology, 17: 99-107
Manzoni, G.M., Castelnuovo, G. and Molinari, E., (2008). Weight loss with a low-carbohydrate, Mediterranean, or low-fat diet. The New England Journal of Medicine, Vol. 359, No. 20: 2170-2172,
View ArticleMartí, I. N., Saura, D., Fuentes, E., Lizama, V., García, E., Mico-Ballester, M.J. and Lorente, J. (2011). Fiber from tangerine juice industry. Industrial Crops and Products, 33 (1): 94-98
View ArticleMartínez-Cervera, S., Salvador, A., Muguerza, B., Moulay, L. and Fiszman, S. M. (2012). Cocoa fiber and its application as a fat replacer in chocolate muffins. LWT- Food Science and Technology, 44: 729-736.
View ArticleMikhaila, W. Z., Sobhy, H. M., Khallaf, M. F., Ali, M. Z, El-askalany, S. A. and Ezz El-Din, M. M. (2014). Suggested treatments for processing high nutritive value chicken burger. Annals of Agricultural Science, 59(1): 41-45.
View ArticleO'Shea, N.; Ktenioudaki, A., Smyth, T.P., McLoughlin, P., Doran, L., Auty, M., Arendt, E. and Gallagher, E. (2015). Physicochemical assessment of two fruit by-products as functional ingredients: Apple and orange pomace, Journal of Food Engineering, 153: 89-95.
View ArticleOcen, D. and Xu, X. (2013). Effect of citrus orange (Citrus sinensis) by-product dietary fiber preparations on the quality characteristics of frozen dough bread. American Journal of Food Technology, 8:43-53.
View ArticleOrdon, JD., Gomez, MA., and Vattuone, MI (2007). Antioxidant activity of Sechium edule (Jacq) Swarts extracts. Food chemistry, 97:452-458.
View ArticleOroszvári, B. K., Rocha, C. S., Sjöholm, I. and Tornberg, E., (2006). Permeability and mass transfer as a function of the cooking temperature during the frying of beef burgers. Journal of Food Engineering, 74(1):1-12.
View ArticlePark, Y.; Brinton, L.A., Subar, A.F., Hollenbeck, A. and Schatzkin, A. (2009). Dietary fiber intake and risk of breast cancer in postmenopausal women: The national institutes of health-AARP diet and health study. American Journal Clinical Nutrition, 90: 664-671.
View ArticlePourabedin, M., Aarabi, A. and Rahbaran, S. (2017). Effect of flaxseed flour on rheological properties, staling and total phenol of Iranian toast. Journal of Cereal Science, 76:173-178.
View ArticlePreston, K. R. and Hoseney, R.C. (1991). Applications of the extensigraph. In: The Extensigraph Handbook. V. F. Rasper (Ed.), American Associate Cereal Chemistry. St Paul, MN., 13-19.
Qureshi, A. A., Ainee, M., Nadeem, M., Munir, T.M. and Jabbar, S. (2017). Effect of grape fruit albedo powder on the hysicochemical and sensory attributes of fruit cake. Pakistan Journal of Agricultural Research, 30(2): 185-193.
View ArticleRainakari, A., Rita, H., Putkonen, T. and Pastell, H.H. (2016). New dietary fiber content results for cereals in the Nordic countries using AOAC 2011.25 method. Journal of Food Composition and Analysis, 51: 1-8.
View ArticleRamadan, B. R., Sorour, M. A. and Kelany, M. A. (2013). Effect of cereal grain by-products addition on oxidative stability of chicken burgers during storage, Wudpecker Journal of Food Technology Vol. 1(6): 104 - 107.
Ramadan, K., Huda, N. and Ahmad, R. (2013). Physicochemical characteristics and sensory properties of selected Malaysian commercial chicken burgers. International Food Research Journal, 18:1349-1357.
Raninen, K., Lappi, J., Mykkanen, H. and Poutanen, K. (2011).Dietary fiber type reflects physiological functionality: comparison of grain fiber, inulin, and polydextrose. Nutrition Review, 69: 9-21.
View ArticleRodríguez, R. A., Fernández-Bolaños, J., Guillén, R. and Heredia, A. (2006). Dietary fiber from vegetable products as a source of functional ingredients. Trends in Food Sciences and Technology, 17: 3-15.
View ArticleRonda, F., M. Gomez, C. A. Blanco, and. Caballero, P. A. (2005). Effects 'of polyols and non-digestible oligosaccharides on the quality of sugar-free sponge cakes, Food Chemistry. 90, (4):.549-555.
View ArticleSabanis, D., Lebesi, D. and Tzia, C. (2009). Effect of dietary fiber enrichment on selected properties of gluten-free bread. LWT-Food Science and Technology, 42(8):1380-1389.
View ArticleSalem, R. H. (2013). Quality characteristics of beef sausages with tomato peel as a color and functional additive during frozen storage. World Applied Sciences Journal, 22 (8):1085-1093.
Selani, M. M., Shirado, G. A.N., Margiotta, G. B., Saldaña, E., Spada, P. F., Piedade, M.S., Contreras-Castillo, C. J. and Canniatti-Brazaca, S. G., (2016). Effects of pineapple byproduct and canola oil as fat replacers on physicochemical and sensory qualities of low-fat beef burger. Meat Science, 112: 69-76.
View ArticleSeleim, M. A. (2008). The dietary Fiber, total phenolic content, and antioxidant activity of orange peels, Assiut Journal of Agriculture Science, 9 (1):39-52.
Sharma, S. K., Bansal, S., Mangal, M., Dixit, A. K., Gupta, R. K. and Mangal, A. K., (2016). Utilization of food processing by-products as dietary, functional, and novel fiber: a review," Critical Reviews in Food Science and Nutrition, 56 (10): 1647-1661.
View ArticleSharoba, A.M., Farrag, M. A.and Abd El-Salam, A.M. (2013). Utilization of some fruits and vegetables waste as a source of dietary fiber and its effect on the cake making and its quality attributes. Journal of Agro-alimentary.
Sturm, K., Koron, D. and Franci, S. F. (2003). The composition of fruit of different strawberry verities depending on maturity stage. Food Chemistry, 83(3):417-422. 00124-9
View ArticleSudha, M. L., Baskaran, V. and Leelavathi, K. (2007a). Apple pomace as a source of dietary fiber and polyphenols and its effect on the rheological characteristics and cake making. Food Chemistry, 104: 686-692.
View ArticleTalukder, (2015). Effect of Dietary Fiber on Properties and Acceptance of Meat Products: A Review, Critical Reviews in Food Science and Nutrition, 55(7): 1005-1011.
View ArticleTietz, N.W. (1995).Formulation of Reduced Calorie and Trans-free Fat Biscuits Using Palm Oil and Sucralose: Study of Their Hypoglyc-emic Activity on Albino Rats. American Journal of Food and Nutrition, 3 (6):131-140.
Tse, P. W., Leung, S. S., Chan, T., Sien, A. and Chan, A. K. (2000). Dietary fiber intake and constipation in children with severe developmental disabilities. Journal of Paediatrics and Child Health, 36 (3): 236-239.
View ArticleWang, Y., Wang, W., Jia, H., Gao, G., Wang, X., Zhang, X. and Wang, Y. (2018). Using cellulose nano fibers and its palm oil pickering emulsion as fat substitutes in emulsified sausage. Journal of Food Science, 83(6):1740 - 1747.
View ArticleWu, G. D., Chen, J. and Hoffmann, C. (2011). Linking long-term dietary patterns with gut microbial enterotypes. Science, Vol. 334, No. 6052: 105-108, 2011.
View ArticleYang, Y., Ma, S., Wang, X. and Zheng, X. (2017). Modification and application of dietary fiber in foods. Journal of Chemistry. Volume, 8:1-9.
View ArticleYılmaz, I. (2005). Physicochemical and sensory characteristics of low fat meatballs with added wheat bran. Journal of Food Engineering, 69: 369-37.
View ArticleZia-ur-Rehman, (2006).Citrus peel extract - A natural source of antioxidant, Food Chemistry, 99: 450-454.
View Article