Aidong Sun
Email: adsun@bjfu.edu.cn
© 2019 Sift Desk Journals. All Rights Reserved
VOLUME: 4 ISSUE: 2
Page No: 614-628
Aidong Sun
Email: adsun@bjfu.edu.cn
Yue Zhu, Yulong Wei, Jiaying Zhang, Nan Zhang, Yuqing Lei, Zhilin Gan, Aidong Sun
College of Biological Sciences and Technology, Beijing Forestry University, Beijing 100083, China.
Ningxuan Gao(gaoningxuan1990@163.com)
Shamprasad Varija Raghu(shamprasad@mangaloreuniversity.ac.in)
Ewa M Kalemba(kalemba@man.poznan.pl)
Shulin Wang(wangsl1970@163.com)
Ai-dong Sun, Isolation and Identification of procyanidins in Aronia Melanocarpa Using NMR, LC-IT-TOF/MS/MS and MALDI-TOF MS(2019)SDRP Journal of Food Science & Technology 4(2)
Aronia melanocarpa berries procyanidins (Amps) were divided in three fractions: ethyl acetate phase extract of Amps (E-Amps), aqueous phase extract of Amps (W-Amps), and methanol phase extract of Amps (M-Amps). Flavan-3-ol monomers and oligomeric procyanidins were isolated from E-Amps using Sephadex LH-20 column chromatography and reversed-phase preparative HPLC. 1H and 13C NMR analyses indicated five flavan-3-ol monomers and oligomeric procyanidins: (+)- catechin, (‒)- epicatechin, procyanidin B2 [EC-(4β→8)-EC], procyanidin B1 [EC-(4β→8)-C], and procyanidin C1 [EC-(4β→8)-EC-(4β→8)-EC]. MALDI-TOF-MS analysis demonstrated that the structure units of polymeric Amps, which were linked by B-type bonds, contained only catechin and epicatechin. In addition, the degree of polymerization was from pentamer to twenty-two polymer. Five flavan-3-ol monomers and oligomeric procyanidins had strong antioxidant activities. The DPPH and ABTS free-radical scavenging capacities followed the order: flavan-3-ol monomers > dimeric procyanidins > trimeric procyanidins > ascorbic acid. However, FRAP values increased with a degree of polymerization.
Keywords: Aronia melanocarpa berries; Procyanidins; Structural identification; Antioxidant activity.
Aronia melanocarpa is a member of the Rosaceae family, which originates from the eastern parts of North America and East Canada. A. melanocarpa shrubs are approximately 2–3 m tall (Kulling Se, 2008; Esatbeyoglu and Winterhalter, 2010). Aronia berries (A. melanocarpa berries) are rich in nutrients that contain dietary fiber, organic acids, sugar, fat, protein, minerals, vitamins, and so on. Especially, the polyphenol contents of Aronia berries, including procyanidins, anthocyanidins, phenolic acid, and isoflavones, is higher than in other berries. The phenolics content of Aronia berries is 80–180 times more than that of grapes, 1,000–2,000 times more than that of banana, and five times as much as that of blueberries (Kulling Se, 2008). Research shows that Aronia berries have various physiological and pharmacological activities, such as anti-inflammatory and antiviral effects (Zapolska-Downar et al., 2012; Handeland et al., 2014), prevention cardiovascular disease (Valcheva et al., 2007) and so on. The rich phenolic content of Aronia berries is responsible for many of their medicinal properties. Moreover, the procyanidins content of Aronia berries is the highest among other phenolic substances and plays an important role in physiological and pharmacological activities (Wu et al., 2004). The bioactivity of procyanidins is generally recognized to be largely dependent on their structure, including the degree of polymerization (DP), the linking type of flavan-3-ol units, and the hydroxylation of constitutive units (Sójka et al., 2013; Neilson et al., 2016). However, different flavan-3-ol monomers can be linked into polymers from hundreds to thousands of molecular weights in different connection ways because of the diversity and complexity of the procyanidins structure. Therefore, few researchers have explored the specific structural information of each flavan-3-ol monomer and oligomeric procyanidin. Particularly, the structure of polymeric procyanidins is very complex, and thus current methods of isolation and purification cannot determine the specific structure information of a single procyanidin polymer.
“Oxidative stress” can lead to various chronic diseases, such as atherosclerosis, cancer, senility. and neurodegenerative diseases (Jurikova et al., 2017; Wei et al., 2017). Several in vitro studies have displayed the strong antioxidant properties of proanthocyanidins in rat and cell models where oxidative stress markers were observed to have significant reductions. Xiao-Xin Chen et al.’s research indicated that the proanthocyanidins from Caryota ochlandra fruit pericarp and fruit flesh exhibited a stronger antioxidant activity and showed a comparable antioxidant activity with that of ascorbic acid (Chen et al., 2014). Moreover, the different DP of procyanidins plays an important role in antioxidant activity. Polymeric procyanidins effectively protect HepG2 cells against oxidative damage than oligomeric procyanidins (Kim et al., 2013). Pei-Ling Huang et al. demonstrated that the antioxidant capacity of procyanidins is highly correlated with their DP. The Trolox equivalent antioxidant activity (TEAC) of areca nut procyanidins was gradually enhanced with the increase of the DP (Huang et al., 2010). Nevertheless, the determination of antioxidant capacity is based on procyanidins extract, which contains impurities or a mixture of different DP of procyanidins. Few studies have investigated the relationship between each flavan-3-ol monomers and oligomeric procyanidins of different DP (e.g., DP 1, DP 2, and DP 3) and their oxidative stability.
In short, the aim of the present study was to investigate the structure information and DP of polymeric procyanidins by ultraviolet/visible (UV/vis), infrared (IR) spectroscopy, and MALDI-TOF-MS. The specific structure of flavan-3-ol monomers and oligomeric procyanidins from Aronia berries were determined with the LC MS-IT/TOF, 1H, and 13C NMR spectra method. In addition, the antioxidant activities (DPPH and ABTS radical scavenging capacity and FRAP values) were explored to analyze the relationship between flavan-3-ol monomers and oligomeric procyanidins structure and its antioxidant activity in order to provide a scientific basis for developing and utilizing Amps further.
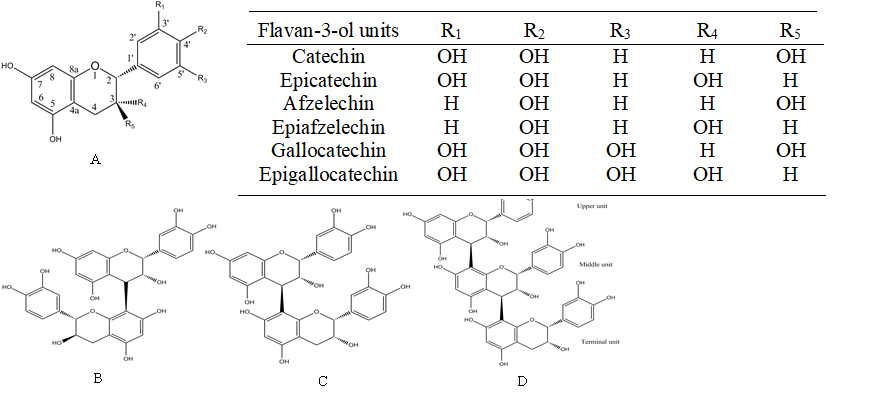
Figure 1. Structures of the flavan-3-ol units in proanthocyanidins (A); Procyanidin B1 [EC-(4β→8)-C] (B); Procyanidin B2 [EC-(4β→8)-EC] (C); Procyanidin C1 [EC-(4β→8)-EC- (4β→8)-EC ] (D)
2.1 Materials and reagents
A. melanocarpa (FukangyuanⅠ) was obtained from Yanbian (Jilin, China) and stored at -80 °C until used. HPLC grade methanol was purchased from Sigma (St. Louis, MO). All solvents used were of analytical grade unless otherwise explained. SephadexTM LH-20 was purchased from GE Healthcare Bio-Sciences AB (Uppsala, Sweden), and AB-8 macroporous resin was provided by Yuanye Biotechnology Co. Ltd. (Shanghai, China). 2,2-Diphenyl-1-picrylhydrazyl (DPPH), 2,2′-azino-bis-(3-ethylbenzo-thiazoline-6-sulphonic acid) diammonium salt (ABTS), and 2,4,6-tri (2-pyridyl)-1,3,5-triazine (TPTZ) were purchased from Sigma-Aldrich (St. Louis, MO, USA).
2.2 extract and purification of Amps
Frozen Aronia berries (10 kg) were crushed using a beater for 3 min. Then, materials were extracted with a 13:7 (v/v) ethanol/water solution at 65 °C for 60 min (simultaneous with 20 min ultrasonic extraction). The solution was centrifuged at 4000 r/min for 20 min. The supernatant was collected, and ethanol was removed from the supernatant through rotatory evaporation under vacuum at 60 °C. The crude extract of Amps was freeze-dried and stored at -80°C. Then, the crude extract of Amps was purified by AB-8 macroporous resin according to previous studies (Yue and Fen Mei, 2017), and the purified extract of Amps was lyophilized.
2.3 Separation and preparation of Amps
To separate procyanidins, the purified extract of Amps (95.00 g) was dissolved in water, and the insoluble fraction can be dissolved in 95:5 (v/v) methanol‒water solution. Ethyl acetate was applied to extract oligomeric procyanidins from the water phase extract of Amps. Subsequently, ethyl acetate, water, and methanol were removed by rotatory evaporation under vacuum at 60 °C. The three fractions were freeze-dried and stored at -80 °C. Therefore, the purification of Amps was divided into three fractions: ethyl acetate phase extract of Amps (E-Amps, 3.15 g), aqueous phase extract of Amps (W-Amps, 48.69 g), and methanol phase extract of Amps (M-Amps, 28.23 g). E-Amps (3.00 g) were separated by a Sephadex LH-20 column using stepwise gradient elution with methanol‒water (30:70 v/v, 400 mL) and methanol‒water (50: 50 v/v, 400 mL) to remove sugars, glycosides, quercetin, and others flavonoid, followed by elution with methanol‒water (80: 20 v/v, 400 mL), methanol‒water (95:5 v/v, 200 mL), and acetone‒water (70:30 v/v, 200 mL) to collect the three fractions (E1, E2, and E3, respectively). The three fractions were freeze-dried and used for further isolation by preparative HPLC.
A preparative SIMADZU HPLC system was used to isolate flavan-3-ol monomers and oligomeric procyanidins from E-Amps fractions E1, E2, and E3. The equipment consisted of a LC-6AD HPLC pump, a SPD-10A with preparative flow cell, a prominence SPD-20A PDA detector, a LC-20A manual injector (2 mL), a FRC-10A fraction collector, and the Labsolutions software. The following preparative HPLC columns YMC (26 mm × 250 mm, Kyoto, Japan) was adopted for preparing five fractions (1, 2, 3, 4, 5). Water (solvent A) and methanol (solvent B) were used as solvent systems. The flow rate was 5.5 mL/min, and the injection volume for samples was 2 mL. The isometric elution method was utilized to prepare five fractions with the following parameters: 1 and 2 compounds: 0‒40 min, 30% B; 3 and 4 compounds: 0‒160 min, 30% B; 5 compound: 0‒120 min, 40% B.
The W-Amps and M-Amps fractions (10.00 g, respectively) were also separated by a Sephadex LH-20 column and were eluted by methanol‒water (50:50 v/v, 600 mL), methanol‒water (80:20 v/v, 600 mL), and acetone‒water (70:30 v/v, 300 mL), and the acetone‒water (70 : 30, v/v) elution fractions were collected. Then, acetone was removed, and the sample solutions were freeze-dried to obtain W1 (3.93 g) and M1 (2.05 g) fractions.
2.4 Characterization and structure analysis of Amps
2.4.1 Spectroscopy analysis of Amps
E-Amps, W-Amps and M-Amps were characterized using UV-vis and FT-IR. The UV-vis spectra were determined using a UV-6100S spectrophotometer (Metash Limited Company, Shanghai) fitted with a quartz cell between 250 and 900 nm. A PerkinElmer SpectrumTM Spectrum 100D FT-IR spectrophotometer was used to record the KBr samples of E-Amps, W-Amps and M-Amps. The spectra were scanned between 4000 and 400 cm–1 and then recorded in the transmission mode. The structure of Amps was also identified by 1H and 13C NMR spectroscopy. The 1H and 13C NMR spectra of the separated Amps in DMSO-d6 were recorded at 500 MHz using a Bruker AVANCE Ⅲ HD spectrometer.
2.4.2 LC-IT-TOF/MS/MS analysis of Amps
LC-IT-TOF/MS/MS analyses were performed with a SIMADZU LC-IT-TOF/MS/MS system (SIMADZU, Japan) in conjunction with an Agilent Eclipse XDB-C18 (4.6 mm × 250 mm, Agilent Technologies, Inc. America). Gradient elution was carried out as follows: 0‒10 min 10%‒30% B; 10‒20 min 30%‒70% B; 20‒30 min 70%‒100% B (A: 0.1 % aqueous formic acid, B: methanol). The flow rate was 1 mL/min, and the detection wavelength was 280 nm. In addition, the parameters of mass spectrometric analysis were as follows. The negative-ion mode for MS and MS/MS was set, and the spectra were scanned over a mass range of 100‒1500 m/z. The ion spray voltage was 5 kV, the drying gas temperature was 350 ℃, the capillary voltage was 3.5 kV, and the gas flow was 50 L/h.
2.4.3 MALDI-TOF MS analysis of Amps
MALDI-TOF MS was utilized to determine the structural information of W1 and M1. MALDI-TOF MS spectra were recorded on a Bruker Autoflex III instrument (Germany) and obtained according to the method of Zhang et al. (Zhang and Lin, 2008). 2,5- Dihydroxybenzoic acid (DHB) was selected as the matrix, and CS+ (Cesium chloride aqueous solution, 1.5 mg/mL) was applied as the cationization reagent.
2.5 Antioxidant activity analysis
2.5.1 DPPH assay
The DPPH radical scavenging capacities of flavan-3-ol monomers and oligomeric procyanidins were determined in accordance with the report of Brand-Williams et al. (Brand-Williams et al., 1995) with some modifications. Briefly, the DPPH solution (0.02 g) was diluted with methanol to 0.50 mmoL/L. Then, 0.50 mL of the sample solution (0.10 mg/mL, 0.13 mg/mL, 0.15 mg/mL, 0.20 mg/mL, 0.25 mg/mL) was added to 3.00 mL of the DPPH solution, and the reaction mixture was placed at room temperature for 30 min. Subsequently, the absorbance was measured at 517 nm and with methanol as a blank reference. The scavenging capacity was calculated based on the following equation:
Scavenging rate % = [(AM−AS)/AM] × 100
where AM is the absorbance in the of blank reference and AS represents the absorbance after 30 min of reaction time.
2.5.2 FRAP assay of Amp
FRAP assay was carried out with the method described by Benzie and Strain (Benzie and Strain, 1996) with slight modifications. The principle of this method is that Fe3+ - tripyridyl triazine (TPTZ) can be reduced to form Fe2+-TPTZ by the reductive substance in the sample, showing a blue color. The maximum absorbance was measured at 593 nm, and the capacity of the antioxidant activity was calculated according to the size of the absorbance. FeSO4 was used as the standard substance to draw standard curves. The antioxidant capacity of the sample, which was equivalent to the number of mmol/L of FeSO4, was indicated by the FRAP values. The FRAP working solution (6.00 mL), which was composed of a sodium acetate buffer (300.00 mmol/L 25.00 mL), a TPTZ solution (10.00 mmol/L 2.50 mL), and a FeCl3 solution (20.00 mmol/L 2.50 mL), and the sample solution (10.00 mg/mL, 200 μL) were mixed and reacted for 10 min at room temperature. The wavelength for the detection was 593 nm. All measurements were taken in triplicate.
2.5.3 ABTS assay of Amps
ABTS assay was performed according to a previously reported method by Zhang and Zhou et al. (Zhang et al., 2016). ABTS+ free radical was prepared as follows: an ABTS solution (5.00 ml 7.00 mmol/l) and a potassium persulfate solution (88 μl 2.60 mmol/l) were mixed and stored at room temperature for 16–18 h in the dark. Then, it was diluted with an ethanol/water solution (80:20 v/v) to obtain the ABTS+ working solution until its absorbance value was 0.7±0.05 at 734 nm. Trolox was used as the standard substance to draw the standard curves. The concentrations of the Trolox solutions were 100, 200, 250, 400, and 500 μmol/L. The different samples and the Trolox solutions (80 μL) were added to the diluted ABTS+ working solution (4.00 mL). The mixture solution was kept for 6 min at room temperature, and the absorbance values were detected at 734 nm. The antioxidant capacity of the sample was equivalent to the number of mmol /L of Trolox.
2.6 Statistical analysis
Statistical analyses were performed using Origin 9.0 version and the data of bioactive assays are presented as the mean ± standard deviation (SD) of three times repetition for each sample. Significance of differences was determined by using the Duncan’ s multiple range test. Statistically significant differences were set at P < 0.05
3.1 Procyanidins profile of A. Melanocarpa
The crude extract of Amps was performed with an ethanol/water solution (13:7, v/v) from frozen Aronia berries. The Amps content of the crude extract was 136.67 ± 6.64 mg/g (crude extract). After purification with AB-8 macroporous resin, the Amps content of the purified extract was 553.14 ± 4.60 mg/g (purified extract), which was four times that of the crude extract of Amps. According to previous studies by Jarkko K. et al., the procyanidins content of A. Melanocarpa is the highest among 99 other analyzed food items (Hellstrom et al., 2009). Our experimental results also proved this conclusion.
Table 1 shows that the highest yield of aqueous phase extract was 51.25%, and the highest purity of W-Amps was 35.20%. The ethyl acetate extract had the lowest yield of approximately 3.31%, which was also the lowest purity of Amps (5.50%). The yield of the methanol phase extract and the purity of M-Amps were higher than the ethyl acetate extract and the purity of E-Amps. The results demonstrated that the content of W-Amps was higher than that of M-Amps, and that of E-Amps was the lowest. Meanwhile, Table 1 shows that the average mDP (average DP) of E-Amps, W-Amps and M-Amps were 2.59, 9.12, and 14.66, respectively. This result indicated that flavan-3-ol monomers and oligomeric procyanidins existed in the ethyl acetate extract and polymeric procyanidins were left in the aqueous and methanol phase extracts. Furthermore, the flavan-3-ol monomers and oligomeric procyanidins contents were low in Aronia berries and there was a high content of polymeric procyanidins that existed in the aqueous and methanol phase extracts. The mDP of Amps is higher than the mDP of grape seed (6.4–7.3), cocoa (13.9), and brown sorghum bran (13.5), but less than the mDP of Areca catechu L. (17.5), grape skin (33.8–85.7), and lowbush blueberry (38.8) (Huang et al., 2010). Some studies have shown that ethyl acetate can be used to extract flavan-3-ol monomers and oligomeric procyanidins (Bicker et al., 2009; Sui et al., 2016). Therefore, the polymeric procyanidins were left in the aqueous and methanol phases. The experimental results indicated that flavan-3-ol monomers and oligomeric procyanidins were extracted by ethyl acetate, while many other low molecular substances were extracted by ethyl acetate, resulting in the low purity of Amps in the ester phase extract.
Table 1: E-Amps, W-Amps and M-Amps profiles of Aronia Melanocarpa
|
The fractions of Amps |
Yield (%) |
Average DP of Amps |
Purity of Amps (%) |
|
Ethyl acetate extract |
3.31 |
2.59 |
5.50 |
|
Aqueous phase extract |
51.25 |
9.12 |
35.20 |
|
Methanol phase extract |
29.72 |
14.66 |
18.15 |
3.2 UV/vis and FT-IR analysis
The UV/vis spectra showed (Figure 2) that E-Amps, W-Amps and M-Amps had the maximum absorption wavelength at 280 nm, which is a typical spectral characteristic of procyanidins (Thompson et al., 1972; Fu et al., 2015; Fu and Yang, 2015).
The E-Amps, W-Amps and M-Amps were also analyzed by FTIR. The infrared spectrograms of the three fractions are shown in Figure 3. The specific infrared spectral data are summarized in Table 2. Specifically, the bands at 3399 cm−1, 3411 cm−1, and 3400 cm−1 corresponded to the –OH stretch vibration; the band at 2974 cm−1 was assigned to the –C–H stretching vibration (Ping et al., 2012); the bands at 1384 cm−1 and 1381 cm−1 corresponded to the –C–OH deformation vibrations (Jing, 2014); the strong absorption bands at 1631, 1610, 1608, 1519, 1518, 1517, 1449, 1443, and 1443 cm−1 were attributed to the aromatic structure of the three fractions; and the bands at 1088, 1074, 1085, and 1065 cm−1 were assigned to the C–O–C stretching vibration (Fu and Yang, 2015). The bands at 804, 798, and 795 cm−1 and at 1049, 1047, and 1045 cm−1 were assigned to the CH out of-plane deformation and the C–C stretching vibration, respectively. The bands at 820 cm−1 were due to the 1, 2, 4-three substituted aromatic structure. The peaks at 880, 878, and 877 cm−1 corresponded to the aromatic ring C–H in-plane deformation.
Generally, polymers mainly of the procyanidins type shows a single peak at 1540–1520 cm-1 in the infrared spectra, whereas that of the prodelphinidins type shows a double peak. If procyanidins and prodelphinidins account for 50% respectively, it still shows a single peak. However, the bands are widened. Similarly, it shows an absorption peak at 770–780 cm-1 in the infrared spectra, with polymers mainly of the procyanidins type; otherwise, the result indicates polymers mainly of the prodelphinidins type (Foo, 1981). The comparison of the infrared spectra of the E-Amps, W-Amps and M-Amps indicates that three fractions showed a single peak at 1520–1540 cm-1, an absorption peak at 770–780 cm-1, and no absorption peak at 730 cm-1. Therefore, the E-Amps, W-Amps and M-Amps were polymers mainly of the procyanidins type. Given their high oligomeric procyanidins contents, E-Amps had strong absorption peaks at 2920 cm-1 and 1150 cm-1 in the infrared spectrum. The absence of a peak at 1710 cm−1 demonstrated that the Amps did not contain a galloyl group (Fu et al., 2015).
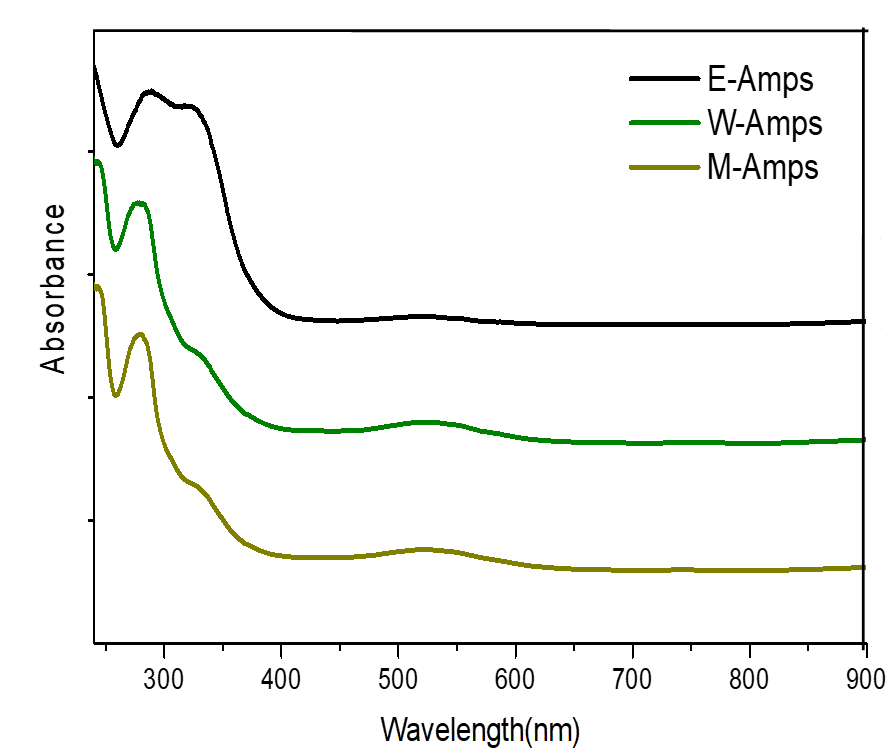
Figure 2. UV/vis of E-Amps, W-Amps and M-Amps
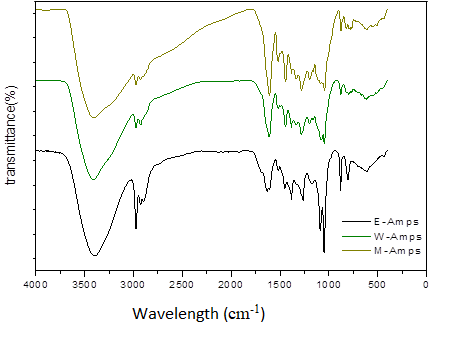
Figure 3. FT-IR spectrum of E-Amps, W-Amps and M-Amps
Table 2. Assignment of FT-IR spectra of E-Amps, W-Amps and M-Amps
|
Assignment |
Peak of E-Amps(cm-1) |
Peak of W-Amps(cm-1) |
Peak of M-Amps(cm-1) |
|
–OH stretch vibration |
3399 |
3411 |
3400 |
|
–C–H stretching vibration |
2974 |
2974 |
2974 |
|
Aromatic ring structure |
1631, 1517, 1449 |
1610, 1519, 1444 |
1608, 1518, 1443 |
|
–C–OH deformation vibrations |
1384 |
1384 |
1381 |
|
C–O–C stretching vibration |
1088 |
1074 |
1085, 1065 |
|
C–C stretching vibration |
1049 |
1047 |
1045 |
|
Aromatic ring C–H in-plane deformation |
880 |
878 |
877 |
|
1, 2, 4-three substituted aromatic ring structure |
820 |
820 |
820 |
|
CH outof- plane deformation |
804 |
798 |
795 |
3.3 MALDI-TOF MS analysis
The comparison of other soft ionization techniques indicated that MALDI-TOF MS has been widely used in determining the molecular weight of polymers in recent years. The advantage of MALDI -TOF MS is that it can rapidly and accurately measure molecular weight by producing less fragment ions for polymers analysis, without the need for reference standards. In addition, extreme sensitivity is also advantageous for the techniques (Kang et al., 2017). Therefore, MALDI-TOF MS is a powerful tool for analyzing the structure and molecular weight of polymeric procyanidins (Chai et al., 2012; Chai et al., 2017).
In our experiment, DHB was used as the matrix. The natural existence of K+ and Na+ interfere with the analysis of the proanthocyanidins hydroxyl pattern. Thus, CS+ is often used in ionizing reagents. According to the study of Van Huynh et al. (Van Huynh and Bevington, 2014), the following equation can be established: [M+Cs]+ =2+288a+304b+272c+152d-2e+133 where a, b, and c represent C/EC, GC/EGC, and Afz/EAfz, respectively. d is the galloyl group number, e is the A-type interflavan bond number, and 133 and 2 are the molecular weights of cesium and the two ends H (Chen et al., 2014; Fu et al., 2015). Figure 4 shows the MALDI-TOF mass spectra of W1 and M1. W1 has a DP from pentamer to 19 polymeric procyanidins. The DP from 14 to 22 polymeric procyanidins were found in M1. The MALDI-TOF-MS results further illustrated that W-Amps and M-Amps contain polymeric procyanidins, and the DP of procyanidins in M-Amps was higher than that of W-Amps. The difference between each adjacent polymer was 288 Da, which was the extension unit of the C/EC. Moreover, the no split sub-peaks with distances of 152 Da and 16 Da indicated that the absence of a galloyl group at the heterocyclic C-ring and prodelphinidins in the Amps. The proanthocyanidins type of Aronia berries was composed of procyanidins and not prodelphinidins and propelargonidins. Meanwhile, no series of distances between the two peaks were 2 Da multiples lower than the described peaks. Thus, we can infer that all units of procyanidins were linked by B-type bonds in Aronia berries. Therefore, the DP of Amps was from pentamer to 22 polymers, and the structure units of Amps, which contained only catechin and epicatechin, were linked by B-type bonds.
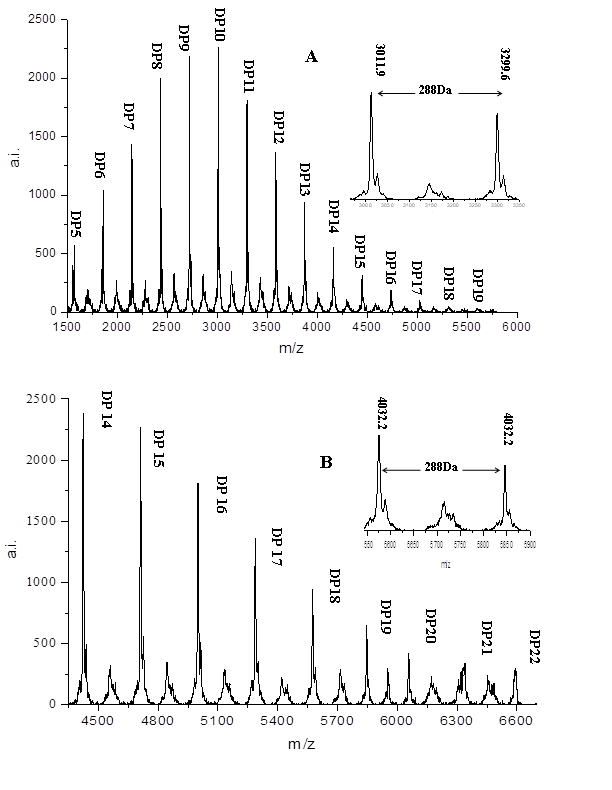
Figure 4. MALDI-TOF mass spectra of Aronia Melanocarpa berries proanthocyanidins (Amps) : W-Amps (A), M-Amps (B), MALDI-TOF MS recorded in the [M + Cs]+ mode. DP: degree of polymerization.
3.4 LC-IT-TOF/MS/MS analysis
LC-MS is an effective method for identifying the structure of procyanidins. NP−HPLC can separate procyanidins through the DP, and it could not separate procyanidins isomers. However, RP-HPLC can separate the isomers of procyanidins; it has a weak capacity for isolating the procyanidins of the four polymers above (Natsume et al., 2000). Given that the E-Amps mainly contains flavan-3-ol monomers and oligomeric procyanidins and their isomers, RP-HPLC was used to separate E-Amps in our experiment. Then, LC-IT-TOF/MS/MS analysis was first performed in the negative ion mode to study the derived E-1, E-2, and E-3. In the MS2 spectra, dimeric and trimeric procyanidins were proposed to include three fragmentation pathways. 1) Retro Diels-Alder (RDA) reactions may be the most important fragmentation for elucidating the structural information of dimers (Friedrich et al., 2000). m/z 425 ([M-C8H8O4-H]-) and m/z 407 ([M-C8H8O4-H2O-H]-) are often detected in the MS2 spectrum because of the RDA reactions, and m/z 407 has been detected in significant amounts, which are even greater than m/z = 425. 2) Cleavage of the interflavanoid linkage. The interflavonoid bond cleavage produces fragment ions m/z 289 ([M-CAT-H]-) and m/z 577 ([M-2CAT-H]-) for dimers and timers. 3) Heterocyclic ring fission (HRF) mechanisms. The fragment ion of the dimers and timers at m/z 451 ([M-C6H6O3-H]-) indicates HRF, which is obtained to eliminate the phloroglucinol molecule () (Karonen et al., 2004).
Amps was divided into three components (E-1, E-2 and E-3) by Sephadex LH-20. When the samples were separated by Sephadex LH-20, the procyanidins were eluded in the order of gradually increasing molecular weight (Ismayati et al., 2017). Figure 5 and Table 3 show that the two flavan-3-ol monomers, 1 and 2, were detected in component E-1, and the retention times were 11.17 min and 16.87 min, respectively. Two flavan-3-ol monomers were identified with m/z product ions [M-H]- 289. The possible substances were (+) -catechin and (-) -epicatechin, which must be further determined to ascertain the specific structure by NMR. A flavan-3-ol monomer (m/z [M-H]- 289) and two dimeric procyanidins (m/z [M-H]- 577) were detected in E-2, which indicated that they were B-type procyanidins formed with two (E)C units. The two dimeric procyanidins MS2 spectra showed fragment ions with m/z 251, 301, and 407 and 245, 281, 289, 407, and 559, respectively. The fragment ions of m/z 407 and m/z 289 indicated the dimeric procyanidins resulted in RDA reactions and the cleavage of the interflavanoid linkage. A trimer procyanidins (m/z [M-H]- 865) was detected in E-3. The peak time was 15.19 min, and MS2 spectra detected m/z 289, m/z 407, and m/z 695, which demonstrated that the trimer procyanidins resulted in RDA reactions and the cleavage of the interflavanoid linkage. such as trimeric procyanidins. Through the RP-HPLC-MS analysis, we can summarize that the procyanidins of Aronia berries contain two flavan-3-ol monomers, two dimeric, and one trimeric procyanidins. Given that B-type procyanidins dimers and timers have the same molecular mass and similar fragment ions, the specific structure information of each dimeric and trimeric procyanidins cannot be confirmed by mass spectrometry. Therefore, the procyanidins were collected by the preparative HPLC, and the specific structure information of each monomer was determined by NMR.
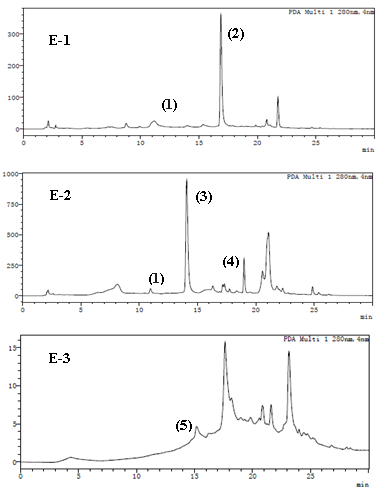
Figure 5. Reversed phase high-performance liquid chromatography (RP-HPLC) analysis (detected at 280 nm) four fractions (E1, E2, E3) of E-Amps separated with stepwise gradient by Sephadex LH-20.
Table 3. LC-IT-TOF/MS/MS data of E1, E2 and E3
|
Peak |
RT (min) |
[M-H]— (m/z) |
Product ions (m/z) |
mDP of procyanidins |
|
|
1 |
11.17 |
289 |
203, 821 |
monomer |
E(C) |
|
2 |
16.87 |
289 |
151, 179 |
monomer |
E(C) |
|
3 |
14.07 |
577 |
251, 301, 407 |
dimer |
E(C)-E(C) |
|
4 |
21.09 |
577 |
245, 281, 289, 407, 559 |
dimer |
E(C)-E(C) |
|
5 |
15.19 |
865 |
289, 407, 695 |
trimer |
E(C)-E(C)-E(C) |
3.5 NMR analysis
3.5.1 (+)- Catechin [C]
Compound 1 was obtained as a yellow amorphous powder. IT/TOF MS gave [M–H]- at m/z 289. 1H NMR (500 MHz, DMSO): δH 4.48 (1H, d, J=9.5 Hz, H-2), 3.82 (1H, m, H-3), 2.26 (1H, dd, J=6.5, 20 Hz, H-4a), 2.51 (1H, m, H-4b), 5.89 (1H, brs, H-6), 5.69 (1H, brs, H-8), 6.73 (1H, d, J=2.5 Hz, H-2’), 6.79 (1H, d, J=8.05 Hz, H-5’), 6.60 (1H, dd, J=2.5, 10 Hz, H-6’). 13C NMR (500 MHz, DMSO): δC 81.47 (C-2), 66.77 (C-3), 28.34 (C-4), 99.51 (C-4a), 155.82 (C-5), 95.56 (C-6), 156.63 (C-7), 94.29 (C-8), 156.92 (C-8a), 131.06 (C-1’), 114.99 (C-2’), 145.30 (C-3’), 145.30 (C-4’), 115.52 (C-5’), 118.87 (C-6’). The 1H and 13C NMR spectral data were agreement with those of TIMO STARK et al.(Stark et al., 2005).
3.5.2 (‒)- Epicatechin [EC]
Compound 2 was obtained as a yellow amorphous powder. IT/TOF MS gave [M–H]- at m/z 289. 1H NMR (500 MHz, DMSO): δH 4.48 (1H, d, J=2.5 Hz, H-2), 4.02 (1H, m, H-3), 2.69 (1H, dd, J=5.5, 20.5 Hz, H-4a), 2.51 (1H, m, H-4b), 5.90 (1H, d, J=3 Hz, H-6), 5.73 (1H, J=3 Hz, H-8), 6.90 (1H, brs, H-2’), 6.79 (1H, d, J=8.1 Hz, H-5’), 6.60 (1H, m, H-6’). 13C NMR (500 MHz, DMSO): δC 78.53 (C-2), 65.38 (C-3), 28.67 (C-4), 99.96 (C-4a), 156.24 (C-5), 95.54 (C-6), 156.70 (C-7), 94.55 (C-8), 156.99 (C-8a), 131.08 (C-1’), 115.22 (C-2’), 144.91 (C-3’), 144.97 (C-4’), 115.36 (C-5’), 118.42 (C-6’). The 1H and 13C NMR spectral data were agreement with those of J. Bicker et al.(Bicker et al., 2009).
3.5.3 Procyanidin B2 [EC-(4β→8)-EC]
Compound 3 was obtained as a deep yellow amorphous powder. IT/TOF MS gave [M–H]- at m/z 577. 1H NMR (500 MHz, DMSO), upper unit: δH 4.29-4.35 (2H, m, H-2, H-4), 3.64 (1H, d, J=5 Hz, H-3), 6.80 (2H, brs, H-5’, H-2’); Terminal unit: δH 4.45 (1H, s, H-2), 3.45 (1H, q, J=10 Hz, H-3), 2.58 (1H, d, J=20 Hz, H-4a), 2.71 (1H, dd, J=20, 5.5 Hz, H-4b), 6.52 (1H, d, J=10 Hz, H-6’’), 7.00 (1H, s, H-5’’). 5.72-5.82 (3H, m, 2H-6, 1H-8), 6.63 (2H, t, J=12 Hz, H-6’, H-2’’). 13C NMR (500 MHz, DMSO),upper unit: δC 75.83 (C-2), 71.92 (C-3), 36.11 (C-4), 102.36 (C-4a), 156.35 (C-5), 96.28 (C-6), 157.03 (C-7), 94.23 (C-8), 157.07 (C-8a), 131.69 (C-1’), 115.35 (C-2’), 145.05 (C-3’), 144.69 (C-4’), 115.18 (C-5’), 118.22 (C-6’); Terminal unit: δC 77.98 (C-2), 65.13 (C-3), 28.04 (C-4), 99.20 (C-4a), 154.93 (C-5), 95.05 (C-6), 154.33 (C-7), 107.57 (C-8), 153.39 (C-8a), 130.75 (C-1’), 115.35 (C-2’), 144.78 (C-3’), 144.50 (C-4’), 114.90 (C-5’), 118.22 (C-6’). The 1H and 13C NMR spectral data were agreement with those of F. Khallouki et al.(Khallouki et al., 2007).
3.5.4 Procyanidin B1 [EC-(4β→8)-C]
Compound 4 was obtained as a deep yellow amorphous powder. IT/TOF MS gave [M–H]- at m/z 577. 1H NMR (500 MHz, DMSO), upper unit: δH 4.29-4.41 (2H, m, H-2, H-4), 3.61 (1H, m, H-3), 6.63 (2H, brs, H-5’, H-2’); Terminal unit: δH 5.02 (1H, s, H-2), 3.44 (1H, dd, J=5,15 Hz, H-3), 2.5 (2H, m, H-4a, H-4b), 6.53 (1H, d, J=10 Hz, H-6’’), 6.75 (1H, s, H-5’’). 5.70-5.79 (3H, m, 2H-6, 1H-8), 6.8 (2H, s, H-6’, H-2’’). 13C NMR (500 MHz, DMSO),upper unit: δC 75.88 (C-2), 71.64 (C-3), 35.72 (C-4), 102.60 (C-4a), 156.19 (C-5), 96.14 (C-6), 156.95 (C-7), 94.15 (C-8), 157.05 (C-8a), 131.84 (C-1’), 115.30 (C-2’), 145.13 (C-3’), 144.83 (C-4’), 115.61 (C-5’), 118.17 (C-6’); Terminal unit: δC 80.55 (C-2), 66.48 (C-3), 26.58 (C-4), 99.01 (C-4a), 154.91 (C-5), 94.96 (C-6), 154.12 (C-7), 107.57 (C-8), 153.01 (C-8a), 131.57 (C-1’), 115.19 (C-2’), 145.04 (C-3’), 144.64 (C-4’), 114.10 (C-5’), 118.17 (C-6’). The 1H and 13C NMR spectral data were consistent with those of Tuba Esatbeyoglu et al.(Esatbeyoglu et al., 2011).
3.5.5 Procyanidin C1 [EC-(4β→8)-EC- (4β→8)-EC ]
Compound 5 was obtained as a deep yellow amorphous powder. IT/TOF MS gave [M–H]- at m/z 865. 1H NMR (500 MHz, DMSO), upper unit: δH 5.02 (1H, s, H-2), 4.42 (1H, brs, H-3), 5.83 (2H, s, H-6, H-8), 6.84 (1H, s, H-2’), 6.64 (2H, m, H-5’, H-6’); Middle unit: δH 4.94 (1H, s, H-2), 4.15 (1H, brs, H-3), 6.90 (1H, s, H-2’), 6.66 (1H, m, H-5’), 6.55 (1H, d, J=10 Hz, H-6’); Terminal unit: δH 4.70 (1H, d, J=5 Hz, H-2), 3.45 (1H, m, H-3), 2.45 (1H, dd, J=3.5, 20 Hz, H-4a), 2.75 (1H, m, H-4b), 7.04 (1H, s, H-2’), 6.73 (1H, d, J=10 Hz, H-5’), 6.82 (1H, m, H-6’). 4.55 (2H, d, J=5 Hz, H4), 5.76 (2H, s, H6). 13C NMR (500 MHz, DMSO), upper unit: δC 77.96 (C-2), 70.98 (C-3), 28.37 (C-4), 99.39 (C-4a), 156.38 (C-5), 96.43 (C-6), 156.43 (C-7), 106.86 (C-8), 154.49 (C-8a), 131.55 (C-1’), 114.83 (C-2’), 145.03 (C-3’), 144.58 (C-4’), 115.54 (C-5’), 118.07 (C-6’); Middle unit: δC 75.82 (C-2), 71.01 (C-3), 36.30 (C-4), 99.64 (C-4a), 154.95 (C-5), 96.38 (C-6), 156.98 (C-7), 106.84 (C-8), 154.83 (C-8a), 131.80 (C-1’), 114.83 (C-2’), 145.03 (C-3’), 144.50 (C-4’), 115.43 (C-5’), 118.03 (C-6’). Terminal unit: δC 75.82 (C-2), 71.88 (C-3), 35.93 (C-4), 99.44 (C-4a), 157.06 (C-5), 96.03 (C-6), 157.09 (C-7), 95.22 (C-8), 157.03 (C-8a), 130.90 (C-1’), 114.83 (C-2’), 144.88 (C-3’), 144.39 (C-4’), 115.24 (C-5’), 118.08 (C-6’). The 1H and 13C NMR spectral data were consistent with those of Chiaki Ito et al.(Ito et al., 2013).
3.6 Antioxidant activities of Amps
Several studies have shown that the procyanidins from many plant sources, including Chinese hawthorn (Chai et al., 2014), indigenous cinnamon (Lin et al., 2016) and Ficus altissima leaves (Deng et al., 2016), were tested by antioxidant activities assays. Previous studies also found that in different antioxidant experiments, the antioxidant capacity is quite discrepant due to the different DP of procyanidins. Antioxidant effectiveness cannot be simply attributed to the ability of donating hydrogen via phenolic hydroxyls (Plumb et al., 1998). Some studies have shown that antioxidant activity is enhanced with the increasing DP. However, some studies have drawn the opposite conclusion (Santos Buelga and Scalbert, 2000). In addition, Nicole Darmon et al. reported that the antioxidant capacity of procyanidins shows no difference between monomers, dimers and trimers (Silva et al., 1991). To explore the antioxidant activity with different DP, we measured the FRAP, DPPH, and ABTS radical scavenging activities of procyanidins from Aronia berries.
Figures 6 (A, B) show that five compounds (1, 2, 3, 4, 5) could eliminate DPPH and ABTS free radicals in a dose-dependent manner. The flavan-3-ol monomers (catechin and epicatechin) had a higher DPPH free radical scavenging capacity than the dimeric procyanidins (procyanidin B1, B2) and the trimeric procyanidin (procyanidin C1) at 0.1–0.15 mg/mL. With the increasing sample concentrations, epicatechin exhibited the largest DPPH free radical scavenging capacity.
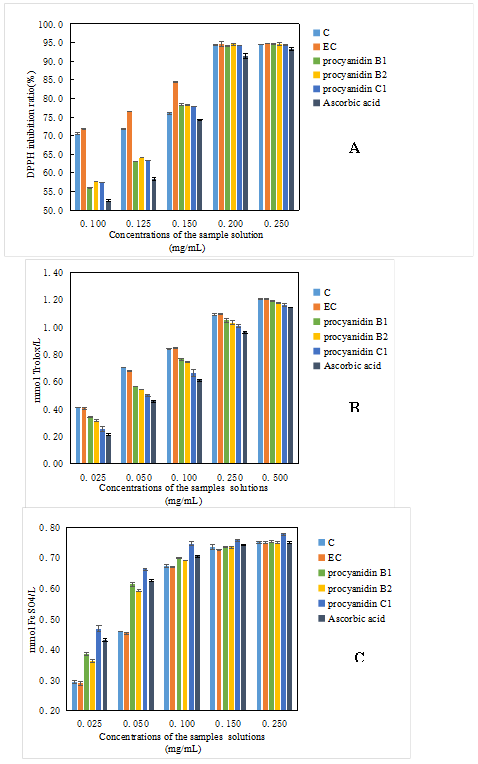
Figure 6. A: DPPH radical scavenging capacity; B: ABTS radical scavenging capacity; C: Ferric reducing antioxidant power (FRAP)
When the concentration of each sample reached 0.2–0.25 mg/mL, the DPPH free radical scavenging capacity was equal to approximately 93% for the five compounds. Moreover, the dimeric and trimeric procyanidins showed nearly no difference in the scavenging ability of DPPH free radicals with the increasing concentration. In addition, at the same concentration, the DPPH free radical scavenging activity of flavan-3-ol monomers and oligomeric procyanidins were stronger than that of ascorbic acid, thereby exhibiting the powerful antioxidant capacity of procyanidins. Similarly, the ABTS free radical scavenging experiment also manifested that ascorbic acid had a weaker antioxidant capacity than flavan-3-ol monomers and oligomeric procyanidins at the same concentration. Moreover, flavan-3-ol monomers had a stronger antioxidant capacity than dimeric and trimeric procyanidins. The ABTS free radical scavenging capacity of procyanidins B1 was higher than that of procyanidins B2, but the difference was insignificant. Procyanidin C1 could also scavenge.
ABTS free radicals, slightly lower than dimeric procyanidins. Therefore, the DPPH and ABTS free radical scavenging abilities were ranked as follows: flavan-3-ol monomers > trimeric procyanidins > trimeric procyanidins > ascorbic acid. The five compounds were dose-dependent on the scavenging ability of the DPPH and ABTS free radicals. The experimental results illustrated that the antioxidant capacity of procyanidins was related to the DP. However, in the FRAP assay, the FRAP values of the five compounds indicated that procyanidins C1 had the highest ferric reducing antioxidant power. The ferric reducing antioxidant power of trimeric procyanidins was weaker than that of procyanidins C1, and flavan-3-ol monomers had the weakest ferric reducing antioxidant power. In addition, the FRAP values of ascorbic acid were greater than those of flavan-3-ol monomers and trimeric procyanidins but less than that of trimeric procyanidins at 0.025–0.1 mg/mL. When the concentration was between 0.1 and 0.25 mg/mL, the FRAP value of ascorbic acid was not significantly different from those of flavan-3-ol monomers and trimeric procyanidins, but it was still lower than that of trimeric procyanidins. The FRAP values of the five samples were opposite to those in the DPPH and ABTS free radical scavenging experiment. Flavonoids are known to mainly react with free radicals through phenolic hydroxyl groups to achieve antioxidant effects. That is, antioxidant effects are gradually enhanced with the increase of the number of phenolic hydroxyl groups, which explains the FRAP values for the different DP of procyanidins. However, the antioxidant activity depends not only on the number of phenolic hydroxyl groups, but also on the different structural properties and steric configuration (Chen et al., 2016). Therefore, it may be the reason that DPPH and ABTS free radical scavenging ability are different from the FRAP values for the different DP of procyanidins.
To sum up, the scavenging ability of the DPPH and ABTS free radicals decreased with the increasing of DP. However, the FRAP values increased with the DP. The results of all the above assays indicated that all flavan-3-ol monomers and oligomeric procyanidins have strong antioxidant capacities. The comparison with previous studies indicated that the antioxidant activity of procyanidins from Aronia berries was better than those of several procyanidins extracts (Neilson et al., 2016).
In summary, we have investigated the specific procyanidins structure information of Aronia melanocarpa berries and researched the relationship between each flavan-3-ol monomers and oligomeric procyanidin of different DP (DP 1, DP 2, DP 3, etc.) and their antioxidant properties. Overall, we hypothesized that Amps could be applied to a promising functional food component.
The present investigation was supported by the National Natural Science Foundation of China (31471593), the national key research and development program of China (2016YFD0400302-4) and the forestry public welfare industry research special funds (201504606).
Author Contributions
Aidong Sun, Yue Zhu and Yulong Wei conceived and designed the experiments. Yue Zhu performed the experiments. Yanan Hou, Jiaying Zhang and Nan Zhang analyzed the data. Yuqing Lei, Zhilin Gan and Yue Zhu wrote the paper.
Benzie, I. F. F., and J. J. Strain. 1996. The Ferric Reducing Ability of Plasma (FRAP) as a Measure of "Antioxidant Power" : The FRAP Assay. Anal Biochem 239(0292):70-76. PMid:8660627
View Article PubMed/NCBIBicker, J., F. Petereit, and A. Hensel. 2009. Proanthocyanidins and a phloroglucinol derivative from Rumex acetosa L. Fitoterapia 80(8):483-495. PMid:19695312
View Article PubMed/NCBIBrand-Williams, W., M. E. Cuvelier, and C. Berset. 1995. Use of a Free Radical Method to Evaluate Antioxidant Activity. LEBENSMITTEL-WISSENSCHAFT UND-TECHNOLOGIE-FOOD SCIENCE AND TECHNOLOGY 28(1):25-30. 80008-5
View ArticleChai, W., C. Chen, Y. Gao, H. Feng, Y. Ding, Y. Shi, H. Zhou, and Q. Chen. 2014. Structural Analysis of Proanthocyanidins Isolated from Fruit Stone of Chinese Hawthorn with Potent Antityrosinase and Antioxidant Activity. J Agr Food Chem 62(1):123-129. PMid:24313351
View Article PubMed/NCBIChai, W., M. Lin, H. Feng, Z. Zou, and Y. Wang. 2017. Proanthocyanidins purified from fruit pericarp of Clausena lansium (Lour.) Skeels as efficient tyrosinase inhibitors: structure evaluation, inhibitory activity and molecular mechanism. Food Funct 8(3):1043-1051. PMid:28128839
View Article PubMed/NCBIChai, W., Y. Shi, H. Feng, L. Qiu, H. Zhou, Z. Deng, C. Yan, and Q. Chen. 2012. NMR, HPLC-ESI-MS, and MALDI-TOF MS Analysis of Condensed Tannins fromDelonix regia. (Bojer ex Hook.) Raf. and Their Bioactivities. J Agr Food Chem 60(19):5013-5022. PMid:22515734
View Article PubMed/NCBIChen, J., Z. Xu, W. Zhu, R. Nie, and C. Li. 2016. Novel proanthocyanidin dimer analogues with the C-ring-opened diaryl-propan-2-gallate structural unit and enhanced antioxidant activities. J Funct Foods 21:290-300.
View ArticleChen, X., H. Feng, Y. Ding, W. Chai, Z. Xiang, Y. Shi, and Q. Chen. 2014. Structure characterization of proanthocyanidins from Caryota ochlandra Hance and their bioactivities. Food Chem 155:1-8. PMid:24594146
View Article PubMed/NCBIDeng, Y., G. Liang, Y. Shi, H. Li, J. Zhang, X. Mao, Q. Fu, W. Peng, Q. Chen, and D. Shen. 2016. Condensed tannins from Ficus altissima leaves: Structural, antioxidant, and antityrosinase properties. Process Biochem 51(8):1092-1099.
View ArticleEsatbeyoglu, T., B. Jaschok-Kentner, V. Wray, and P. Winterhalter. 2011. Structure Elucidation of Procyanidin Oligomers by Low-Temperature 1H NMR Spectroscopy. J Agr Food Chem 59(1):62-69. PMid:21141823
View Article PubMed/NCBIEsatbeyoglu, T., and P. Winterhalter. 2010. Preparation of Dimeric Procyanidins B1, B2, B5, and B7 from a Polymeric Procyanidin Fraction of Black Chokeberry (Aronia melanocarpa). J Agr Food Chem 58(8):4147-5153. PMid:20196608
View Article PubMed/NCBIFOO, L. Y. 1981. PROANTHOCYANIDINS: GROSS CHEMICAL STRUCTURES BY INFRA- RED SPECTRA. Phytochemist 20(6):1397-1402. 80047-7
View ArticleFriedrich, W., A. Eberhardt, and R. Galensa. 2000. Investigation of proanthocyanidins by HPLC with electrospray ionization mass spectrometry. Eur Food Res Technol 211(1):56-64.
View ArticleFu, C., X. Yang, S. Lai, C. Liu, S. Huang, and H. Yang. 2015. Structure, antioxidant and α-amylase inhibitory activities of longan pericarp proanthocyanidins. J Funct Foods 14:23-32.
View ArticleFu, C., and D. Yang. 2015. Structure and Antioxidant Activities of Proanthocyanidins from Elephant Apple (Dillenia indica Linn.). J Food Sci 80(10):2191-2199. PMid:26416622
View Article PubMed/NCBIHandeland, M., N. Grude, T. Torp, and R. Slimestad. 2014. Black chokeberry juice (Aronia melanocarpa) reduces incidences of urinary tract infection among nursing home residents in the long term—a pilot study. Nutr Res 34(6):518-525. PMid:25026919
View Article PubMed/NCBIHellstrom, J. K., A. R. Torronen, and P. H. Mattila. 2009. Proanthocyanidins in Common Food Products of Plant Origin. J Agr Food Chem 57(17):7899-7906. PMid:19722709
View Article PubMed/NCBIHuang, P., C. Chi, and T. Liu. 2010. Effects of Areca catechu L. containing procyanidins on cyclooxygenase-2 expression in vitro and in vivo. Food Chem Toxicol 48(1):306-313. PMid:19840828
View Article PubMed/NCBIHuang, P., C. Chi, and T. Liu. 2010. Effects of Areca catechu L. containing procyanidins on cyclooxygenase-2 expression in vitro and in vivo. Food Chem Toxicol 48(1):306-313. PMid:19840828
View Article PubMed/NCBIIsmayati, M., A. Nakagawa-izumi, and H. Ohi. 2017. Structural elucidation of condensed tannin from the bark waste of Acacia crassicarpa plantation wood in Indonesia. J Wood Sci 63(4):350-359.
View ArticleIto, C., T. Oki, T. Yoshida, F. Nanba, K. Yamada, and T. Toda. 2013. Characterisation of proanthocyanidins from black soybeans: Isolation and characterisation of proanthocyanidin oligomers from black soybean seed coats. Food Chem 141(3):2507-2512. PMid:23870988
View Article PubMed/NCBIJing, L.( 2014). Study on Extration, Separation Process and Antioxidan Activity of Procyanidins from Blueberry (Vaccinium ashei Reade) Leaves. Fujian, Fujian Agriculture &Forestry University. Master: 86.
Jurikova, T., J. Mlcek, S. Skrovankova, D. Sumczynski, J. Sochor, I. Hlavacova, L. Snopek, and J. Orsavova. 2017. Fruits of Black Chokeberry Aronia melanocarpa in the Prevention of Chronic Diseases. Molecules 22(6):944. PMid:28590446 PMCid:PMC6152740
View Article PubMed/NCBIKang, M., Y. Seong, M. Kim, M. S. Kim, and J. Pyun. 2017. Analysis of Polymer Characteristics Using Matrix-assisted Laser Desorption/Ionization Time-of-flight Mass Spectrometry. Applied Chemistry for Engineering 28(3):263-271.
Karonen, M., J. Loponen, V. Ossipov, and K. Pihlaja. 2004. Analysis of procyanidins in pine bark with reversed-phase and normal-phase high-performance liquid chromatography–electrospray ionization mass spectrometry. Anal Chim Acta 522(1):105-112.
View ArticleKhallouki, F., R. Haubner, W. E. Hull, G. Erben, B. Spiegelhalder, H. Bartsch, and R. W. Owen. 2007. Isolation, purification and identification of ellagic acid derivatives, catechins, and procyanidins from the root bark of Anisophyllea dichostyla R. Br. Food Chem Toxicol 45(3):472-485. PMid:17084499
View Article PubMed/NCBIKim, Y., Y. Choi, H. Ham, H. Jeong, and J. Lee. 2013. Protective effects of oligomeric and polymeric procyanidin fractions from defatted grape seeds on tert-butyl hydroperoxide-induced oxidative damage in HepG2 cells. Food Chem 137(1-4):136-141. PMid:23200001
View Article PubMed/NCBIKulling SE, R. H. 2008. Chokeberry (Aronia melanocarpa)–A Review on the Characteristic Components and Potential Health Effects. Planta Med(74):1625-1634. PMid:18937167
View Article PubMed/NCBILin, G., H. Lin, C. Hsu, and S. Chang. 2016. Structural characterization and bioactivity of proanthocyanidins from indigenous cinnamon (Cinnamomum osmophloeum). J Sci Food Agr 96(14):4749-4759. PMid:27185335
View Article PubMed/NCBINatsume, M., N. Osakabe, M. Yamagishi, and T. Takizawa. 2000. Analyses of Polyphenols in Cacao Liquor, Cocoa, and Chocolate by Normal-Phase and Reversed-Phase HPLC. Bioscience Biotechnology and Biochemistry 64(12):2581-2587. PMid:11210120
View Article PubMed/NCBINeilson, A. P., S. F. O'Keefe, and B. W. Bolling. 2016. High-Molecular-Weight Proanthocyanidins in Foods: Overcoming Analytical Challenges in Pursuit of Novel Dietary Bioactive Components. Annu Rev Food Sci Technol 7:43-64. PMid:26735794
View Article PubMed/NCBIPing, L., A. Pizzi, Z. D. Guo, and N. Brosse. 2012. Condensed tannins from grape pomace: Characterization by FTIR and MALDI TOF and production of environment friendly wood adhesive. Ind Crop Prod 40:13-20.
View ArticlePlumb, G. W., S. De Pascual-Teresa, C. Santos-Buelga, and V. Cheynier. 1998. Antioxidant Properties of Catechins and Proanthocyanidins: Effect of Polymerisation, Galloylation and Glycosylation. Free Radical Biology & Medicine 29:351-358.
View ArticleSantos Buelga, C., and A. Scalbert. 2000. Proanthocyanidins and tannin‐like compounds – nature, occurrence, dietary intake and effects on nutrition and health. J Sci Food Agr 80(7):1094-1117. 1097-0010(20000515)80:7<1094::AID-JSFA569>3.0.CO;2-1
View ArticleSilva, J. M. R. D., N. Darmon, and Y. Fernandez. 1991. Oxygen Free Radical Scavenger Capacity in Aqueous Models of Different Procyanidins from Grape Seeds. J Agr Food Chem 39:1549-1552.
View ArticleSójka, M., K. Kołodziejczyk, and J. Milala. 2013. Polyphenolic and basic chemical composition of black chokeberry industrial by-products. Ind Crop Prod 51:77-86.
View ArticleStark, T., S. Bareuther, and T. Hofmann. 2005. Sensory-Guided Decomposition of Roasted Cocoa Nibs (Theobroma cacao) and Structure Determination of Taste-Active Polyphenols. J Agr Food Chem 53(13):5407-5418. PMid:15969527
View Article PubMed/NCBISui, Y., Y. Zheng, X. Li, S. Li, B. Xie, and Z. Sun. 2016. Characterization and preparation of oligomeric procyanidins from Litchi chinensis pericarp. Fitoterapia 112:168-174. PMid:27282208
View Article PubMed/NCBIThompson, R. S., D. Jacques, and E. Haslam. 1972. Plant Proanthocyanidins. Part 1. Introduction; the Isolation, Structure, and Distribution in Nature of Plant Procyanidins. Journal of the Chemical Society, Perkin Transactions 1:1387-1399.
View ArticleValcheva, S., K. Kuzmanova, V. Mihova, I. Krasnaliev, P. BORISOVA, and A. BELCHEVA. 2007. Antihyperlipidemic Effect of Aronia melanocarpa Fruit Juice in Rats Fed a High-Cholesterol Diet. Plant Food Hum Nutr 62(1):19-24. PMid:17136466
View Article PubMed/NCBIVan Huynh, A., and J. Bevington. 2014. MALDI-TOF MS Analysis of Proanthocyanidins in Two Lowland Tropical Forest Species of Cecropia: A First Look at Their Chemical Structures. Molecules 19(9):14484-14495. PMid:25221870
View Article PubMed/NCBIWei, J., G. Zhang, X. Zhang, D. Xu, J. Gao, J. Fan, and Z. Zhou. 2017. Anthocyanins from Black Chokeberry (Aronia melanocarpa Elliot) Delayed Aging-Related Degenerative Changes of Brain. J Agr Food Chem 65(29):5973-5984. PMid:28657734
View Article PubMed/NCBIWu, X., L. Gu, R. L. Prior, and S. McKay. 2004. Characterization of Anthocyanins and Proanthocyanidins in Some Cultivars of Ribes, Aronia, and Sambucus and Their Antioxidant Capacity. J Agr Food Chem 52(26):7846-7856. PMid:15612766
View Article PubMed/NCBIYue, Z., and L. Fen Mei. 2017. Extraction and antibacterial activity of procyanidins from Aronia melanocarpa. Science and technology of Food Industry 38(02):302-306.
Zapolska-Downar, D., D. Bryk, M. Małecki, K. Hajdukiewicz, and D. Sitkiewicz. 2012. Aronia melanocarpa fruit extract exhibits anti-inflammatory activity in human aortic endothelial cells. Eur J Nutr 51(5):563-572. PMid:21863241 PMCid:PMC3397226
View Article PubMed/NCBIZhang, L. L., and Y. M. Lin. 2008. HPLC, NMR and MALDI-TOF MS Analysis of Condensed Tannins from Lithocarpus glaber Leaves with Potent Free Radical Scavenging Activity. Molecules 13(12):2986-2997. PMid:19052523
View Article PubMed/NCBIZhang, Y., X. Zhou, W. Tao, L. Li, C. Wei, J. Duan, S. Chen, and X. Ye. 2016. Antioxidant and antiproliferative activities of proanthocyanidins from Chinese bayberry (Myrica rubra Sieb. et Zucc.) leaves. J Funct Foods 27:645-654.
View Article