Fiorella Sarubbi
Email: fiorella.sarubbi@cnr.it
© 2019 Sift Desk Journals. All Rights Reserved
VOLUME: 3 ISSUE: 1
Page No: 241-246
Fiorella Sarubbi
Email: fiorella.sarubbi@cnr.it
Assunta Arrichielloa, Elio Pizzob, Raffaele Palombaa, Giuseppe Auriemmaa, Fiorella Sarubbia*
aInstitute for Animal Production System in Mediterranean Environment, National Research Council, Via Argine 1085, 80147, Naples, Italy
b 2 Department of Biology, University of Naples "Federico II, Via Cinthia 1, 80126, Naples, Italy
Xin Gao(bestgaoxin@nwsuaf.edu.cn)
Johannes Frueh(Johannes.frueh@hit.edu.cn)
Chunya Li(lichychem@163.com)
Anna C Croce(croce@igm.cnr.it)
Fiorella Sarubbi.,et al., Near infrared reflectance spectroscopy of pasticceria foodstuff as protein content predicting method(2018)SDRP Journal of Food Science & Technology 3(1)
Background: The authors evaluated the potential of NIR spectroscopy for the analysis of protein of pasticceria food, and it have analyzed 120 samples.
Methods: Protein content reference was obtained by standard lab procedure. The authors used spectra and reference data, partial least squares regression analysis that was applied to calculate a NIR method model (n=120), divided into calibration (n=84) and validation (n=36), to predict protein content in fed.
Results: The study shows that using NIR technique spectra and using PLS regression, a model could be developed having a root mean square standard error of performance of R2 value of 0.81. The regression coefficients show that analytically useful absorptions for the original PLS model are between 4000 and 4500nm.
Conclusion: a NIR model was developed for the prediction of protein in pasticceria products, which is sufficiently accurate for screening samples. Screening can be accomplished rapidly without the use of chemicals.
Keywords: NIR; food; protein content.
During the last years, there has been a lot of emphasis on the quality and safety about food products, production processes, and relationship between them (Burns and Ciurczak, 2001). In the food industry, food safety and quality are still pursued as an important issue all over the world, being directly related to people's health and social progress. The attention of consumers is gradually improving toward quality seals and trust marks of food products, expecting manufacturers and retailers to provide products of higher quality. The human nutritionists have long recognized the importance of measuring nutritive value of food products (Stuth et al., 2003). The protein content of food products is an important aspect of consumer food choices, and is required in several countries for nutrition labeling and monitoring (Shengfeng et al. 2011; Kiesel et al. 2011). Various analytical chemistry techniques to quantify such food quality parameters, as protein, energy, or mineral content, are well established, though sometimes they can appear costly and time consuming (Stuth et al., 2003). In practice, to satisfy the demands it can be highly suitable to develop a fast and efficient method – such as NIRS technology – to undertake the food quality ascertainment. The analysis of foods quality is often carried out with standard chemical analyses (e.g. the Kjeldahl extraction method; Pritchard & Robbins 1990, Gad & Shyama 2011). These qualitative methods are very valuable in ecological research, but are relatively expensive and time consuming, as well as technically relatively challenging (Givens & Deaville 1999, Dixon & Coates 2009).
The increased power and widespread use of personal computers, as well as the concomitant development of multivariate statistical procedures in the field of chemo metrics, have resulted in an increased use of near infrared reflectance spectroscopy (NIRS) as an alternative to traditional analytical methods for determining nutritive value of forages (Stuth et al., 2003).
NIRS is a nondestructive, fast, accurate and inexpensive technique to estimate the chemical content and composition of a sample (Cen & He 2007). The interactions (i.e. absorption, reflection or transmittance) between a sample and electromagnetic radiations of given wavelengths can generate a ’spectral signature’, which can be recorded by a spectrometer. By combining reference samples of known content and multivariate statistics, spectral signatures can be used to identify and predict certain characteristics of the analytic (Næs et al. 2001). When applied to the 700 at 2.500 nm region of the electromagnetic spectrum, this method is referred to as NIRS (Cen & He 2007). There are other advantages of NIRS over conventional laboratory analytical methods, namely: (1) it is non-destructive; (2) it requires no reagents; and (3) it allows the determination of multiple values (e.g. crude protein (CP), digestible organic matter (DOM), acid detergent fiber (ADF), neutral detergent fiber (NDF) etc.) in a single analytical process (Stuth et al., 2003).
Calibration is the process of creating a spectrochemical prediction model (Shenk and Westerhaus, 1996). The process essentially relates the information contained in the spectral properties of a substance to chemical (or physical) information acquired by reference laboratory methods. The goal is to derive a predictive equation allowing the user to quantify the constituent of interest using NIRS alone, bypassing the laboratory reference method.
Calibration consists of both physical and electronic steps. The process begins by obtaining a sample set of the desired material. The calibration set should be well distributed, representing the range of expected variation in the constituent of interest. This variation could be (a) temporal, e.g. date or time of collection; (b) spatial, e.g. range site or geographic location; or (c) biological. Processing of the calibration set for NIRS should be consistent with the methods to be used in routine analysis. Drying and grinding procedures are especially important, as water is a strong absorber of NIR light, and particle size affects the shape of the spectrum. As reported by Pasikatan et al. (2001) an accident with NIR beam on a dusty or granular material of a weakly absorbing medium. Thick enough to prevent the transmission from penetrating the layer and its direction will be changed every time a particle limit is encountered, so it was decided to standardize the particle size of 1.1 mm, in order to make the results stable and comparative analysis, according to the official AOAC, which provides for the milling to 1.1 mm. NIR spectra are also influenced by environmental conditions, which should be as uniform as possible with respect to the temperature (Stuth et al., 2003).
Once spectra and laboratory reference data are acquired and matched, mathematical and statistical procedures are performed. Data pre-treatment steps, such as multiplicative scatter corrections (Martens and Naes, 1991) or detrending and standard normal variate transformations (Barnes et al., 1989) reduce the effect of particle size (scatter) on the calibration set. The effects of baseline shifts and overlapping absorption bands can be removed by calculating derivatives of the spectra (Hruschka, 1987). Many multivariate regression procedures have been developed and applied to spectral data. Two general categories involve either utilizing data from (a) individual wavelengths, usually by stepwise regression; or (b) the full spectrum (or any user-defined segment), by the use of some form of principal components (Shenk and Westerhaus, 1991).
The present study was conducted to investigate the potential of NIR spectroscopy for the analysis of protein in a data set that included products consumption as confectionery food.
Samples of pasticceria foodstuff were purchased from retail stores and selected so that the model would be robust in the range of products available on the marketplace. The samples were represented by donuts and puff pastry, filled with chocolate or cream and not. Regardless of the filling, the drying and subsequent grinding have canceled and made the sample itself homogeneous. After collection, samples were dried at 105 °C in a controlled oven until the moisture content reaches the 5%, then stored dry in a closed container at room temperature until further processing. For further analysis, each sample was milled in a grinder (particle size, 1.1 mm) and subdivided into a reference sample and a prediction sample. Standard lab procedures (Kjeldhal – AOAC Method n. 920.53) were used to obtain measures of protein content from each reference sample.
Near-infrared spectra were obtained using a Buchi Instruments Inc model NIRFlex N-500. The instrument has silicon and InGaAs diode arrays and an intense broadband light source, making it possible to measure reflectance from a large area of the sample surface (in a container of approximately 10 cm in diameter). The diodes were centered at 10 nm intervals but a software was used to spline–interpolate spectra to a data interval of 5 nm. The two spectral ranges of the instrument are spliced at 950 nm to cover a range from 800 to 2500 nm, these range was choose because many characteristic absorptions of amines fall into the same regions of alcohols because the N-H and O-H bonds are similar to each other. The instrument acquisition time averages 30 spectra s−1 and a spectral scan was defined as the average spectrum generated after 1 s of acquisition.
The system uses the latest version of the NIRWare Software Suite. NIRCal is a powerful chemo metric software package suitable to develop robust NIR methods leading to fast and reliable NIR prediction results. Most of the partial least squares (PLS) regression models were generated from the average spectrum for the first repack. Regression models were also developed from the average spectrum of two, four and eight repacks for each sample to compare the results with the first repack. 120 samples were collected. The reference values for protein contents of pasticceria food, as extracted by the standard chemical laboratory analysis, ranged from 46 to 100 g protein kg-1 and the standard error of the laboratory determinations was 6 g kg-1.
The samples (n=120) were divided into calibration (n=84) and validation (n=36) data sets by ranking the samples in increasing order of protein content and assigning each third sample to the validation data set.
Calibration is the process of creating a spectrochemical prediction model (Shenk and Westerhaus, 1996). In essence, the process relates chemical information contained in the spectral properties of a substance to chemical (or physical) information revealed by reference laboratory methods. The goal is to derive a predictive equation such that the user can quantify the constituent of interest using NIRS alone, bypassing the laboratory reference method. Calibration consists of both physical and electronic steps. The process begins with obtaining a sample set of the desired material. Processing of the calibration set for NIRS should be consistent with the methods to be used in routine analysis. Drying is procedures are especially important due to the fact that water is a strong absorber of NIR light and, particle size affects the shape of the spectrum. Once spectra and laboratory reference data are acquired and matched, mathematical and statistical procedures are performed. The effects of baseline shifts and overlapping absorption bands can be removed by calculating derivatives of the spectra (Hruschka, 1987).
Equation validation was conducted to assess the predictive ability of the selected calibration equation. Validation entails prediction of either an independent set of samples, i.e. from a different population than the calibration set, with known reference values, or removing a certain number of samples from the calibration set, and not using them in the calibration process. The standard error of prediction (SEP) is used to judge the predictive ability of a calibration equation. Cross validation, whereby each sample or a pre-determined proportion of samples is sequentially removed from the calibration set and predicted by an equation developed with the remaining samples is another method of evaluating equation performance. This method has been described as the single best estimate of the predictive capability of an NIRS equation (Shenk and Westerhaus, 1996). It is known that in real life NIRS predictive equations are always a "work in progress", so any point in time validation, of any equation, no matter how robust, could be improved afterwards. Hence, what is reported here is the best at the present. Slope and bias are also important considerations in evaluating equation performance (Williams, 1987), and systematic over- or underestimation of values obtained from reference methods should be avoided. Monitoring and quality control are needed to check both the accuracy of the instrument and the calibration.
The residuum spectra obtained of typical protein contents of pasticceria food are show in figure 1.
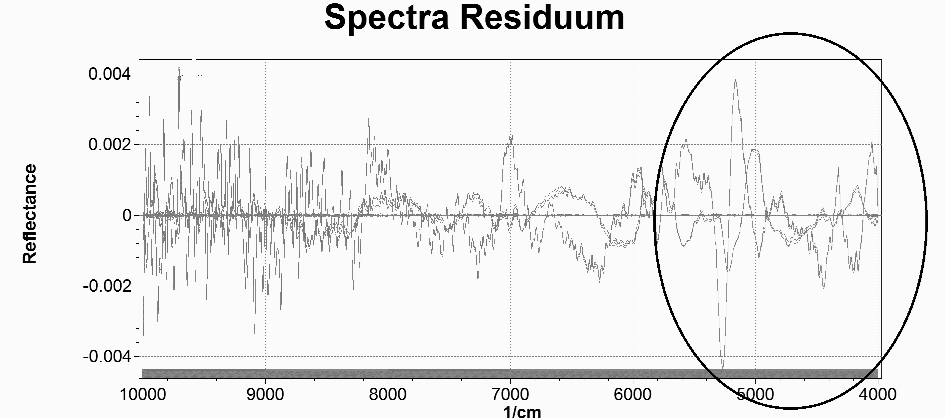
Figure 1 - The spectra residuum (Reflectance vs Wavelengths – 1/cm)
Images of integrated areas under the NIR protein absorbance centered at 4000 and 7200nm and were generated to assess the distribution of protein in pasticceria products. Residual were more concentrated between 4000 – 5000 nm wavelengths. The distribution of spectrum residues confirms the validity of the model, giving a satisfactory normal distribution of errors, the independence of the errors from the values of the independent variable, the homogeneity of error variances and the absence of lever values that may have interfered with the predictive regression.
Calibration and validation statistics for the partial least-squares regression (PLS – Martens et al. 1991) model for the NIR prediction of protein are reported in table 1.
Table 1 - Calibration and validation statistics for PLS regression model
|
Calibration |
Validation |
||||||||
|
n |
Factor |
RMSECV |
R2 |
n |
RMSEP |
R2 |
Bias |
Slope |
RPD |
|
84 |
7 |
0.070 |
0.92 |
36 |
0.10 |
0.81 |
-0.1 |
1.06 |
8.57 |
RMSECV= root means square standard error of cross validation;
RMSEP = root means square standard error of performance;
RPD= standard deviation of the reference method/RMSEP
The PLS was developed by relating the reflectance and the wavelength, show that analytically useful absorptions for the original PLS model (n=84) are between 4000 and 4500nm (Figure. 2).
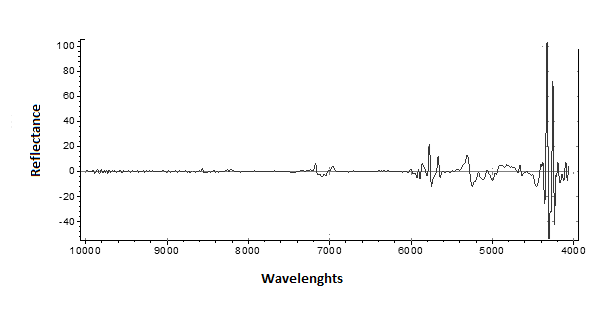
Figure 2 – PLS model (Reflectance vs Wavelengths)
The PLS model has major variation between 4000 and 6000nm, minor variation was over 6000 nm region.
Between 2500-2000 cm-1 are removals related to stretching of triple bonds. They absorb, therefore, to higher wave numbers compared to a double or single bond: this by virtue of the fact that the bond energy, and therefore the k relative to a triple bond, is higher than that of a double bond or a single bond. In this area, we can find related peaks in C≡C (alkynes), C≡N (nitriles), C≡O (carbon monoxide).
In the right area of 1400 cm-1, said fingerprint area (fingerprint), and the area to the left of 1400 cm-1 to 4000 cm-1, said functional groups of the area.
The fingerprint area presents both bands due to stretching vibrations of single bonds, with the exception of C-H bonds due to the small mass of H, both to bending vibrations of groups of atoms and of the molecular skeleton as a whole.
It is not easy to attribute, in this area, a band to a part of molecular structure, however, this area is equally important because the relative spectrum is characteristic of the molecule that is being examined; in fact, two pure substances which have a different spectrum below 1400 cm-1, are definitely different.
To the left of 1,400 cm-1 are found mainly the bands due to stretching of multiple bonds between C, O and N (egg. C = N, C = O, C = C, C≡C, N = O, N = N and C≡N) and this is called the area of functional groups (but there are also some deformation bands related to links between H and C, N, and O), and stretching of single bonds in which the atom is involved in hydrogen (OH, CH, NH) as the reduced mass of these pairs of atoms is small for the presence of H and, consequently, the high-frequency stretching. The bands present in this area resulting from the presence of different functional groups present in the molecule and their position is relatively independent of the overall molecular structure.
It was found that, using this technique to obtain NIR spectra and using PLS regression, a model could be developed having a root mean square standard error of performance of 10 g kg−1 and R2 value of 0.81. Based on these statistics and an RPD of 8.87, the method is suitable for screening purposes and has utility for monitoring protein content in large quantities of pasticceria food products very rapidly without sample preparation. More accurate reference analysis can then be used for samples not in compliance with labelling or not agreeing with expected composition. A prior model constructed for prediction of total protein content in these products required 6–7 repacks of the sample to be averaged to obtain optimum model performance. This may be attributed to heterogeneity of the samples due to large differences in particle sizes within and between products and the variation in shapes of individual sample units.
From the results obtained, it would be possible to evaluate the possibility of applying other ranges of wavelengths, as reported in a study carried out by Frueh et al. (2013) as Might NIR-ATR in order to improve the eventually precision of quantification of crude protein content in the analyzed products.
The classic measurements of proteins by the AOAC methods require time and involve the use of solvents that must, then, also be disposed of, as special waste.
NIR spectroscopy is rapid and does not produce special toxic waste, therefore it is studied as a possible screening method for the study of protein content. The current study aims to develop a model for predicting protein content in confectionery foods to enable more effective screening. To facilitate this, the instrument used was a rapid-scan series diode spectrometer equipped with a custom-made hopper to enable rapid sample delivery for scanning. In the current study, the averaging of additional repacks did not improve performance of the model to predict protein content.
In conclusion, a near-infrared reflectance model was developed for the prediction of protein in intact pasticceria products, which is sufficiently accurate for screening samples. Screening can be accomplished rapidly without the need for repacking the sample and without the use of chemicals and the need to dispose of them.
Author's contributions
We are grateful to Mr. Giuseppe Grazioli for his technical support.
Association of officinal Analytical Chemistry, Method 920.53 in AOAC, Officinal Method of Analysis
Barnes RJ, Dhanoa MS, Lister SJ. (1989) Standard normal variate transformation and de-trending of near-infrared diffuse reflectance spectra. Applied Spectroscopy. ;43:772–777.
View ArticleBurms, D.A. & Ciurczak E.W. (2001). Handbook of Nir-Infrared Analysis. Second Edition. Revised and expanded. Tylor and Francis Group United State of America.
Cen, H. & He, Y. (2007) Theory and application of near infrared reflectance spectroscopy in determination of food quality. - Trends in Food Science & Technology 18: 72-83
View ArticleDixon, R. & Coates, D. (2009) Review: Near infrared spectroscopy of faeces to evaluate the nutrition and physiology of herbivores. - Journal of Near Infrared Spectroscopy 17: 1-31
View ArticleFrueh, J., Reiter G., Keller J., Möhwald H., He Q., Krastev R., Effect of linear elongation of PDMS supported polyelectrolyte multilayer determined by attenuated total reflectance IR radiation, J Phys Chem B. 117 (2013) 2918–2925. doi:10.1021/jp310727f.
View ArticleGad, S.D. & Shyama, S.K. (2011). Diet Composition and Quality in Indian Bison (Bos gaurus) Based on Fecal Analysis. - Zoological Science 28: 264-267 PMid:21466343
View Article PubMed/NCBIGivens, D.I. & Deaville, E.R. (1999) The current and future role of near infrared reflectance spectroscopy in animal nutrition. - Australian Journal of Agricultural Research 50: 1131-1145
View ArticleHruschka, W.R. (1987). Data analysis: wavelength selection methods. In P. Williams and K. Norris (eds.) Near-Infrared Technology in the Agricultural and Food Industries. St. Paul, MN: American Association of Cereal Chemists Inc., pp.35-55
Martens, H., and T. Naes. (1991) Multivariate calibration. John Wiley, New York, NY. 419 pp
Næs, T., Baardseth, P., Helgesen, H. & Isaksson, T. (1996) Multivariate techniques in the analysis of meat quality. - Meat Science 43 (Suppl. 1): 135-149. 00061-7
View ArticlePasikatan, M.C., Steele J.L., Spillman C.K., Haque E. (2001). Near Infrared reflectance spectroscopy for online particlesize analysis of powders and ground materials. J. Near Infrared
Pritchard, G.T. & Robbins, C.T. (1990) Digestive and metabolic efficiencies of grizzly and black bears. – Canadian Journal of Zoology 68: 1645-1651.
View ArticleShenk, J.S. and Westerhaus, M.O. (1991). Population structuring of near infrared spectra and modified partial least squares regression. Crop Science, 31: 1548-1555
View ArticleShenk, J.S. & Westerhaus, M.O. (1996) Calibration the ISI way. - In: Davies, A.M.C. & Williams, P. (Eds.); Near Infrared Spectroscopy: the future waves. NIRS Publications, Chichester, UK, pp. 198-202.
Shengfeng W., Yong C., Miao L., Zhiheng H., Dianjianyi S., Yukun D., Meng S., Canqing Y., Qingmin L., Yanjun R., Jun L., Liming L. (2011). The Changes of Nutrition Labeling of Packaged Food in Hangzhou in China during 2008 – 2010. PLoS ONE | www.plosone.org . 6 (12), 1-9.
Stuth J., Jama A., Tolleson D. (2003). Direct and indirect means of predicting forage quality through near infrared reflectance spectroscopy. Field Crops Research 84 (2003) 45–56 00140-0
View ArticleKiesel K, McCluskey J.J., VillasSpectroscopy-Boas S.B. (2011). Nutritional Labeling and Consumer Choices. Annual Reviews. 3, 1-30
View ArticleWilliams, P.C. (1987). Variables affecting near-infrared reflectance spectroscopic analysis. In P. Williams and K. Norris (eds.) Near-Infrared Technology in the Agricultural and Food Industries. St. Paul, MN: American Association of Cereal Chemists Inc., pp. 143-167. PMCid:PMC2428233