Shamsher Ali
Email: shamsher.gjust@gmail.com
© 2019 Sift Desk Journals. All Rights Reserved
VOLUME: 5 ISSUE: 4
Page No: 199-217
Shamsher Ali
Email: shamsher.gjust@gmail.com
Shamsher Ali1*, Alka Sharma1
1 Department of Food Technology, Guru Jambheshwar University of Science and Technology, Hisar, Haryana-125001, India
SHAMSHER ALI, Osmotic Dehydration and Assessment of Quality Attributes of Seasonal Vegetable Crops: Carrot and Beetroot Cubes (2020) Journal of Food Science & Technolo-gy 5(4) pp:199-217
Fulfilling the food demand of a growing population is the biggest challenge as lot of food globally got wasted due to improper storage and processing. Osmotic dehydration offers high-quality preservation and maintenance of the integrity of fruits & vegetables. Response surface methodology was performed to estimate the main effect of osmotic dehydration process on quality attributes of carrot and beetroot cubes. Higher values of the osmotic solution of salt and sucrose at sample to solution ratio of 1:5 had provoked higher flows of water and solutes through the carrot and beetroot cubes. The range of NaCl concentration varies from 4-12 % w/v in carrot and 12-16 % w/v in beetroot for 2, 4 and 6 hour. However, sucrose concentration varies from 40-60º Brix in both carrot and beetroot. Quality attribute of carrot and beetroot including ascorbic acid, carotenoid, total phenol etc. didn’t changed on recommended process variables 50º Brix of sucrose + 8 % w/v sodium chloride for carrot and 50º Brix of sucrose + 14 % w/v NaCl for beetroot under osmotic dehydration for 4 hours. It was considered to get maximum water loss, weight reduction, subsequent rehydration ratio, overall acceptability and minimum solute gain of rehydrated product.
Keywords: Osmotic dehydration; Carrot; Beetroot; Preservation; Response Surface Methodology
India has been bestowed with a broad range of climate and physio-geographical conditions and is best suitable for horticulture crops like fruits, vegetables, nuts, flowers, and plantation crops (Gupta et al., 2019). Fruits and vegetables contribute an important source of nutrients in the daily human diet. In accord-ance to the FAOSTAT database 2018, the global fruits production is estimated to 868.09 million metric tons (MMT) and that of vegetables is 1088.9 MMT. India is that the second-largest producer of fruits and vegetables and its annual production is 97358 and 184394 thousand MT respectively during 2017-2018 contributing 11.2% of world production (Handbook on Horticulture Statistic, 2018). Despite the high contribution of India to global food production, approx. 18% of the whole fruits and vegetables got wasted due to improper storage and processing (Balaji and Arshinder,2016).
Carrot (Daucus carrota) and beetroot (Beta vulgaris) are the most significant seasonal root vegetables grown extensively in the tropical region during winter seasons. Carrots (Daucus carrota) have significant multidimensional applications including preparation of salad, cooked vegetables, stews, curries, sweetmeat, juices, fermented pickles, flakes, and soups. Carrots are rich in nutrients like carotenoids, vitamins (B1, B2, and B6), and minerals (Singh et al., 2012). The antioxidant properties of beta carotene in carrots help to weigh down the aging process (Singh et al., 1996), reduce cholesterol production, and thus minimize the danger of heart diseases (Di Pietro et al., 2016). Falcarinol, a compound presents in carrots is additionally reported to stop breast, lung, and colon cancers (Tan et al., 2014; Kobaek-Larsen et al., 2018). Vitamins and minerals of carrots detoxify the liver and reduce decay and damage (Pryor et al., 2000). Beetroot is a vegetablecommonly referred to be a species of phanerogamof the goosefoot family. Beetroot is peeled off, steamed, eaten warm with butter, cooked, pickled, and eaten cold as a condiment, shredded raw or eaten as a salad. Beetroots also are high in folate, solvable and insoluble dietary fiber and antioxidants. Betalains in the juice of beetroot act as antioxidants to reduce oxidative stress and also help to relax the mind (Clifford et al., 2017). The betacyanin present in beetroot additionally to its detoxification activity is additionally reported to excert chemotherapeutic activity in numerous kinds of cancers (Kapadia et al., 2011). Dietary consumption of beetroot nitrate increases the extent of alpha-lipoprotein and consequently reduces the beta-lipoprotein and minimizes the danger of coronary diseases (Singh et al., 2015). It increases somatic cell count so it's an awfully good option for anemic people because it is extremely rich in iron content (Hatlin Sugi, 2014). Moreover, beetroots purify the blood and strengthen the system against common diseases including jaundice, hepatitis, nausea, and vomiting.
Preservation of fruits, vegetables, and other perishable food is important for increasing its availability to satisfy the demand of the growing population; maintenance of its quality, taste, and integrity is additionally a challenging job. Numerous process technologies including freezing, canning, dehydration, etc. are used at industrial scale for the preservation of food products but it's very expensive. Therefore, there's a necessity for the straightforward and cheap alternate process which incorporates a low capital investment and offers a technique to save lots of highly perishable products and increases it’s availability within the region off from the assembly zones (Shi and Le Maguer, 2002). Among others, osmotic dehydration (OD) offers high-quality preservation and maintenance of the integrity of fruits & vegetables by a way of water removal without activity and reduction of microbial growth (Bahmani et al., 2016). Moreover, OD also improves nutritional value, sensory traits, and functional properties of food without changing its integrity. OD process within the food industry has several advantages like increased sugar to acid ratio, improves quality parameters, energy efficiency, packaging reduction, cost reduction, improves texture stability of pigments, better product firmness, and retention of nutrients during dehydration and storage. It is effective at ambient temperatures, that the heat damage to texture, color, and flavor is minimized.
In normal condition, fresh carrots and beetroot are stored up to three or 4 days but the period is extended up to 7 to 8 months by its storage in crates covered with perforated plastic films (00 C, 93-96% relative humidity), through fermentation, pickling, canning, freeze-drying, cold storage, etc. (Madison and Coleman, 2007; Rundla and Mishra, 2018). In recent years, OD attained attention for the preservation of fruits and vegetables like banana, carrot, pineapple, mango, and leafy vegetables. it also improves to retain characteristics including color, aroma, and nutritional compositions (Akbarian et al, 2014; Mercali et al., 2011). However, the effect of osmotic dehydration on carrot and beetroot remained unaddressed. Keeping in sight the above aspects, the current study was undertaken to perform osmotic dehydration of carrot & beetroot by using different hypertonic solutions. Moreover, a comparison of varied quality attributes and drying parameters of the obtained products was done.
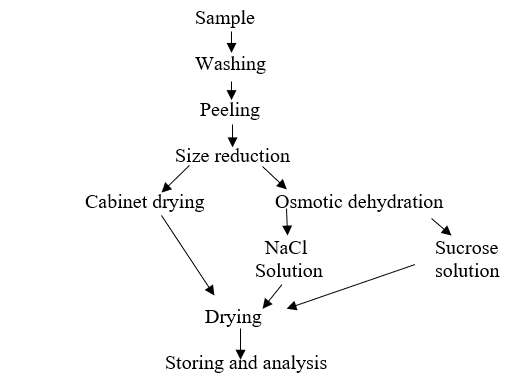
2.1 Sample Collection
The carrot of Hisar Garic variety was brought from Chaudhary Charan Singh Agriculture University, Haryana, India. Beetroot obtained from the local market of Hisar, Haryana.
2.2 Osmotic dehydration of carrot and beetroot
Osmotic dehydration of carrot cubes was done in a sodium chloride solution of 4, 8, and 12 % and 40, 50, and 60º Brix of sucrose. Beetroot was osmotically dehydrated in solutions of sodium chloride: 12, 14, and 16 % and sucrose: 40, 50, and 60 º Brix. The ratio of sample to the solution was 1:5 for 2, 4, and 6 hours to determine water loss (WL) and solute gain (SG). To obtain the maximum WL, SG, and weight reduction (WR) at optimizing temperature, fruits solution ratio, and degree Brix of the osmotic solution of sucrose was selected using Response surface methodology (RSM).
Drying is one of the oldest methods for the preservation of food by reduction of moisture content that minimize the deteriorative chemical reaction in highly perishable food. Drying of carrot and beetroot was done by two methods: Osmotic dehydration and Oven Drying.
2.3. Measurement of quality attribute and drying parameter
Determination of moisture content
Moisture content of treated as well as untreated samples was estimated just before drying by hot air oven drying method. The cubes of carrot and beetroot dried at 60-700C till the constant weight of the sample was obtained and subsequently the weight of the samples were determined after cooling in desiccators. Moisture content is expressed in term of percentage (%). The loss in weight during drying was used to determine the moisture content of the sample during the OD process.
Moisture content (% dry basis) = W1 -W2/W1 x 100
W₁= weight of the initial sample
W₂= weight of dried sample
Estimation of dry matter, water loss and solute gain.
During osmotic dehydration, WL and SG take place simultaneously. The weight of the sample is reduced due to water loss; simultaneously increase in weight due to solute permeability. Therefore, water loss is the sum of weight reduction and solute gain.
Weight reduction (g) = WR = (W0-Wt)
Solute gain after OD for time t (g) = SG =(St-S0)
WL =WR +SG
The WL and SG during osmotic dehydration were calculated by the equation given by Ozen et al., (2002).
WL/100g of sample = (W0-Wt) + (St-S0)/W0 x 100
SG/100g of sample = (St-S0)/W0 x 100
W0 = Initial weight of sample (g).
Wt = Weight of sample after OD at a time t (g).
St = Initial weight of solids (dry matter) in the sample (g).
S0 = Weight of solids (dry matter) of the sample after OD for time t (g).
Determination of ash content
Ash content represents the inorganic residue after the destruction of organic matter. For determination of ash content, 5g of the sample was pre-weighed in clean crucible followed by heating to charring of the sample on a hot plate. The crucible with the carbon residue of ignition was placed in a muffle furnace at a temperature of 550 0C until the carbon residue disappears followed by cooling and weighing. The difference in the weight by ash content was calculated by using formula
Total Ash content (%) = Final wt. / initial wt. x 100
Rehydration ratio
Rehydration ratio (RR) was measured by soaking a 10-15g of each sample in sufficient volume of water (approximately 30 times the weight of sample) at room temperature (RT) (Gupta and Shukla, 2017). Rehydration was done for 12 hours, cubes reached to constant weight that were weighed after removing excess of water with the help of absorbent paper. The rehydration ratio was calculated by using formula.
Rehydration Ratio = W2/W1
W₁ = Weight of rehydrated sample
W₂ = Weight of dehydrated sample
Total phenol content
Total phenol content was determined according to Folin Ciocalteau procedure (Gonçalves et al., 2010) with slight modifications. 2g of the sample was homogenized in 80% of aqueous ethanol at a RT followed by centrifugation at 10,000 rpm for 15 minutes, the supernatant was retained. The residue was re-extracted twice in 80% ethanol and the supernatant was evaporated to dryness by using evaporating dishes in a water bath at 40 0C. The residue was dissolved in 5ml of distilled water (DW). Extract was diluted to 3 ml with distilled water followed by the addition of 0.5 ml of Folin-Ciocalteau reagent and incubation of 3 minutes. 2ml of 20% sodium carbonate was added and content was thoroughly mixed. After incubation of 60 minutes, the optical density of colored product was measured at 760 nm in UV spectrophotometer using catechol as a standard. Result was expressed as mg catechol/100g of fresh weight material. Total phenol was calculated by using formula.
Total Phenol (mg/100g) = M x V x 100/ W x V x 100
M = Concentration by graph
V = Volume conjure
V1 = Volume of extract aliquot for color development
W = Weight of sample
Total carotenoid content
Total carotenoid content was resolute by homogenizing 1g of fresh sample in 10 ml of DW during a blender. After centrifugation, 4.5 ml of acetone was added in 0.5 ml aliquot to extract pigments. The supernatant was taken after centrifugation and absorbance was measured at 480, 645 and 663 nm by using 80% acetone as a blank within the UV spectrophotometer.
Total carotenoid was calculated by using formula.
Carotene (g/liter) = (absorbance at 480) - (0.114) (absorbance at 663) – (0.638) (absorbance at 645)
Total antioxidant content using DPPH radical scavenging assay
The total antioxidant activity of the carrot and beetroot powder was estimated by using the DPPH radical scavenging protocol. DPPH solution (0.004% w/v) was prepared in 95% ethanol. a customary water-soluble vitamin solution was prepared at the concentration of 10mg/100ml specified 2 ml of freshly prepared DPPH solution (0.004% w/v) was added in each tube. The reaction mixture was incubated within the dark for 15 min. Thereafter, the absorbance was recorded at 523 nm against the blank after 30 min. For the control, 2 ml of DPPH solution was mixed with 10 ml of ethanol. the potential of scavenging DPPH radical was calculated by using the subsequent equation (Ara and Nur, 2009).
DPPH scavenged (%) =(Abs.(control)-Abs.(carrot/beetroot))/(Abs.(control)) × 100
Ascorbic acid content
The method was supported the reduction of 2,6-dichlorophenol-indophenol dye by water-soluble vitamin (Shah and Nath, 2008). water-soluble vitamin content was measured on a dry weight basis.
2,6-dichlorophenol-Indophenol Visual titration method
The dye is blue in alkaline solution and red in acid solution; reduced via water-soluble vitamin to a colorless form. The reaction is quantitative specific for water-soluble vitamin within the pH range 1-3.5.
Statistical Method
Response surface methodology (RSM) could be a very useful gizmo in product design (Box and Wilson, 1951). It is an efficient tool for the assessment of responses stricken by many factors and their interactions. RSM is reported to be an efficient tool for optimizing a process when the independent variables have a combined effect on the responses (Mudahar et al., 1989). it's an employed tool in analyzing experimental data consequent within the optimization of processes or products. it's used for designing the experiments or is also defined as an empirical statistical modeling technique employed for multivariate analysis analysis using quantitative data obtained from properly intended experiments to resolve multivariate equations simultaneously. A mathematical relation, f, was assumed for describing the correlation between each of the response variables, Yi and also the factors xi, such as
Yi = f (x1, x2, x3…)
The exact mathematical representation of the function (f) is either unknown or extremely complex. Though, a second-order polynomial equation of the subsequent form was assumed to relate Yij and Xi.
Where, β0, βi, βii, βij are regression coefficients. x0, xi, xj are the coded independent variables linearly associated with real variables. it's accustomed fit the second order polynomial equation to the experimental data.
For optimization of the OD process, the experiment was conducted per Central Composite Design (CCD) with three variables. The CCD design predict uniformly in the least constant distances from their central point (Khuri et al. Cornell J A et al.1987). the look was created by commercial statistical package, Design-Expert version 10.0.3.1 (Statease Inc., Minneapolis, USA, Trial version). The variables were salt concentration, sucrose concentration and time of osmotic dehydration process. The low to high level of NaCl concentration in carrot and beetroot varies from 4-12 % w/v and 12 to Sixteen Personality Factor Questionnaire w/v respectively. The sucrose concentration is 40-600 Brix for both carrot and beetroot. The incubation was in serious trouble 2, 4 and 6 hours. RSM used to estimate the main effect of OD process on WL, SG and WR in carrot and beetroot cube with the aim of decreasing the cost of expensive analysis methods and their associated numerical noise. (Box and Draper, 1987; Venter et al. 1996). Experiment data were randomized under Central Composite and ANOVA for response surface methodology by using the quadratic model.
Osmotic dehydration kinetics including WR, SG, WL and RR of carrot and beetroot cubes was studied using sucrose and sodium chloride salts as osmotic agents. The process parameters viz. concentration of the osmotic solution, time and sample to solution ratio were also optimized.
3.1 Proximate analysis
Proximate analysis of carrot and beetroot was carried out and results are shown in Table 3.1. The results are expressed as g/100g as on a dry weight basis. The carbohydrate, fat, protein, sucrose, and crude fibre content was reported within the range reported by Holland et al., (1991), Anon et al.,(1952) and Zwart et al., (2003) respectively. The effects of practice parameters (concentration, duration of sample to solution ratio) on the kinetics of moisture loss and solute uptake during OD of carrot and beetroot cubes were accomplished according to the CCD experimental design as indicated in tables 3.4 and 3.9. The results showed that the combined effect of sugar and salt was more effective than individual concentration in case of both water loss and solute uptake during the process.
Table 3.1: Proximate analysis of carrot and beetroot
|
Sample
|
Moisture (%) |
Ash (%) |
Carbohydrate (%) |
Fat (%) |
Protein (%) |
Sucrose (%) |
Crude Fiber (%) |
|
Carrot |
88 ± 0.5 |
0.9± 0.2 |
10.4 ± 0.2 |
0.2±0.1 |
0.9±0.1 |
26 ± 1.7 |
2.4. ±0.2 |
|
Beetroot |
86 ± 0.5 |
1.1± 0.3 |
10 ± 0.2 |
0.3±0.1 |
1.6 ± 0.1 |
78 ± 6.7 |
2.8 ± 0.1 |
3.2 Assessment of ascorbic acid, phenolic content, carotenoids and antioxidant Activity
Ascorbic acid, total carotenoid values did not changed on any of the treatment processes. Antioxidant activity of both carrot and beetroot significantly reduced on 8% NaCl and 50o brix sucrose treatment but not on mixture of both. Total phenol level changed on single treatment of 14% NaCl and 50o brix sucrose in beetroot but not carrot. On combinational treatment, no phenolic content changed in resulting carrot and beetroot (Table 3.2 and 3.3).
Table 3.2. Ascorbic Acid, Phenolic Content, Carotenoids and Antioxidant Activity of carrot
|
Sr. No |
Sample |
Fresh Sample |
8% NaCl Treated Sample |
500 Brix Treated Sample |
8 % Nacl+ 500 Brix Sucrose treated Sample |
|
1. |
Ascorbic Acid (mg/100 g FW) |
54.5 ± 0.20 |
50.1 ± 0.3 |
51.5 ± 0.4 |
53 ± 0.1 |
|
2. |
Total Phenol (mg/100 g FW) |
39.76 ± 1.3 |
35.2 ± 0.8 |
36.7 ± 0.7 |
39. ± 0.3 |
|
3. |
Total Carotenoids (mg/1000g FW) |
81 ± 1.5 |
77 ± 3.5 |
79 ± 0.5 |
80 ± 0.5 |
|
4. |
Total Antioxidant (mg/100 g FW) |
34.44 ± 0.1
|
27 ± 0.5*** |
29± 0.2*** |
32 ± 1.3
|
Table 3.3. Ascorbic Acid, Phenolic Content, Carotenoids and Antioxidant Activity of beetroot
|
Sr. No |
Constituent Name |
Fresh Sample |
14% NaCl Treated Sample |
500 Brix Scrose Treated Sample |
14% NaCl+ 500 Brix Sucrose treated Sample |
|
1. |
Ascorbic Acid (mg/100 g FW) |
48.4 ± 0.8 |
44.1 ± 0.6 |
46.7 ± 0.4 |
47.9± 0.5 |
|
2. |
Total Phenol (mg/100 g FW) |
57.64 ± 1.2 |
35.2 ± 0.8 *** |
36.7± 0.7*** |
49. ± 0.3 |
|
3. |
Total Carotenoids (mg/100 g FW) |
76.81 ± 1.5 |
72 ± 3.5 |
74 ± 0.5 |
74 ± 0.8 |
|
4. |
Total Antioxidant (mg/100 g FW) |
43.12 ± 0.8 |
27.5 ± 0.5***
|
29 ± 0.2*** |
32 ± 1.3 |
Table 3.4. Observed values of dependent variables for different runs of optimization experiments for osmotic dehydration of carrot
|
Run |
Factor 1 |
Factor 2 |
Factor 3 |
Response1 |
Response2 |
Response3 |
Response4 |
|
A:NaCl (%) |
B:Sucrose (0Brix) |
C:Time (Hour) |
Weight Reduction (%) |
Water loss (%) |
Solute gain (%) |
Rehydration Ratio |
|
|
1 |
12 |
40 |
2 |
25.19 |
30.99 |
5.8 |
2.872 |
|
2 |
8 |
50 |
4 |
36.89 |
50.79 |
12.9 |
2.454 |
|
3 |
12 |
60 |
2 |
28.45 |
39.55 |
11.1 |
2.4732 |
|
4 |
8 |
66.8179 |
4 |
35.8 |
49.93 |
13.65 |
2.243 |
|
5 |
8 |
50 |
4 |
37.4 |
49.9 |
12.5 |
2.659 |
|
6 |
12 |
60 |
6 |
35.47 |
48.17 |
12.7 |
2.739 |
|
7 |
8 |
50 |
4 |
37.34 |
49.44 |
12.1 |
2.652 |
|
8 |
8 |
50 |
4 |
37.07 |
48.89 |
11.82 |
2.588 |
|
9 |
4 |
40 |
6 |
22.78 |
29.38 |
6.6 |
2.874 |
|
10 |
8 |
50 |
0.63641 |
25.7 |
28.68 |
2.98 |
3.176 |
|
11 |
12 |
40 |
6 |
25.64 |
33.54 |
7.9 |
3.017 |
|
12 |
8 |
50 |
4 |
37.19 |
48.14 |
10.95 |
2.693 |
|
13 |
4 |
60 |
2 |
27.71 |
36.61 |
8.9 |
2.656 |
|
14 |
1.27283 |
50 |
4 |
32.7 |
39.39 |
6.68 |
2.833 |
|
15 |
14.7272 |
50 |
4 |
34.1 |
42.9 |
8.9 |
2.904 |
|
16 |
8 |
33.1821 |
4 |
21.77 |
27.5 |
5.73 |
3.103 |
|
17 |
8 |
50 |
7.36359 |
36.44 |
50.77 |
14.33 |
2.176 |
|
18 |
4 |
40 |
2 |
24.18 |
28.78 |
4.6 |
2.995 |
|
19 |
4 |
60 |
6 |
31.94 |
45.75 |
13.81 |
2.341 |
|
20 |
8 |
50 |
4 |
35.91 |
51.34 |
13.43 |
2.566 |
3.3 Mass transfer kinetics during osmotic dehydration
The detailed analyses of various responses factors for the OD of carrot and beetroot cubes are mentioned. OD process with all possible combinations, the full factorial design with three factors viz., concentration, sample to solution ratio and immersion time was used during the process of OD. The results were assessed by the multiple linear regression equation conducted for the second-order response surface model as mentioned below.
1. Mass transfer kinetics for carrot:
A.1: Fitting models for WR of carrot
Results presented in Table 3.5. The significance of each coefficient was determined through the Fischer F test and P values for the carrot. The Model F-value of 12.95 implies that the model is significant. There is only 0.02% chance that F-value will occur due to noise. Values of "Prob > F" less than 0.0500 indicate model terms are significant. In this case, B, C, A2, B2, C2 are significant model terms. The "Lack of Fit F-value" of 30.59 implies that the Lack of Fit is significant. There is only 0.09% chance that a "Lack of Fit F-value" may occur due to noise.
Table 3.5. ANOVA of response surface quadratic model for weight reduction.
|
Analysis of variance table [Partial sum of squares - Type III] |
||||||
|
Source |
Sum of Squares |
df |
Mean Square |
F Value |
p-value Prob > F |
|
|
Model |
555.91 |
9 |
61.77 |
12.95 |
0.0002 |
significant |
|
A-NaCl |
8.06 |
1 |
8.06 |
1.69 |
0.2227 |
|
|
B-Sucrose |
178.51 |
1 |
178.51 |
37.42 |
0.0001 |
|
|
C-Time |
58.90 |
1 |
58.90 |
12.35 |
0.0056 |
|
|
AB |
0.020 |
1 |
0.020 |
4.193E-003 |
0.9496 |
|
|
AC |
2.69 |
1 |
2.69 |
0.56 |
0.4699 |
|
|
BC |
18.61 |
1 |
18.61 |
3.90 |
0.0765 |
|
|
A2 |
52.37 |
1 |
52.37 |
10.98 |
0.0078 |
|
|
B2 |
180.39 |
1 |
180.39 |
37.82 |
0.0001 |
|
|
C2 |
107.42 |
1 |
107.42 |
22.52 |
0.0008 |
|
|
Residual |
47.70 |
10 |
4.77 |
|
|
|
|
Lack of Fit |
46.19 |
5 |
9.24 |
30.59 |
0.0009 |
significant |
|
Pure Error |
1.51 |
5 |
0.30 |
|
|
|
|
Total |
603.62 |
19 |
|
|
|
|
Final equation in terms of coded factors:
|
WR |
= |
+37.56 |
+0.77 |
* A |
+3.62 |
* B |
+2.08 |
* C |
+0.050 |
* AB |
+0.58 |
|
|
|
* AC |
+1.53 |
* BC |
-2.08 |
* A2 |
-3.71 |
* B2 |
-2.90 |
* C2 |
|
B.1: WR response surfaces plots of carrot
Result represented in Fig. 3.1
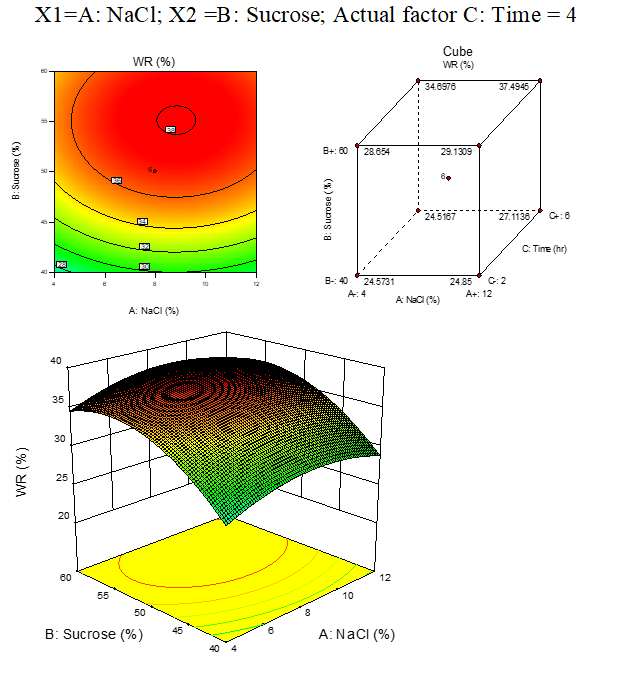
Fig. 3.1. Effect of osmotic solution of NaCl, sucrose concentration on weight reduction during osmotic dehydration of carrot cubes
A.2: Fitting models for solute gain of carrot
Results presented in Table 3.6. The significance of each coefficient was determined through the Fischer F test and P values for the carrot. The Model F-value of 10.82 implies the model is significant. There is only 0.05% chance that F-value could occur due to noise. Values of "Prob > F" less than 0.0500 indicate model terms are significant. In this case, B, C, A2, C2 are significant model terms. The "Lack of Fit F-value" of 4.47 implies there is a 6.29% chance that a "Lack of Fit F-value" could occur due to noise.
The final equation in terms of coded factors:
|
SG |
= |
+12.28 |
+0.45 |
* A |
+2.43 |
* B |
+2.17 |
* C |
-0.18 |
* AB |
-0.40 |
|
|
|
* AC |
+0.30 |
* BC |
-1.43 |
* A2 |
-0.70 |
* B2 |
-1.26 |
* C2 |
|
Table 3.6. ANOVA of response surface quadratic model for solute gain
|
Analysis of variance table [Partial sum of squares - Type III] |
||||||
|
Source |
Sum of Squares |
df |
Mean Square |
F Value |
p-value Prob > F |
|
|
Model |
200.85 |
9 |
22.32 |
10.82 |
0.0005 |
significant |
|
A-NaCl |
2.71 |
1 |
2.71 |
1.31 |
0.2787 |
|
|
B-Sucrose |
80.37 |
1 |
80.37 |
38.97 |
< 0.0001 |
|
|
C-Time |
64.58 |
1 |
64.58 |
31.31 |
0.0002 |
|
|
AB |
0.25 |
1 |
0.25 |
0.12 |
0.7357 |
|
|
AC |
1.29 |
1 |
1.29 |
0.62 |
0.4477 |
|
|
BC |
0.73 |
1 |
0.73 |
0.35 |
0.5662 |
|
|
A2 |
29.65 |
1 |
29.65 |
14.37 |
0.0035 |
|
|
B2 |
7.15 |
1 |
7.15 |
3.47 |
0.0923 |
|
|
C2 |
22.85 |
1 |
22.85 |
11.08 |
0.0076 |
|
|
Residual |
20.63 |
10 |
2.06 |
|
|
|
|
Lack of Fit |
16.86 |
5 |
3.37 |
4.47 |
0.0629 |
significant |
|
Pure Error |
3.77 |
5 |
0.75 |
|
|
|
|
Total |
221.47 |
19 |
|
|
|
|
B.2: SG response surfaces plots of carrot
Result represented in Fig. 3.2
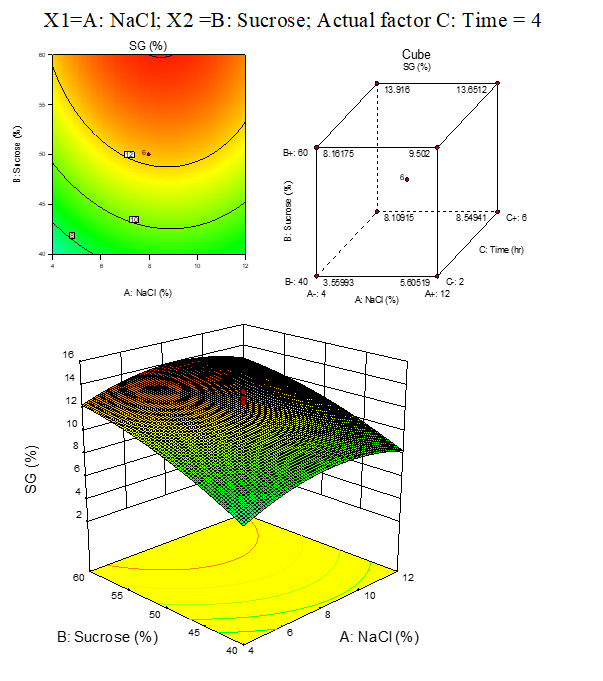
Fig. 3.2. Effect of osmotic solution of NaCl, sucrose concentration on SG during osmotic dehydration of carrot
A.3: Fitting models for water loss of carrot
Results presented in Table 3.7. The Model F-value of 17.11 implies the model is significant. There is only a 0.01% chance that F-value could occur due to noise. Values of "Prob > F" less than 0.0500 indicate model terms are significant. In this case, B, C, A2, B2, C2 are significant model terms.
The "Lack of Fit F-value" of 11.79 implies the Lack of Fit is significant. There is only 0.85% chance that a "Lack of Fit F-value" may occur due to noise.
|
Table 3.7: ANOVA for response surface quadratic model of water loss |
||||||
|
Analysis of variance table [Partial sum of squares - Type III] |
||||||
|
Source |
Sum of Squares |
Df |
Mean Square |
F Value |
p-value Prob > F |
|
|
Model |
1390.42 |
9 |
154.49 |
17.11 |
< 0.0001 |
significant |
|
A-NaCl |
20.24 |
1 |
20.24 |
2.24 |
0.1653 |
|
|
B-Sucrose |
508.25 |
1 |
508.25 |
56.29 |
< 0.0001 |
|
|
C-Time |
246.84 |
1 |
246.84 |
27.34 |
0.0004 |
|
|
AB |
0.13 |
1 |
0.13 |
0.014 |
0.9078 |
|
|
AC |
0.26 |
1 |
0.26 |
0.028 |
0.8697 |
|
|
BC |
26.68 |
1 |
26.68 |
2.95 |
0.1164 |
|
|
A2 |
179.05 |
1 |
179.05 |
19.83 |
0.0012 |
|
|
B2 |
272.30 |
1 |
272.30 |
30.16 |
0.0003 |
|
|
C2 |
251.66 |
1 |
251.66 |
27.87 |
0.0004 |
|
|
Residual |
90.29 |
10 |
9.03 |
|
|
|
|
Lack of Fit |
83.23 |
5 |
16.65 |
11.79 |
0.0085 |
significant |
|
Pure Error |
7.06 |
5 |
1.41 |
|
|
|
|
Total |
1480.72 |
19 |
|
|
|
|
The final equation in terms of coded factors:
|
WL |
= |
+49.85 |
+1.22 |
* A |
+6.10 |
* B |
+4.25 |
* C |
-0.13 |
* AB |
+0.18 |
|
|
|
* AC |
+1.83 |
* BC |
-3.52 |
* A2 |
-4.35 |
* B2 |
-4.18 |
* C2 |
|
A.4: Fitting models for rehydration ratio of carrot
Results presented in Table 3.8. The Model F-value of 3.52 implies the model is significant. There is only 3.13% chance that F-value could occur due to noise. Values of "Prob > F" less than 0.0500 indicate model terms are significant. In this case B, C are significant model terms. The "Lack of Fit F-value" of 8.34 implies that the Lack of Fit is significant. There is only a1.81% chance that a "Lack of Fit F-value" may occur due to noise.
Table 3.8. ANOVA of response surface quadratic model for rehydration ratio
|
Analysis of variance table [Partial sum of squares - Type III] |
||||||
|
Source |
Sum of Squares |
Df |
Mean Square |
F Value |
p-value Prob > F |
|
|
Model |
1.11 |
9 |
0.12 |
3.52 |
0.0313 |
significant |
|
A-NaCl |
9.208E-003 |
1 |
9.208E-003 |
0.26 |
0.6189 |
|
|
B-Sucrose |
0.66 |
1 |
0.66 |
18.79 |
0.0015 |
|
|
C-Time |
0.21 |
1 |
0.21 |
6.10 |
0.0331 |
|
|
AB |
4.763E-003 |
1 |
4.763E-003 |
0.14 |
0.7197 |
|
|
AC |
0.090 |
1 |
0.090 |
2.56 |
0.1404 |
|
|
BC |
6.698E-004 |
1 |
6.698E-004 |
0.019 |
0.8927 |
|
|
A2 |
0.13 |
1 |
0.13 |
3.63 |
0.0857 |
|
|
B2 |
8.840E-003 |
1 |
8.840E-003 |
0.25 |
0.6259 |
|
|
C2 |
9.614E-003 |
1 |
9.614E-003 |
0.28 |
0.6114 |
|
|
Residual |
0.35 |
10 |
0.035 |
|
|
|
|
Lack of Fit |
0.31 |
5 |
0.062 |
8.34 |
0.0181 |
significant |
|
Pure Error |
0.037 |
5 |
7.485E-003 |
|
|
|
|
Cor Total |
1.46 |
19 |
|
|
|
|
The final equation in terms of coded factors:
|
RR |
= |
+2.60 |
+0.026 |
* A |
-0.22 |
* B |
-0.12 |
* C |
+0.024 |
* AB |
+0.11 |
|
|
|
* AC |
-9.150 |
* BC |
+0.094 |
* A2 |
+0.025 |
* B2 |
+0.026 |
* C2 |
|
B. 4:RR response surface plots of carrot:
Result represented in Fig. 3.4
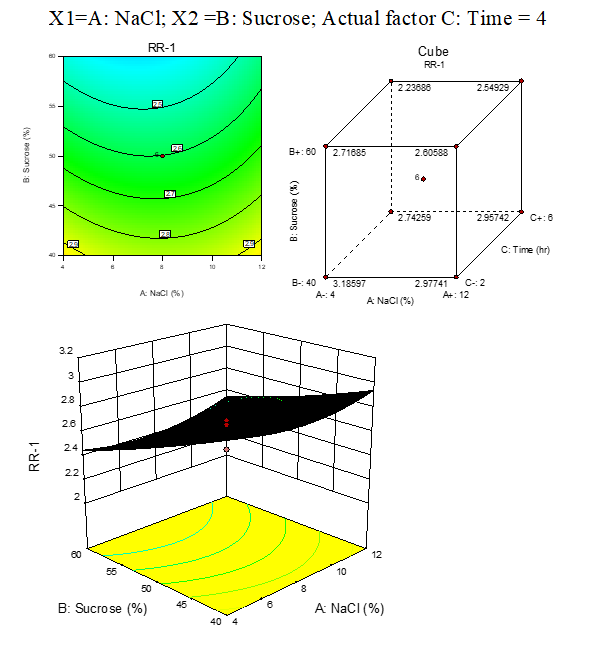
Fig. 3.4. Effect of osmotic solution of NaCl, sucrose concentration on rehydration ratio during osmotic dehydration of carrot cubes
2. Mass transfer kinetics for beetroot:
The effects of process parameters (concentration, duration & sample to solution ratio) on the kinetics of moisture loss and solute uptake in OD of beetroot cubes were performed according to the CCD experimental design given in Table 3.9. The CCD experimental design helps in obtaining the optimum combination of parameters for the OD of beetroot.
Table 3.9. Observed values of dependent variables for different runs of optimization experiments for osmotic dehydration of beetroot
|
Run |
Factor 1 |
Factor 2 |
Factor 3 |
Response 1 |
Response 2 |
Response 3 |
Response 4 |
|
A:NaCl (%) |
B:Sucrose (0Brix) |
C:Time (Hour) |
Weight Reduction (%) |
Solute Gain (%) |
Water Loss (%) |
Rehydration Ratio |
|
|
1 |
12 |
60 |
2 |
30.73 |
8.34 |
39.07 |
2.685 |
|
2 |
10.6364 |
50 |
4 |
33.28 |
9.14 |
42.42 |
2.722 |
|
3 |
14 |
50 |
4 |
34.21 |
10.68 |
44.89 |
2.73 |
|
4 |
14 |
50 |
4 |
35.13 |
9.31 |
44.44 |
2.611 |
|
5 |
14 |
50 |
4 |
33.77 |
11.49 |
45.26 |
2.669 |
|
6 |
14 |
50 |
4 |
34.59 |
11.15 |
45.74 |
2.793 |
|
7 |
12 |
60 |
6 |
27.11 |
11.21 |
38.32 |
2.274 |
|
8 |
12 |
40 |
6 |
25.47 |
6.32 |
31.79 |
2.784 |
|
9 |
14 |
33.1821 |
4 |
17.64 |
7.43 |
25.07 |
3.031 |
|
10 |
14 |
50 |
7.36359 |
34.89 |
11.17 |
46.06 |
2.091 |
|
11 |
16 |
40 |
2 |
21.33 |
5.99 |
27.32 |
2.771 |
|
12 |
16 |
60 |
6 |
27.54 |
11.56 |
39.1 |
2.643 |
|
13 |
16 |
60 |
2 |
31.77 |
8.61 |
40.38 |
2.32 |
|
14 |
14 |
50 |
4 |
33.76 |
10.44 |
44.2 |
2.733 |
|
15 |
17.3636 |
50 |
4 |
34.22 |
9.87 |
44.09 |
3.002 |
|
16 |
14 |
50 |
0.636414 |
19.73 |
4.211 |
23.941 |
3.02 |
|
17 |
16 |
40 |
6 |
25.98 |
6.61 |
32.59 |
2.982 |
|
18 |
14 |
66.8179 |
4 |
34.41 |
12.19 |
46.6 |
2.298 |
|
19 |
14 |
50 |
4 |
34.11 |
11.38 |
45.49 |
2.721 |
|
20 |
12 |
40 |
2 |
20.63 |
5.87 |
26.5 |
2.859 |
A.1: Fitting models for WR of beetroot
The results presented in Table 3.10. The significance of each coefficient was determined through the Fischer F test and P values for beetroot. The Model F-value of 6.57 implies the model is significant. There is only 0.35% chance that F-value will occur due to noise. Values of "Prob > F" less than 0.0500 indicate model terms are significant. In this case, B, C, B2, C2 are significant model terms. Values greater than 0.1000 indicate the model terms are not significant. The "Lack of Fit F-value" of 67.43 implies that the Lack of Fit is significant. There is only a 0.01% chance that a "Lack of Fit F-value" may occur due to noise.
Table 3.10. ANOVA of response surface quadratic model for weight reduction
|
Analysis of variance table [Partial sum of squares - Type III] |
||||||
|
Source |
Sum of Squares |
df |
Mean Square |
F Value |
p-value Prob > F |
|
|
Model |
559.04 |
9 |
62.12 |
6.57 |
0.0035 |
significant |
|
A-NaCl |
1.33 |
1 |
1.33 |
0.14 |
0.7154 |
|
|
B-Sucrose |
197.57 |
1 |
197.57 |
20.91 |
0.0010 |
|
|
C-Time |
53.92 |
1 |
53.92 |
5.71 |
0.0380 |
|
|
AB |
8.450E-003 |
1 |
8.450E-003 |
8.942E-004 |
0.9767 |
|
|
AC |
0.080 |
1 |
0.080 |
8.466E-003 |
0.9285 |
|
|
BC |
37.58 |
1 |
37.58 |
3.98 |
0.0741 |
|
|
A2 |
6.77 |
1 |
6.77 |
0.72 |
0.4171 |
|
|
B2 |
168.23 |
1 |
168.23 |
17.80 |
0.0018 |
|
|
C2 |
126.46 |
1 |
126.46 |
13.38 |
0.0044 |
|
|
Residual |
94.50 |
10 |
9.45 |
|
|
|
|
Lack of Fit |
93.12 |
5 |
18.62 |
67.43 |
0.0001 |
significant |
|
Pure Error |
1.38 |
5 |
0.28 |
|
|
|
|
Total |
653.53 |
19 |
|
|
|
|
The final equation in terms of coded factors:
|
WR |
= |
+34.34 |
+0.31 |
* A |
+3.80 |
* B |
+1.99 |
* C |
+0.033 |
* AB |
-0.100 |
|
|
|
* AC |
-2.17 |
* BC |
-0.69 |
* A2 |
-3.42 |
* B2 |
-2.96 |
* C2 |
|
B. 5:WR response surface plots of beetroot
Result represented in Fig. 3.5
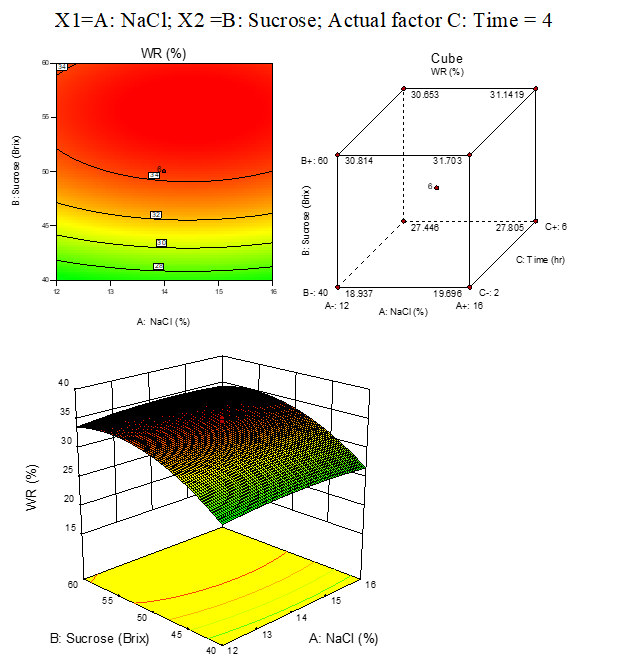
Fig. 3.5. Effect of osmotic solution of NaCl, sucrose concentration on weight reduction during osmotic dehydration of beetroot cubes
A. 2: Fitting models for SG of beetroot
The results presented in Table 3.11. The Model F-value of 9.56 implies the model is significant. There is only 0.08% chance that F-value this large will occur due to noise. Values of "Prob > F" less than 0.0500 indicate model terms are significant. In this case, B, C, B2, C2 are significant model terms. The "Lack of Fit F-value" of 2.36 implies that the Lack of Fit is not significant relative to the pure error. There is 18.35% chance that a "Lack of Fit F-value" this large may occur due to noise.
|
Table 3.11: ANOVA of response surface quadratic model for SG |
||||||
|
Analysis of variance table [Partial sum of squares - Type III] |
||||||
|
Source |
Sum of Squares |
df |
Mean Square |
F Value |
p-value Prob > F |
|
|
Model |
94.85 |
9 |
10.54 |
9.56 |
0.0008 |
significant |
|
A-NaCl |
0.37 |
1 |
0.37 |
0.34 |
0.5736 |
|
|
B-Sucrose |
38.52 |
1 |
38.52 |
34.93 |
0.0001 |
|
|
C-Time |
25.31 |
1 |
25.31 |
22.96 |
0.0007 |
|
|
AB |
5.512E-003 |
1 |
5.512E-003 |
4.999E-003 |
0.9450 |
|
|
AC |
7.813E-003 |
1 |
7.813E-003 |
7.085E-003 |
0.9346 |
|
|
BC |
2.82 |
1 |
2.82 |
2.56 |
0.1408 |
|
|
A2 |
5.41 |
1 |
5.41 |
4.91 |
0.0511 |
|
|
B2 |
3.68 |
1 |
3.68 |
3.33 |
0.0978 |
|
|
C2 |
22.68 |
1 |
22.68 |
20.57 |
0.0011 |
|
|
Residual |
11.03 |
10 |
1.10 |
|
|
|
|
Lack of Fit |
7.75 |
5 |
1.55 |
2.36 |
0.1835 |
not significant |
|
Pure Error |
3.28 |
5 |
0.66 |
|
|
|
|
Total |
105.88 |
19 |
|
|
|
|
Final equation in terms of coded factors:
|
SG |
= |
+10.77 |
+0.17 |
* A |
+1.68 |
* B |
+1.36 |
* C |
+0.026 |
* AB |
+0.031 |
|
|
|
* AC |
+0.59 |
* BC |
-0.61 |
* A2 |
-0.51 |
* B2 |
-1.25 |
* C2 |
|
B. 2: SG response surface plots of beetroot: fig. 3.6
Result represented in Fig. 3.6
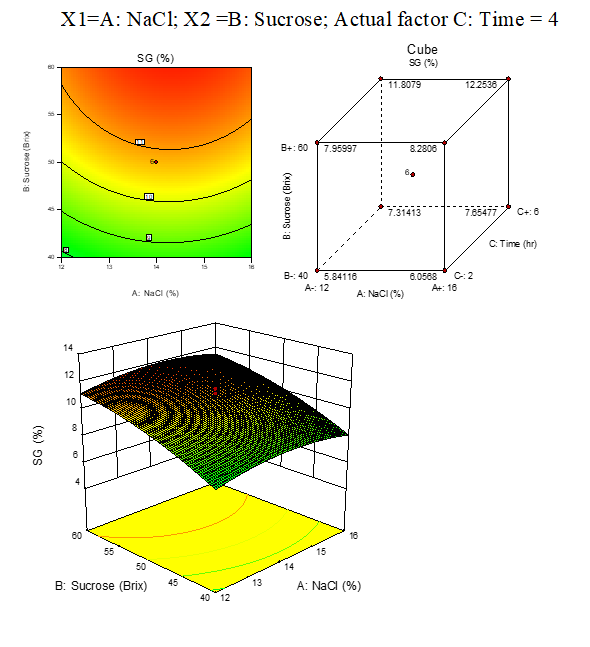
Fig. 3.6: Effect of osmotic solution of NaCl, sucrose concentration on SG during osmotic dehydration of beetroot cubes
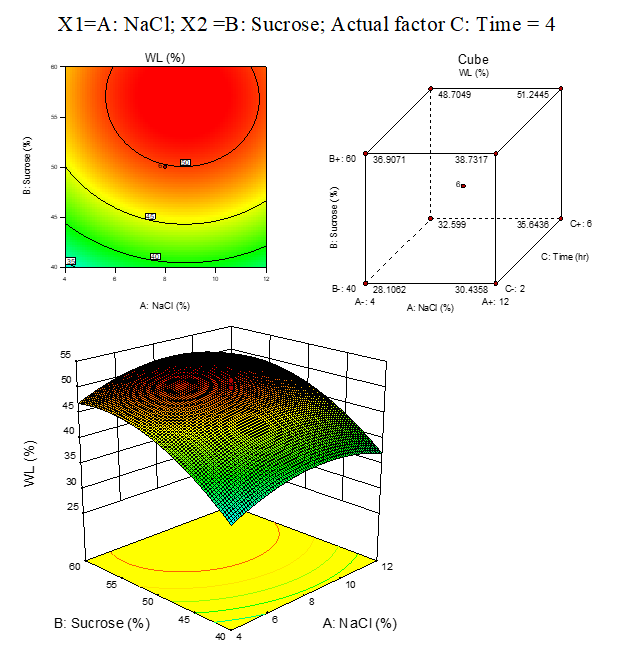
A. 3:Fitting models for WL of beetroot
The results presented in Table 3.12. The Model F-value of 7.93 implies the model is significant. There is only 0.16% chance that F-value will occur due to noise. Values of "Prob > F" less than 0.0500 indicate model terms are significant. In this case, B, C, B2, C2 are significant model terms. The "Lack of Fit F-value" of 77.96 implies that the Lack of Fit is significant. There is only a 0.01% chance that a "Lack of Fit F-value" may occur due to noise.
|
Table 3.12: ANOVA of response surface quadratic model for water loss |
||||||
|
Analysis of variance table [Partial sum of squares - Type III] |
||||||
|
Source |
Sum of Squares |
df |
Mean Square |
F Value |
p-value Prob > F |
|
|
Model |
1026.17 |
9 |
114.02 |
7.93 |
0.0016 |
Significant |
|
A-NaCl |
3.11 |
1 |
3.11 |
0.22 |
0.6518 |
|
|
B-Sucrose |
410.55 |
1 |
410.55 |
28.56 |
0.0003 |
|
|
C-Time |
153.12 |
1 |
153.12 |
10.65 |
0.0085 |
|
|
AB |
0.028 |
1 |
0.028 |
1.921E-003 |
0.9659 |
|
|
AC |
0.038 |
1 |
0.038 |
2.630E-003 |
0.9601 |
|
|
BC |
19.81 |
1 |
19.81 |
1.38 |
0.2676 |
|
|
A2 |
24.29 |
1 |
24.29 |
1.69 |
0.2228 |
|
|
B2 |
221.64 |
1 |
221.64 |
15.42 |
0.0028 |
|
|
C2 |
256.25 |
1 |
256.25 |
17.82 |
0.0018 |
|
|
Residual |
143.78 |
10 |
14.38 |
|
|
|
|
Lack of Fit |
141.95 |
5 |
28.39 |
77.96 |
< 0.0001 |
significant |
|
Pure Error |
1.82 |
5 |
0.36 |
|
|
|
|
Total |
1169.95 |
19 |
|
|
|
|
The final equation in terms of coded factors:
|
WL |
= |
+45.11 |
+0.48 |
* A |
+5.48 |
* B |
+3.35 |
* C |
+0.059 |
* AB |
-0.069 |
|
|
|
* AC |
-1.57 |
* BC |
-1.30 |
* A2 |
-3.92 |
* B2 |
-4.22 |
* C2 |
|
B. 3:WL response surface plots of beetroot
Result represented in Fig. 3.7
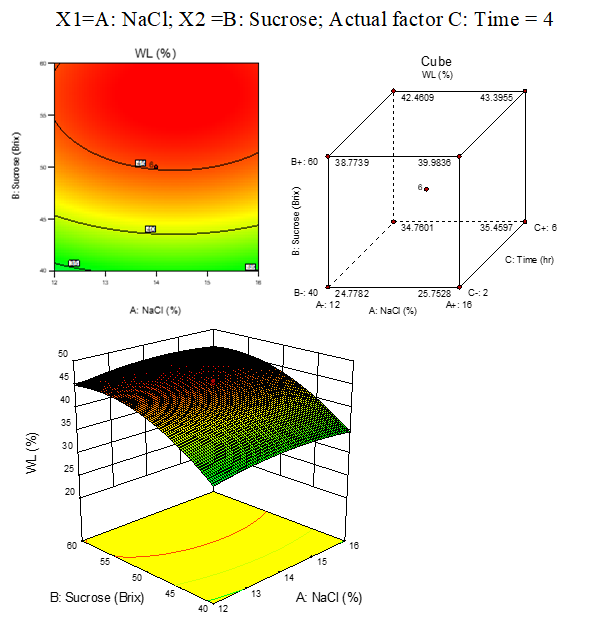
3.7: Effect of osmotic solution of NaCl, sucrose concentration on water loss during osmotic dehydration of beetroot cubes
A.4: Fitting models for RR of beetroot
The results presented in Table 3.13. The Model F-value of 3.26 implies the model is significant. There is only 3.99% chance that F-value will occur due to noise. Values of "Prob > F" less than 0.0500 indicate model terms are significant. In this case B, C are significant model terms. The "Lack of Fit F-value" of 16.02 implies that the Lack of Fit is significant. There is only 0.43% chance that a "Lack of Fit F-value" may occur due to noise.
|
Table – 3.13: ANOVA of response surface quadratic model for rehydration ratio |
||||||
|
Analysis of variance table [Partial sum of squares - Type III] |
||||||
|
Source |
Sum of Squares |
df |
Mean Square |
F Value |
p-value Prob > F |
|
|
Model |
0.97 |
9 |
0.11 |
3.26 |
0.0399 |
significant |
|
A-NaCl |
0.025 |
1 |
0.025 |
0.76 |
0.4044 |
|
|
B-Sucrose |
0.54 |
1 |
0.54 |
16.23 |
0.0024 |
|
|
C-Time |
0.17 |
1 |
0.17 |
5.08 |
0.0478 |
|
|
AB |
1.404E-003 |
1 |
1.404E-003 |
0.042 |
0.8408 |
|
|
AC |
0.13 |
1 |
0.13 |
3.94 |
0.0754 |
|
|
BC |
6.272E-003 |
1 |
6.272E-003 |
0.19 |
0.6723 |
|
|
A2 |
0.033 |
1 |
0.033 |
1.00 |
0.3404 |
|
|
B2 |
6.902E-003 |
1 |
6.902E-003 |
0.21 |
0.6574 |
|
|
C2 |
0.053 |
1 |
0.053 |
1.59 |
0.2357 |
|
|
Residual |
0.33 |
10 |
0.033 |
|
|
|
|
Lack of Fit |
0.31 |
5 |
0.062 |
16.02 |
0.0043 |
significant |
|
Pure Error |
0.019 |
5 |
3.884E-003 |
|
|
|
|
Total |
1.30 |
19 |
|
|
|
|
The final equation in terms of coded factors:
|
RR-2 |
= |
+2.71 |
+0.043 |
* A |
-0.20 |
* B |
-0.11 |
* C |
-0.013 |
* AB |
+0.13 |
|
|
|
* AC |
-0.028 |
* BC |
+0.048 |
* A2 |
-0.022 |
* B2 |
-0.060 |
* C2 |
|
B.4: RR response surface plots of beetroot
Result represented in Fig. 3.8
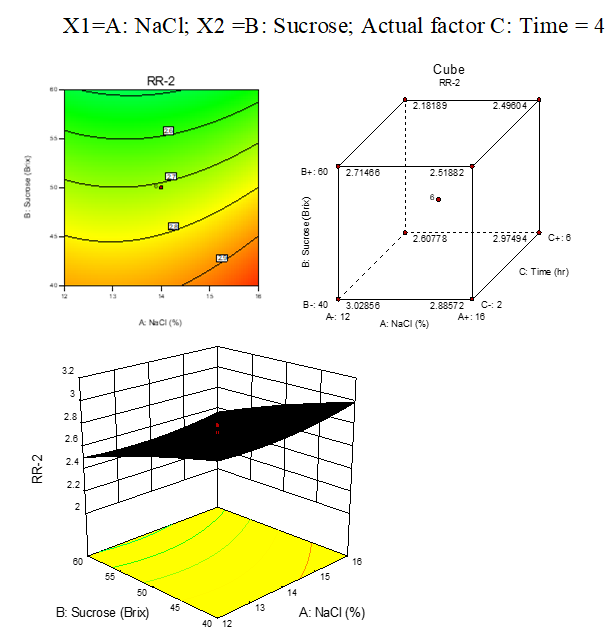
Fig. 3.8: Effect of osmotic solution of NaCl, sucrose concentration on rehydration ratio during osmotic dehydration of beetroot cubes
The investigated data used for the optimization study were obtained using a Box Wilson et al. fractional factorial design (3 level-4 parameter), 20 runs. RSM was effective in optimizing the process of WR, WL, SG and RR by superimposition of the contour plots of all responses. Second-order polynomial (SOP) models for all system responses were statistically analyzed and found significant. Predicted and observed responses of carrot cubes in 50 °Bix of sucrose and 8% w/v NaCl for 4 hours were more significant at osmotic dehydration to achieve WR of 37.34%, SG of 14.33, WL of 51.34, and RR to be 3.176. While in case of beetroot 50°Brix of sucrose + 14% w/v NaCl for 4 hours were more significant at OD to achieve WR of 35.13, SG of 12.19, WL of 46.6, RR to be 3.031 as shown in the figure and table presented earlier, graphical techniques in association with RSM, aided in locating optimum operating conditions, which were experimentally verified and proven to be adequately reproducible.
3.4 SENSORY EVALUATION:
The results of sensory evaluation was represented at Table 3.14 and discussed below.
Table 3.14 Sensory evaluation of different food products.
|
Samples (Carrot & Beetroot Cubes) |
Color and Appearance |
Texture |
Flavor |
Taste |
Overall Acceptability |
|
Fresh |
9.0 |
8.0 |
8.4 |
8.2 |
7.8 |
|
Salt treated |
7.6 |
7.4 |
7.8 |
7.2 |
7.2 |
|
Sucrose treated |
7.4 |
7.6 |
8.0 |
7.8 |
7.4 |
|
Salt + Sucrose treated |
9.0 |
8.2 |
8.2 |
8.4 |
8.0 |
1) Color and Appearance:
Based on the data obtained from sensory evaluation by a panel of 6 member's color of health food formulations were found as 9.0, 7.6, 7.4 and 9.0 respectively on a hedonic scale. The carrot & beetroot cubes have dark orange & blackish-purple respectively, which is more attractive. It was evident that the color was significantly influenced by the difference in formulations of health food.
2) Texture:
Textures of food product formulations were found as 8.0, 7.4, 7.6 and 8.2 respectively. The texture of the product is free-flowing with very slight sickness.
3) Flavor:
It was found that the flavors of the food product formulations were found as 8.4, 7.8, 8.0 and 8.4 respectively. The formulations have a very good flavor.
4) Taste:
It was found that the taste of the Health food formulations was found as 8.2, 7.2, 7.6 and 8.0 respectively. The formulations have a very good taste except the salt-treated.
5) Overall acceptability
It was found that combination of salt + sucrose treated carrot & beetroot cubes were overall more acceptable as compared to salt and sucrose treated carrot and beetroot cubes.
Response Surface Methodology was the most effective for optimizing process parameters for osmotic dehydration of carrot and beetroot cubes in osmotic aqueous solution of sucrose and sodium chloride mixtures in a ratio of 1:5. The recommended process variables were 50 oBrix of sucrose + 8 % w/v aqueous solution of sodium chloride for carrot and 50 oBrix of sucrose + 14 % w/v NaCl solution for beetroot at osmotic dehydration for 4 hours considered to get maximum water loss, weight reduction, subsequent rehydration ratio, overall acceptability and minimum solute gain of rehydrated product. RSM was found to be effective for retaining flavor, odour and enhancing nutritional content. It can be concluded that osmotic dehydration had a positive impact on carrot & beetroot, retaining its nutritional value, flavor, odour, shelf life and preventing spoilage from microbial contamination. Osmotically dehydrated carrot and beetroot cubes can be used in noodles, soup, stews, pickles and casseroles.
The part of the work is financially supported by All India Council for Technical Education in the form of TEQUIP fellowship provided to Mr. Shamsher Ali.
Abbreviations: RSM, Response Surface Methodology; WR, Weight Reduction; SG, Solute Gain; WL, Water Loss; RR, Rehydration Ratio; O.D., Osmotic Dehydration; CCD, Central Composite Design; RT, Room Temperature
Akbarian, M., Ghasemkhani, N., & Moayedi, F. (2014). Osmotic dehydration of fruits in food industrial: A review. Int. J. Biosci, 4(1), 42-57.
View ArticleAra, N., & Nur, H. (2009). In vitro antioxidant activity of methanolic leaves and flowers extracts of Lippia alba. Research journal of medicine and medical sciences, 4(1), 107-110. PMid:19579925
View Article PubMed/NCBIBalaji, M., & Arshinder, K. (2016). Modeling the causes of food wastage in Indian perishable food supply chain. Resources, Conservation and Recycling, 114, 153-167.
View ArticleBahmani, A., Jafari, S. M., Shahidi, S. A., & Dehnad, D. (2016). Mass transfer kinetics of eggplant during osmotic dehydration by neural networks. Journal of food processing and preservation, 40(5), 815-827.
View ArticleBox, G. E., & Wilson, K. B. (1951). On the experimental attainment of optimum conditions. Journal of the royal statistical society: Series b (Methodological), 13(1), 1-38.
View ArticleBox, G. E., & Draper, N. R. (1987). Empirical model-building and response surfaces (Vol. 424). New York: Wiley.
Clifford, T., Bell, O., West, D. J., Howatson, G., & Stevenson, E. J. (2017). Antioxidant-rich beetroot juice does not adversely affect acute neuromuscular adaptation following eccentric exercise. Journal of sports sciences, 35(8), 812-819. PMid:27267689
View Article PubMed/NCBIDi Pietro, N., Di Tomo, P., & Pandolfi, A. (2016). Carotenoids in cardiovascular disease prevention. JSM Atheroscler, 1(1), 1002.
Dolker, D., Bakshi, P., Wali, V. K., Dorjey, S., Kour, K., & Jasrotia, A. (2017). Integrated Nutrient Management in Fruit Production. Int. J. Curr. Microbiol. App. Sci, 6(7), 32-40.
View ArticleGupta, S., Singh, K., & Gupta, V. (2019). Genetic resource conservation of horticultural crops in India-Achievements and issues. Progressive Horticulture, 51(1), 16-29.
View ArticleGupta, N., & Shukla, R. N. (2017). Preparation and Quality Evaluation of Dehydrated Carrot and Onion Slices. Journal of Food Processing & Technology.
View ArticleGonçalves, E. M., Pinheiro, J., Abreu, M., Brandão, T. R., & Silva, C. L. (2010). Carrot (Daucus carota L.) peroxidase inactivation, phenolic content and physical changes kinetics due to blanching. Journal of Food Engineering, 97(4), 574-581.)
View ArticleHandbook on Horticulture Statistics, 2018. Department of Agriculture, Ministry of Agriculture & Farmers' Welfare, Government of India. Government of India.
Kapadia, J G., A Azuine, M., Subba Rao, G., Arai, T., Iida, A., & Tokuda, H. (2011). Cytotoxic effect of the red beetroot (Beta vulgaris L.) extract compared to doxorubicin (Adriamycin) in the human prostate (PC-3) and breast (MCF-7) cancer cell lines. Anti-Cancer Agents In Medicinal Chemistry (Formerly Current Medicinal Chemistry-Anti-Cancer Agents), 11(3), 280-284. PMid:21434853
View Article PubMed/NCBIKobaek-Larsen, M., Nielsen, D. S., Kot, W., Krych, Ł., Christensen, L. P., & Baatrup, G. (2018). Effect of the dietary polyacetylenes falcarinol and falcarindiol on the gut microbiota composition in a rat model of colorectal cancer. BMC research notes, 11(1), 411. PMid:29945666
View Article PubMed/NCBIMadison, D., & Coleman, E. (2007). Preserving Food Without Freezing Or Canning: Traditional Techniques Using Salt, Oil, Sugar, Alcohol, Vinegar, Drying, Cold Storage, and Lactic Fermentation. Chelsea Green Publishing.
Mercali, G. D., Marczak, L. D. F., Tessaro, I. C., & Noreña, C. P. Z. (2011). Evaluation of water, sucrose and NaCl effective diffusivities during osmotic dehydration of banana (Musa sapientum, shum.). LWT-Food Science and Technology, 44(1), 82-91.
View ArticleMudahar G. S., Toledo R. T., Floros J. D. and Jen J. J. (1989). Optimization of carrot dehydration process using response surface methodology. Journal of Food Science Vol. 54, Pp 174-719.
View ArticlePryor, B. M., Davis, R. M., & Gilbertson, R. L. (2000). A toothpick inoculation method for evaluating carrot cultivars for resistance to Alternaria radicina. HortScience, 35(6), 1099-1102.
View ArticleRundla, A., Mishra, A. A., & Shukla, R. N. (2018). Studies on Physical and Organoleptic Properties of Osmotically Dehydrated Carrot (Daucus carota L.) Slices. Int. J. Curr. Microbiol. App. Sci, 7(9), 2457-2468.
View ArticleSingh, R. B., Rastogi, V., Singh, R., Niaz, M. A., Srivastav, S., Aslam, M., ... & Postiglione, A. (1996). Magnesium and antioxidant vitamin status and risk of complications of ageing in an elderly urban population. Magnesium research, 9(4), 299-306.
Singh, D. P., Beloy, J., McInerney, J. K., & Day, L. (2012). Impact of boron, calcium and genetic factors on vitamin C, carotenoids, phenolic acids, anthocyanins and antioxidant capacity of carrots (Daucus carota). Food chemistry, 132(3), 1161-1170. PMid:29243596
View Article PubMed/NCBISingh, A., Verma, S., Singh, V., Nanjappa, C., Roopa, N., Raju, P., & Singh, S. N. (2015). Beetroot juice supplementation increases high density lipoprotein-cholesterol and reduces oxidative stress in physically active individuals. J Pharm Nut Sci, 5(3), 179-85.
View ArticleShah, N. S., & Nath, N. (2008). Changes in qualities of minimally processed litchis: Effect of antibrowning agents, osmo-vacuum drying and moderate vacuum packaging. LWT-Food Science and Technology, 41(4), 660-668.
View ArticleShi J. and Maguer M. L. (2002).Osmotic dehydration of foods, mass transfer and modelling aspects. Food reviews international Vol 18, 2002, Pp 305-335.
View ArticleTan, K. W., Killeen, D. P., Li, Y., Paxton, J. W., Birch, N. P., & Scheepens, A. (2014). Dietary polyacetylenes of the falcarinol type are inhibitors of breast cancer resistance protein (BCRP/ABCG2). European journal of pharmacology, 723, 346-352. PMid:24269959
View Article PubMed/NCBIVenter, G., Haftka, R., & Starnes, Jr, J. (1996). Construction of response surfaces for design optimization applications. In 6th Symposium on Multidisciplinary Analysis and Optimization (p. 4040).
View Article