1. Mingfeng Zheng
Email: vanzheng@163.com
2. Junsheng Fu
Email: fujunsheng81@163.com
© 2019 Sift Desk Journals. All Rights Reserved
VOLUME: 4 ISSUE: 1
Page No: 539-552
Xin Liub‖, Ruolin Houb‖, Yiping Huanga, Kaiqiang Xua, Xiaoping Wuc, Wenxiong Lina, Mingfeng Zhengb,*, Junsheng Fua,*
a College of Life Sciences, Fujian Agriculture and Forestry University, Fuzhou, 350002, China
b College of Food Sciences, Fujian Agriculture and Forestry University, Fuzhou, 350002, China
c Mycological Research Center, College of Life Sciences, Fujian Agriculture and Forestry University, Fuzhou, 350002, China
Jianquan Kan(kanjianquan@163.com)
Seyed Mohammad Taghi Gharibzahedi(smt.gharibzahedi@gmail.com)
Artur Biela(artur.biela@uj.edu.pl)
Nataliya Borzova(nv_borzova@bigmir.net)
Junsheng Fu, Physicochemical properties and the extraction process of natural melanin from Auricularia polytricha(2018)SDRP Journal of Food Science & Technology 4(1)
Auricularia polytricha (A. polytricha) is a kind of edible fungus with high nutritional value, and melanin is one of its main active components. However, the research and application of melanin in A. polytricha has been neglected for a long time. The purpose of this study was to analyse the physicochemical properties of the melanin from A. polytricha and establish a cellulase-ultrasonic synergistic extraction process of A. polytricha melanin by orthogonal array and response surface design. Scanning electron microscopy (SEM), ultraviolet-visible spectroscopy (UV-Vis), infrared spectroscopy (IR), electron paramagnetic resonance spectroscopy (EPR) and elemental analysis were used to characterize the melanin. The stability and antioxidant activity of the melanin were also measured. The results showed that A. polytricha melanin is an eumelanin and displays a bulk amorphous morphology. The melanin had good stability in heat and light, and it also exhibited good antioxidant activity. The optimized extraction process of A. polytricha melanin was as follows: enzyme-to-substrate ratio (E/S) of 1.4%, enzymolysis temperature of 35°C, enzymolysis pH of 4.0, enzymolysis time of 80 min, NaOH concentration of 0.68 mol/L, solid-to-liquid ratio of 1:40 (g/mL), ultrasound power of 350 W, ultrasonic time of 62 min, and ultrasound temperature of 70°C. The results will be helpful for the efficient production of A. polytricha melanin and its application as a food colouring as well as antioxidant agent.
Keywords: Auricularia polytricha, melanin, physicochemical properties, synergistic extraction
Pigment is an important component of food additives. In recent years, natural pigments have become a hot topic of research and development for their high safety, nutritional value and healthy functions [1]. Melanin is a type of irregular pigment that is widely distributed in various organic tissues [2]. There are four types of melanins: eumelanin, pheomelanin, allomelanin and neuromelanin [3]. In vivo, eumelanin is formed by L-tyrosine with the participation of various enzymes [4]. Pheomelanin is a type of red or yellow pigment that is initially synthesized in a manner similar to eumelanin, and with cysteine or glutathione involved in the subsequent synthesis, it contains sulphur [5]. Allomelanin is a heterogeneous group of polymers, which are formed through the oxidative polymerization of dihydroxynaphthalene or tetrahydroxynaphthalene, and it doesn’t contain nitrogen [6]. Neuromelanin is a naturally occurring pigment in the human central nervous system, which is browny-black in appearance, and it is thought to be a mixture of eumelanin and pheomelanin [3]. Melanin has many biological functions, such as oxidation resistance [7], radiation resistance [8], antibacterial activity [9], the adsorption of heavy metal ions [10] and so on. Many edible mushrooms contain melanin, such as Armillaria ostoyae, Inonotus obliquus [11], and Pleurotus cystidiosus [12], which is an important source of natural melanin.
Auricularia polytricha (A. polytricha), also known as wood ear or red ear, is a type of edible mushroom that is widely distributed all over the world [13, 14]. Many A. polytricha are consumed every year in the East Asian countries due to its delicious taste and rich nutritional value, and its annual consumption exceeds one million tons a year in China. A. polytricha is also well-known for its multiple biological activities. Modern pharmacology revealed the promising cholesterol-lowering [15], antioxidant [16], antitumor [17], immunomodulation [18], and hypoglycemic [19] activities of A. polytricha. Melanin is one of the main ingredients of A. polytricha; however, few studies have been reported on the melanin from A. polytricha. The research on A. polytricha melanin is of important scientific and economic significance for the further processing and utilization of A. polytricha.
In this study, the physicochemical properties of A. polytricha melanin were systematically analysed by scanning electron microscopy (SEM), ultraviolet-visible spectroscopy (UV-Vis), infrared spectroscopy (IR), electron paramagnetic resonance spectroscopy (EPR) and elemental analysis. The solubility, stability and antioxidant activities were further explored. On this basis, the method of cellulase-ultrasonic synergistic technology was further used to explore the extraction method of A. polytricha melanin. Cellulase was first used to destroy the cell wall of Auricularia polytricha, and then, melanin was extracted by an ultrasonic-assisted extraction method under alkaline conditions to extract as much melanin as possible.
2.1. Materials and chemicals
The fruiting bodies of A. polytricha were purchased from a local supermarket in Fuzhou, Fujian Province, China. Cellulase, with an enzymatic activity of 50 U/mg, was purchased from the Yuanye Biological Technology Co. (Shanghai, China). The chemical reagents such as 1,1-diphenyl-2-picrylhydrazyl (DPPH) and 2,2’-azino-bis-3-ethylbenzothiazoline-6-sulfonic acid (ABTS) were obtained from Sigma-Aldrich (St. Louis, USA). All other analytical grade chemical reagents were from the Sinopharm Co. (Shanghai, China).
2.2. Melanin preparation and purification
The preparation method of the melanin was according to the methods previously described with slight modifications [20, 21]. Dried A. polytricha powder was mixed with 0.5 mol/L NaOH at a solid-to-liquid ratio of 1:30 and extracted in a 300 W ultrasonic bath system at 30°C for 0.5 h. After that, the supernatant was collected by centrifugation at 9,000 rpm/min for 3 min. The pH of the supernatant was adjusted to 1.5 with 6 M HCl, and it was placed in an 80°C water bath for 10 h to remove carbohydrates and proteins, followed by centrifugation at 9,000 rpm for 5 min to collect the precipitate. The precipitate was washed with distilled water to a pH of 7, and then, it was washed with chloroform, ethyl acetate, 95% ethanol, 75% ethanol and distilled water in sequence three times. Sequentially, the purified pigment was lyophilized and stored at -20°C for further use.
2.3. Morphology, elemental composition and spectroscopic analysis of A. polytricha melanin
2.3.1. Morphology analysis
The morphology of A. polytricha melanin was observed by SEM. The purified melanin was sprayed with gold in a vacuum, scanned, and photographed at an acceleration voltage of 5.0 kV (JEOL, jsm-7500f, Japan).
2.3.2. Elemental analysis
An elemental analyser (Elementar, Germany) was used to analyse the elemental components of the purified melanin.
2.3.3. UV-Vis spectrum
The A. polytricha melanin was dissolved in a 0.1 mol/L NaOH solution to a final concentration of 0.05 mg/mL. The UV-Vis absorption spectrum of the solution was scanned with a UV-Vis spectrophotometer (Unico Instrument Co. Ltd.) in the wavelength range of 200~800 nm, with a 0.1 mol/L NaOH solution as the reference.
2.3.4. FTIR analysis
Mixtures of A. polytricha melanin and KBr (1:100 w/w) were homogenized in an agate mortar, pressed into a tablet and analysed by a FTIR instrument (Bruker VERTEX 80) in the scanning range of 4000–400 cm–1.
2.3.5. EPR analysis
A. polytricha melanin was weighed and placed in a quartz tube. Then, the EPR spectra were scanned in a 25°C and 9.857 Hz high frequency EPR spectrometer (Bruker BioSpin E-500X).
2.4. Solubility and stability of A. polytricha melanin
2.4.1. Solubility analysis
One milligram of A. polytricha melanin was added to 2 ml of different solvents (distilled water, ethanol absolute, methanol, butanol, chloroform, dimethyl sulfoxide, petroleum ether, ethyl acetate, 1 mol/l HCl, 1 mol/l NaOH, 1 mol/L NaCl and pH = 8 disodium hydrogen phosphate-citrate buffer). The sample was fully mixed with various solvents and allowed to stand for 3 hours. The solubility of melanin was measured.
2.4.2. Thermal stability
A total of 0.5 mg of A. polytricha melanin was dissolved in 10 mL of 0.1 mol/L NaOH solution and incubated at different temperatures (25, 50, 75 and 100°C). Samples were collected once per hour and cooled to room temperature. The absorbance was measured at 220 nm with 0.1 mol/L NaOH solution as the reference.
2.4.3. Light stability
The photostability of A. polytricha melanin was studied under different illumination conditions. Melanin (0.5 mg) was dissolved in a NaOH solution of 0.1 mol/L and then exposed to darkness, natural light and 20,000 lux light, respectively. The sample was collected once per 12 h, and the absorbance was measured at 220 nm.
2.4.4. Metal ion stability
A. polytricha melanin (0.5 mg) was added to 10 mL of a 0.1 mol/L NaOH solution with 0.01 mol/L metal ions (Ca2+, Fe2+, Zn2+, Na+, Al3+, K+ and Fe3+). A sample was collected every 12 h, and the absorbance was measured at 220 nm.
2.4.5. Stability in oxidants and reductants
A total of 5 mL of different concentrations of reducing agent (Na2SO3) and oxidant (H2O2) was added to 5 mL of 0.05 mg/mL A. polytricha melanin solution to make the final concentrations of the oxidant or reductant 0%, 3%, 6%, 9%, 12% and 15%, respectively. The solutions were fully mixed and left to stand for 30 minutes, and the absorbance was determined at 220 nm with 0.1 mol/L NaOH solution as a reference. Additionally, 2 mL of a 1 mg/mL KMnO4 solution was thoroughly mixed with 2 mL of 0.05 mg/mL melanin and left to stand for 30 minutes at room temperature. Then, the discoloration of the KMnO4 solution was observed.
2.5. Antioxidant activities of A. polytricha melanin
2.5.1. Preparation of water-soluble melanin
Water-soluble melanin was prepared according to the methods previously described [22] and used for the antioxidant experiment. Purified melanin was dissolved in a 0.1 M NaOH aqueous solution, and the pH was adjusted to 7 with 0.1 M HCl solution under strong sonication. After dialysis and lyophilization, the water-soluble melanin was obtained.
2.5.2. DPPH radical scavenging activity
The scavenging activity of A. polytricha melanin for the DPPH radical was measured according to the method previously described [23]. First, 2 mL of different concentrations of the A. polytricha melanin solution was added into 2 mL of 0.2 mM DPPH absolute ethanol solution, fully mixed and placed in darkness for 30 min; then, the absorbance was measured at 517 nm (A1). Additionally, the DPPH solution was replaced with an equal volume of absolute ethanol, and the absorbance was measured (A2). The melanin solution was also replaced with an equal volume of distilled water, and the absorbance was measured (A0). The ability to scavenge the DPPH radical was calculated using the following equation (1):
〖Scavenging activity 〗(%)=[1-(A1-A2)/A0 ]×100 (1)
2.5.3. Hydroxyl radical scavenging activity
The hydroxyl radical scavenging rate was determined by the salicylic acid-FeSO4 method [24]. A total of 1 mL of 9 mmol/L salicylic acid-ethanol solution, 9 mmol/L FeSO4 solution, different concentrations of melanin solution, and 8.8 mmol/L H2O2 solution were completely mixed, and then, the volume to made up to 15 mL with distilled water. The sample was placed at 37°C for 15 min, and the absorbance was measured at 510 nm (A1). Instead of the H2O2, the solution was mixed with an equal volume of distilled water, and the absorbance was measured (A2). Additionally, the A. polytricha melanin solution was replaced with an equal volume of distilled water, and the absorbance was measured (A0). The hydroxyl radical scavenging rate was calculated according to equation (1).
2.5.4. ABTS radical scavenging activity
The ABTS radical cation (ABTS+) test was performed according to the methods previously described [25]. A total of 5 mL of 7 mmol/L ABTS solution was mixed with 88 μL of 2.45 mmol/L potassium persulphate and placed in the dark at room temperature for 16 hours to prepare an ABTS stock solution. Then, the ABTS stock solution was diluted with ethanol to the absorbance of 0.74±0.02 at 734 nm to form an ABTS working solution. A total of 3 mL of ABTS+ working solution was thoroughly mixed with 0.2 mL of A. polytricha melanin and incubated at room temperature under dark conditions for 1 h. The absorbance was measured at 734 nm (A1). The ABTS+ working solution was replaced with an equal volume of distilled water, and the absorbance was measured (A2). Additionally, the A. polytricha melanin solution was replaced with an equal volume of distilled water, and the absorbance was measured (A0). The ABTS radical scavenging rate was calculated according to equation (1).
2.6. Optimization of the cellulase-ultrasonic synergistic extraction process of A. polytricha melanin
2.6.1. Determination of the A. polytricha melanin content
The maximum absorption wavelength was determined from the UV-Vis absorption spectrum of the purified melanin, and the concentration-absorbance standard curve was plotted at the maximum absorption wavelength (220 nm). In the same manner, the absorbance of the extract at the maximum wavelength was measured, and the melanin concentration was calculated from the standard curve. The yield of melanin was calculated by formula (2), where w0 is the weight of the extracted melanin and M is the weight of A. polytricha fruiting body.
〖The yield of melanin〗(%)=w0/(M ) ×100 (2)
2.6.2. Optimization of the enzymatic hydrolysis conditions
A. polytricha powder was added into a buffer solution containing cellulase and reacted at a suitable temperature for a certain period. After that, centrifugation at 9,000 rpm/min for 5 min was performed to collect the precipitate. Then, the NaOH solution was added to the precipitate to extract the melanin in an ultrasonic bath system. The effects of the enzyme-to-substrate ratio (E/S) (0.8-1.8%), enzymolysis temperature (30-55°C), enzymolysis pH (3.5-6.0), and enzymolysis time (20-120 min) were investigated by single-factor experiments under the premise of constant ultrasonic conditions (ultrasound temperature of 30°C, ultrasound time of 30 min, ultrasound power of 300 W, solid-to-liquid ratio of 1:30 and NaOH concentration of 0.5 mol/L). The effect of each factor was investigated by analysing the content of melanin.
According to the results of single-factor experiments of enzymatic hydrolysis, a L9 (34) orthogonal matrix was selected to optimize the enzymatic hydrolysis conditions, and the level settings of individual factors are shown in Table 3. All of the experiments were repeated in triplicate, and the average yield was calculated.
2.6.3. Optimization of the ultrasonic extraction conditions
In order to further improve the yield of melanin from A. polytricha, the ultrasonic extraction conditions were further explored on the basis of the optimal conditions of enzymatic hydrolysis. The effects of the NaOH concentration (0.3-1.3 mol/L), solid-to-liquid ratio (1:10-1:60), ultrasound time (20-80 min), ultrasound power (250-500 W) and ultrasound temperature (20-80°C) were investigated by single-factor experiments.
According to the results of single-factor experiments of the ultrasonic extraction process, based on the Box-Behnken centre combination principle and the level settings of individual factors in Table 4, Design-Expert 8.0.6 software (Stat-Ease Inc., Minneapolis, MN, USA) was used to design the ultrasonic extraction process of A. polytricha melanin.
2.7. Data analysis
Experimental data were analysed by Design Expert software 8.0.6 (Stat-Ease Inc., Minneapolis, MN, USA) and SPSS 13.0 (SPSS Inc., Chicago, IL). All experiments were repeated at least three times. The resulting values are presented as the mean±standard deviation, where p<0.05 indicates a statistically significant difference and p<0.01 indicates a highly statistically significant difference.
3.1 Morphology, elemental composition and spectroscopic analysis of A. polytricha melanin
3.1.1 SEM and elemental analysis
The result of SEM is shown in Fig. 1A. The A. polytricha melanin was characterized as an amorphous deposit without differentiable structures, which is similar to those of other melanins [26].
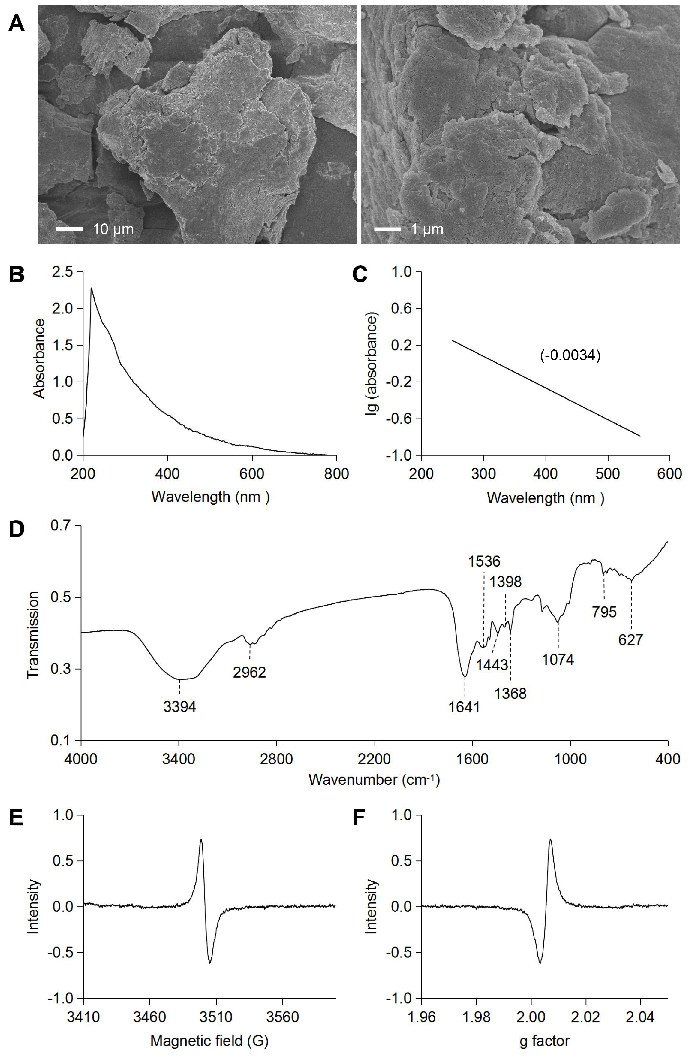
Figure 1. Morphology and spectroscopy analysis of A. polytricha melanin. (A) SEM analysis of melanin; (B, C) UV-Vis absorption spectrum of melanin; (D) IR spectrum of melanin; and (E, F) EPR spectrum of melanin.
As shown in Table 1, the results of elemental analysis showed that the melanin from A. polytricha contains C, H, N, and O elements. No S element was found in the melanin from A. polytricha fruiting bodies, indicating that the melanin could be classified as eumelanins [27]. Compared with synthetic melanin, the proportion of O:N in A. polytricha melanin was higher, which indicates a higher carboxylate content in the melanin.
Table 1 Elemental analysis of A. polytricha melanin
|
Source |
Element composition (%) |
||||
|
C |
H |
N |
O |
S |
|
|
A. polytricha melanin |
42.12 |
7.14 |
8.70 |
42.04 |
0.00 |
|
Synthetic melanina |
56.45 |
3.15 |
8.49 |
31.82 |
0.09 |
aAs reported by Ito and Fujita [45].
The content of oxygen element was calculated from the equation: O%=100%-C%-H%-N%-S%.
3.1.2 UV-Vis absorption spectrum
The maximum absorption of A. polytricha melanin was 220 nm, the absorption of A. polytricha melanin decreases as the wavelength increases, and the log of absorbance against wavelength produces a linear curve with a negative slope of -0.0034 (Fig. 1B, C), which is a characteristic property of melanin [28-30]. This is due to the existence of complex conjugated structures in the molecules of melanin [31]. There is a small absorption peak at 260 nm to 280 nm, indicating that a small portion of proteins or lipids is present in the molecule of A. polytricha melanin.
3.1.3 IR spectrum
The infrared absorption spectrum is one of the most important spectral characteristics of melanin. The IR spectrum of the A. polytricha melanin is shown in Fig. 1D. The IR spectrum of A. polytricha melanin was analysed based on previous studies, and the results suggest the following peak assignments: the strong and broad characteristic absorption at ~3300 cm-1 corresponds to the O-H groups linked by the N–H groups of an indole ring [32]; the small and sharp peaks at 2920~2950 cm-1 correspond to the aliphatic C-H [33]; characteristic absorption at 1641 cm-1 corresponds to the C=O stretching or aromatic C=C stretching [34]; the peak at 1536 cm-1 is related to the N-H bending vibration, and that at 1398 cm-1 is attributed to a C-N stretching, indicating that it has the typical indole structure of melanin [35]. The absorption band of 600-800 cm-1 is weak, meaning that the aromatic ring has been replaced to form a conjugated system.
3.1.4 EPR spectrum
The characteristic behaviour of EPR is another feature of melanin due to the presence of organic free radicals [36]. The EPR spectrum of the A. polytricha melanin is presented in Fig. 1E, F. The patterns appeared to have a similar morphology to some melanin that has been reported, such as the water-soluble microbial melanin [37] and the melanin from tetrahydropapaveroline [38]. The spectrum of A. polytricha melanin was a slightly asymmetric singlet without hyper-fine structure.
Table 2: Solubility of A. polytricha melanin
|
Types |
Solvent |
Solubility |
|
Water |
Distilled water |
- |
|
Organic solvents |
Absolute ethanol Methanol Butanol Chloroform Dimethyl sulfoxide Petroleum ether Ethyl acetate |
- - - - + - - |
|
Acid |
1mol/L HCl |
- |
|
Alkali |
1mol/L NaOH |
+ + |
|
Salt |
1mol/L NaCl pH8 disodium hydrogen phosphate-citrate buffer |
- - |
Note: + indicates slightly soluble, + + indicates dissolved, and - indicates insoluble.
3.2 Physicochemical properties of A. polytricha melanin
3.2.1 Solubility and stability properties
As shown in Table 2 and Fig. 2A, A. polytricha melanin has good solubility in alkaline solution (such as NaOH solution), but low solubility in distilled water and other organic solvents, which was similar to melanins from other microorganisms [39, 40]. The effects of the temperature and light on melanin stability are shown in Fig. 2B, C, and the results showed that high temperature and strong light had a certain influence on the stability of the melanin, but the effects were small. As shown in Fig. 2D, the melanin also had better stability in metal ion solutions. As shown in Fig. 2E, F, A. polytricha melanin has good stability in the reducing agent Na2SO3, but it is less stable in the oxidizing agent H2O2, and A. polytricha melanin also made the oxidant KMnO4 solution fade.

Figure 2. Solubility, stability properties and antioxidant activity of A. polytricha melanin. (A) Solubility properties of melanin: the serial numbers of each solvent on the test tube were distilled water, absolute ethanol, methanol, butanol, chloroform, dimethyl sulfoxide, petroleum ether, ethyl acetate, 1 mol/l HCl, 1 mol/l NaOH, 1 mol/L NaCl and pH8 disodium hydrogen phosphate-citrate buffer; (B) thermal stability of melanin; (C) photostability of melanin; (D) metal ion stability of melanin; (E) redox properties of melanin in Na2SO3 and H2O2; (F) melanin bleached KMnO4 solution: the serial numbers of each solvent on the test tube were 0.05 mg/mL A. polytricha melanin solution, 1 mg/mL KMnO4+0.05 mg/mL A. polytricha melanin solution, 1 mg/mL KMnO4 solution; and (G) antioxidant activity of A. polytricha melanin.
Table 3: Factors and levels of enzymatic hydrolysis orthogonal array design
|
Factor |
Level |
||
|
-1 |
0 |
1 |
|
|
Enzyme-to-substrate ratio (%) |
1.2 |
1.4 |
1.6 |
|
Enzymolysis temperature (°C) |
35 |
40 |
45 |
|
Enzymolysis pH |
3.5 |
4.0 |
4.5 |
|
Enzymolysis time (min) |
40 |
60 |
80 |
Table 4: Factors and levels for Box-Behnken design
|
Factor |
Code |
Level |
||
|
-1 |
0 |
1 |
||
|
NaOH concentration (moL/L) |
A |
0.5 |
0.7 |
0.9 |
|
Ultrasound power (W) |
B |
300 |
350 |
400 |
|
Ultrasound time (min) |
C |
50 |
60 |
70 |
Table 5: Result of orthogonal array design
|
No |
Enzyme-to-substrate ratio (%) |
Enzymolysis temperature (°C) |
Enzymolysis pH |
Enzymolysis time (min) |
Yield (%) |
|
1 |
-1 (1.2) |
-1 (35) |
-1 (3.5) |
-1 (40) |
4.95±0.05 |
|
2 |
-1 (1.2) |
0 (40) |
0 (4.0) |
0 (60) |
5.24±0.11 |
|
3 |
-1 (1.2) |
1 (45) |
1 (4.5) |
1 (80) |
4.52±0.12 |
|
4 |
0 (1.4) |
-1 (35) |
0 (4.0) |
1 (80) |
5.72±0.15 |
|
5 |
0 (1.4) |
0 (40) |
1 (4.5) |
-1 (40) |
4.99±0.11 |
|
6 |
0 (1.4) |
1 (45) |
-1 (3.5) |
0 (60) |
4.48±0.06 |
|
7 |
1 (1.6) |
-1 (35) |
1 (4.5) |
0 (60) |
5.12±0.12 |
|
8 |
1 (1.6) |
0 (40) |
-1 (3.5) |
1 (80) |
5.03±0.09 |
|
9 |
1 (1.6) |
1 (45) |
0 (4.0) |
-1 (40) |
3.79±0.10 |
|
K-1 |
14.71 |
15.78 |
14.46 |
13.72 |
|
|
K0 |
15.19 |
15.26 |
14.75 |
14.84 |
|
|
K1 |
13.93 |
12.79 |
14.63 |
15.27 |
|
|
R |
0.42 |
1.00 |
0.10 |
0.52 |
|
Table 6: Variance analysis for the result of orthogonal array design
|
Source |
Sum of squares |
df |
Mean square |
F |
Significance |
|
Enzyme-to-substrate ratio (%) |
0.805 |
2 |
0.402 |
24.674 |
<0.001 |
|
Enzymolysis temperature (°C) |
5.090 |
2 |
2.545 |
156.014 |
<0.001 |
|
Enzymolysis pH |
0.044 |
2 |
0.022 |
1.358 |
0.282 |
|
Enzymolysis time ( min) |
1.271 |
2 |
0.635 |
38.954 |
<0.001 |
|
Error |
0.294 |
18 |
0.016 |
|
|
|
Corrected total |
7.594 |
26 |
|
|
|
3.2.2 Antioxidant activities
DPPH is a stable free radical in organic solvents, and it is widely used to determine the antioxidant capacity of biological samples and foods [41]. The body produces hydroxyl radicals during the metabolic process, which can cause membrane peroxidation, protein cross-linking denaturation and nucleic acid damage, and hydroxyl radicals are recognized as the most toxic type of free radical [42]. Avoiding the influence of the hydroxyl radical is important in the biological, food and other fields. ABTS will form a stable blue-green cationic water-soluble free radical ABTS+ after oxidation. Antioxidants can react with ABTS+ radicals to fade the solution and decrease the characteristic absorbance [43]. As shown in Fig. 2G, the free radical scavenging activity of A. polytricha melanin increased with increasing concentrations, exhibiting a dose dependence. When the concentration was 4 mg/mL, the DPPH, hydroxyl radical, and ABTS scavenging rates of A. polytricha melanin reached 52.48%, 52.50%, and 96.62%, respectively.
3.3 Optimization of the cellulase-ultrasonic synergistic extraction process conditions
3.3.1 Optimization of the enzymatic hydrolysis conditions
The effect of the enzyme-to-substrate ratio (E/S), enzymatic hydrolysis temperature, enzymatic hydrolysis pH, and enzymatic hydrolysis time were investigated by single-factor experiments. As shown in Fig. 3A, the yield of melanin increased gradually with the increase of the E/S and reached the highest value when the E/S was 1.4%. After this, the yield did not increase further. Therefore, it is suitable to extract A. polytricha melanin with an E/S of 1.4%. As shown in Fig. 3B, the yield of melanin reached its highest value when the enzymolysis temperature was 40°C. Too high of a temperature will lead to a change in the spatial structure of the enzyme, resulting in the loss of activity, thus affecting the extraction efficiency. Therefore, it is suitable to extract melanin from A. polytricha with an enzymolysis temperature of 40 °C. As shown in Fig. 3C, the melanin yield was highest at pH of 4.0. Peracid or overbased solutions will inhibit the activity of cellulase, and thus affect the enzymolysis efficiency. Therefore, it is suitable to extract melanin from A. polytricha with an enzymolysis pH of 4.0. As shown in Fig. 3D, the yield of melanin increased with the increase of the enzymolysis time, and it reached the maximum at 60 min. Therefore, it is more appropriate to choose an enzymolysis time of 60 min.
Orthogonal array design was performed on the basis of single factor experiments to screen the optimal combination of enzymolysis conditions, and the results are shown in Table 5, the extreme difference (K) was applied to analyse the data, and the influence (R) of the enzymolysis conditions on the yield of A. polytricha melanin was as follows enzymolysis temperature > enzymolysis time > enzyme-to-substrate ratio > enzymolysis pH. The optimal combination was as follows: as enzyme-to-substrate ratio of 1.4%, an enzymolysis temperature of 35°C, an enzymolysis pH of 4.0, and an enzymolysis time of 80 min. To verify whether individual factors have a statistically significant effect on the melanin yield, ANOVA was used to interpret the experimental data obtained from the orthogonal array design, and the results are shown in Table 6. By comparing the F values, the order of the significant differences among the four factors was enzymolysis temperature > enzymolysis time > enzyme-to-substrate ratio > enzymolysis pH, which was consistent with the intuitive analysis results.
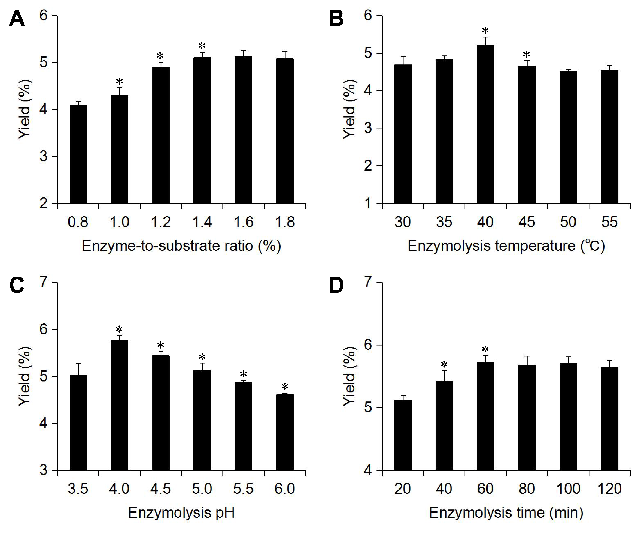
Figure 3. The effect of each enzymolysis variable on the yield of A. polytricha melanin. (A) Enzyme-to-substrate ratio; (B) enzymolysis temperature; (C) enzymolysis pH; and (D) enzymolysis time. Compared with the previous conditions, *p< 0.05.
3.3.2 Optimization of the ultrasonic extraction conditions
To further improve the yield of melanin from A. polytricha, the ultrasonic extraction conditions were explored on the basis of the optimal conditions of enzymatic hydrolysis. Experiments were designed to assess the impact of every single factor (NaOH concentration, solid-to-liquid ratio, ultrasound time, ultrasound power, and ultrasound temperature) on the yield of A. polytricha melanin. As shown in Fig. 4A, when the concentration of NaOH was 0.7 mol/L, the yield of melanin reached the maximum. After this, the yield began to decline. Therefore, a NaOH concentration of 0.5-0.9 mol/L was selected for further experiments.
As shown in Fig. 4B, the yield of melanin increased with the increase in solid-to-liquid ratio and remains unchanged after it reached 1:40 (g/mL). This is because, within a certain range, increasing the volume of the solvent will help to increase the contact area between the solvent and materials so that the melanin can be better dissolved. However, continuously increasing the extraction volume will result in saturation of the dissolution. Hence, 1:40 was selected for further experiments.
As shown in Fig. 4C, the extraction rate of melanin increased as the temperature increased and remains unchanged after 70°C. Excessive extraction temperatures may lead to an increase of energy consumption, and the decrease in the biological activity of melanin. Therefore, it is more suitable to extract the melanin at 70°C.
The effect of the ultrasound power on the yield of melanin is shown in Fig. 4D. The yield of melanin increased when the extraction time increased from 250 W to 350 W and started to decrease when the power reached 400 W. A higher ultrasound power will produce strong cavitation and shearing effects. These strong effects can not only damage the cell wall but also lead to the degradation of extracts. When the degradation rate of melanin exceeds the extraction rate, the yield of melanin will decrease. Thus, 300-400 W was selected for the further experiments.
The effect of the ultrasound time on the yield of melanin is shown in Fig. 4E. When the ultrasound time increased from 20 min to 60 min, the yield of melanin increased significantly, and it decreased slightly when the extraction time increased to 70 min. This indicated that an excessively long ultrasound time may lead to the degradation of melanin. Consequently, an ultrasound time of 50-70 min was used in the RSM experiments.
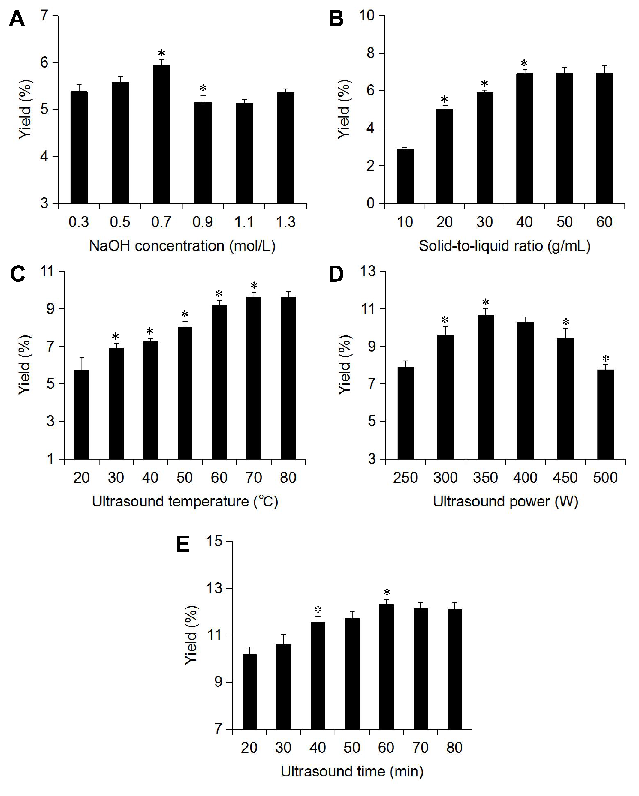
Figure 4. The effect of each ultrasonic variable on the yield of A. polytricha melanin. (A) NaOH concentration; (B) solid-to-liquid ratio; (C) ultrasound temperature; (D) ultrasound power; and (E) ultrasound time. Compared with the previous conditions, *p< 0.05.
Single-factor experiments showed that the three factors of NaOH concentration, ultrasound time and ultrasound power have a great influence on the yield of A. polytricha melanin. Under the premise that the solid-to-liquid ratio was 1:40 and the ultrasound temperature was 70°C, 17 experiments were designed and carried out by Box-Behnken design, and the experimental results are listed in Table 7.
Table 7: Result of Box-Behnken design
|
No |
A: NaOH Concentration (mol/L) |
B: Ultrasound power (W) |
C: Ultrasound time (min) |
Yield/% |
|
1 |
-1 (0.5) |
0 (350) |
-1 (50) |
11.42±0.19 |
|
2 |
-1 (0.5) |
1 (400) |
0 (60) |
11.82±0.19 |
|
3 |
0 (0.7) |
0 (350) |
0 (60) |
12.45±0.26 |
|
4 |
0 (0.7) |
0 (350) |
0 (60) |
12.60±0.24 |
|
5 |
0 (0.7) |
1 (400) |
1 (70) |
12.07±0.09 |
|
6 |
1 (0.9) |
0 (350) |
-1 (50) |
11.66±0.31 |
|
7 |
0 (0.7) |
1 (400) |
-1 (50) |
11.98±0.24 |
|
8 |
0 (0.7) |
0 (350) |
0 (60) |
12.80±0.26 |
|
9 |
0 (0.7) |
-1 (300) |
1 (70) |
11.36±0.35 |
|
10 |
1 (0.9) |
0 (350) |
1 (70) |
11.50±0.23 |
|
11 |
1 (0.9) |
-1 (300) |
0 (60) |
10.62±0.13 |
|
12 |
0 (0.7) |
0 (350) |
0 (60) |
12.49±0.29 |
|
13 |
0 (0.7) |
0 (350) |
0 (60) |
12.72±0.21 |
|
14 |
-1 (0.5) |
-1 (300) |
0 (60) |
11.35±0.06 |
|
15 |
1 (0.9) |
1 (400) |
0 (60) |
11.57±0.11 |
|
16 |
0 (0.7) |
-1 (300) |
-1 (50) |
11.20±0.18 |
|
17 |
-1 (0.5) |
0 (350) |
1 (70) |
12.01±0.33 |
A quadratic polynomial regression model equation (3) was generated by fitting and analysing the data in Table 7. The relationship between the melanin yield (Y) and three variables was described as follows.
Y=12.61-0.16A+0.36B+0.085C+0.12AB-0.19AC-0.018BC-0.64A2-0.63B2-0.33C2 (3)
Analysis of variance (ANOVA) was performed to evaluate the validity of the fitting model, and the result is shown in Table 8. The F-value of the model was 28.79 and was associated with the lower p-value (0.0001), suggesting that the resulting model is significant. The determination coefficient value (R2) of 0.9737 and the adjusted determination coefficient value (Adj. R2) of 0.9399 indicated a good correlation between the response value and the independent variables. Moreover, the “lack of fit test” verifies the accuracy of the model. The low F-value (F = 1.02) and high p-value (0.4714) of the “lack of fit” indicated that the model is suitable for the accurate prediction of variation [44].
Table 8: ANOVA of the fitted polynomial quadratic model
|
Source |
Sum of squares |
Df |
Mean squares |
F |
P |
|
Model |
9 |
5.77 |
0.64 |
28.79 |
0.0001 |
|
A |
1 |
0.2 |
0.2 |
8.77 |
0.0211 |
|
B |
1 |
1.06 |
1.06 |
47.51 |
0.0002 |
|
C |
1 |
0.058 |
0.058 |
2.59 |
0.1513 |
|
A2 |
1 |
1.72 |
1.72 |
77.05 |
< 0.0001 |
|
B2 |
1 |
1.69 |
1.69 |
75.85 |
< 0.0001 |
|
C2 |
1 |
0.45 |
0.45 |
20.08 |
0.0029 |
|
AB |
1 |
0.058 |
0.058 |
2.59 |
0.1519 |
|
AC |
1 |
0.14 |
0.14 |
6.31 |
0.0403 |
|
BC |
1 |
1.23E-03 |
1.23E-03 |
0.055 |
0.8213 |
|
Lack of fit |
3 |
6.80E-02 |
2.30E-02 |
1.02 |
0.4714 |
|
Residual error |
7 |
0.16 |
0.022 |
R2= 0.9737 |
|
|
Pure error |
4 |
0.088 |
0.022 |
Adj R2=0.9399 |
|
|
Total |
16 |
5.93 |
|
||
The response surface curves described by the regression model were established, and the corresponding three-dimensional response surfaces are shown in Fig. 5. Each response surface curve represents the influence of two independent variables on the optimal level of the third variable.
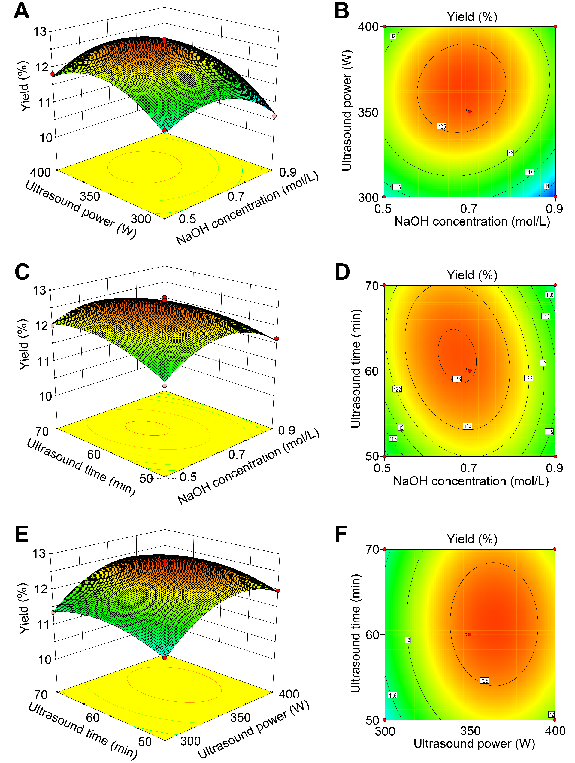
Figure 5. The 3D response surface and 2D contour plots showing the effects of extraction factors on the yield of melanin. (A, B) NaOH concentration and ultrasound power; (C, D) NaOH concentration and ultrasound time; and (E, F) ultrasound power and ultrasound time.
Through the analysis of the quadratic polynomial regression model, the optimal extraction conditions were obtained as follows: NaOH concentration of 0.68 mol/L, ultrasound power of 363.67 W, and ultrasound time of 61.58 min. Under the optimal conditions, the melanin yield was predicted to be 12.67%. In order to verify the accuracy of the model, combined with the feasibility of practical operation, a NaOH concentration of 0.68 mol/L, ultrasound time of 62 min, ultrasound power of 350 W, solid-to-liquid of 1:40 (g/mL), and extraction temperature of 70°C were selected for the verification experiment. The yield of melanin in the verification experiment was 12.64±0.23%, which was in good agreement with the predicted value.
3.3.3 Comparison of cellulase-ultrasonic synergistic extraction and other extraction methods
To verify the effectiveness of the cellulase-ultrasonic synergistic extraction of A. polytricha melanin, we compared the cellulase-ultrasonic synergistic extraction with other extraction methods such as conventional NaOH solution extraction and ultrasonic-assisted extraction. In these experiments, one of the factors was changed, while the other factors remained unchanged. As shown in Table 9, the results showed that the yield of melanin by cellulase-ultrasonic synergistic extraction increased by 21.84%, 13.16%, and 9.63% compared with conventional NaOH solution extraction, ultrasonic-assisted extraction, and cellulase-assisted extraction. The results indicated that cellulase-ultrasonic synergistic extraction is an effective extraction method for extracting the melanin from A. polytricha.
Table 9: Comparison of the melanin yield between cellulase-ultrasonic synergistic
|
Extraction methods |
Yield (%) |
|
Enzyme+Ultrasound |
12.64±0.23 |
|
No enzyme+Ultrasound |
11.17±0.13 |
|
No enzyme+No ultrasound |
9.88±0.15 |
|
Enzyme+No ultrasound |
11.53±0.19 |
In this study, a type of pigment was isolated from the fruiting body of A. polytricha, and the pigment can be identified as melanin. It revealed that the maximum UV-Vis absorption wavelength of melanin was 220 nm. The melanin could be classified as eumelanin, and the morphology of melanin was blocky and amorphous. The EPR spectrum of melanin had a typical single-line micro quotient spectrum, which was very similar to other natural melanins. The melanin has good thermal stability and light resistance, good stability to most metal ions, and also shows antioxidant activity. On this basis, we further explored the cellulase-ultrasonic synergistic extraction process of A. polytricha melanin. The optimal extraction parameters were as follows: enzyme-to-substrate ratio of 1.4%, enzymolysis temperature of 35°C, enzymolysis pH of 4.0, enzymolysis time of 80 min, NaOH concentration of 0.68 mol/L, ultrasound time of 62 min, ultrasound power of 350 W, solid-to-liquid ratio of 1:40 (g/mL), and ultrasound temperature of 70°C. Under the optimum conditions, the yield of melanin was 12.64±0.23%. The result will be helpful for the efficient production of A. polytricha melanin and its application as a food colouring agent and antioxidant agent.
This work was financially supported by the National Key R&D Program of China (2018YFD0400200), the National Natural Science Foundation of China (81503187), and the Modern Seed Industry Engineering Institute Construction Funding of Fujian Agricultural and Forestry University.
Yolmeh M, Habibi Najafi MB, Farhoosh R. Optimisation of ultrasound-assisted extraction of natural pigment from annatto seeds by response surface methodology (RSM). Food Chem. 2014;155:319-24. PMid:24594191
View Article PubMed/NCBIHarki E, Talou T, Dargent R. Purification, characterisation and analysis of melanin extracted from Tuber melanosporum Vitt. Food Chem. 1997;58:69-73. 00215-4
View ArticleFedorow H, Tribl F, Halliday G, Gerlach M. Neuromelanin in human dopamine neurons: Comparison with peripheral melanins and relevance to Parkinson's disease. Progress in Neurobiology. 2005;75:109-24. PMid:15784302
View Article PubMed/NCBIIto S. A Chemist's View of Melanogenesis. Pigment Cell Melanoma Res. 2010;16:230-6.
View ArticleNappi AJ, Ottaviani E. Cytotoxicity and cytotoxic molecules in invertebrates. Bioessays. 2000;22:469-80. 1521-1878(200005)22:5<469::AID-BIES9>3.0.CO;2-4
View ArticlePlonka PM, Grabacka M. Melanin synthesis in microorganisms--biotechnological and medical aspects. Acta Biochim Pol. 2006;53:429-43. PMid:16951740
PubMed/NCBIDe CRGR, Pombeiro-Sponchiado SR. Antioxidant activity of the melanin pigment extracted from Aspergillus nidulans. Biol Pharm Bull. 2005;28:1129-31.
View ArticleGauslaa Y, Solhaug KA. Fungal melanins as a sun screen for symbiotic green algae in the lichen Lobaria pulmonaria. Oecologia. 2001;126:462-71. PMid:28547230
View Article PubMed/NCBILi B, Li W, Chen X, Jiang M. In vitro antibiofilm activity of the melanin from Auricularia auricula , an edible jelly mushroom. Ann Microbiol. 2012;62:1523-30.
View ArticleThaira H, Raval K, Manirethan V, Balakrishnan RM. Melanin nano-pigments for heavy metal remediation from water. Sep Sci Technol. 2018:1-10.
View ArticleRibera J, Panzarasa G, Stobbe A, Osypova A. Scalable biosynthesis of melanin by the basidiomycete Armillaria cepistipes. Journal of Agricultural and Food Chemistry. 2018. PMid:30541276
View Article PubMed/NCBISelvakumar PR, S, Periasamy K, Raaman N. Isolation and characterization of melanin pigment from Pleurotus cystidiosus (telomorph of Antromycopsis macrocarpa). World Journal of Microbiology & Biotechnology. 2008;24:2125-31.
View ArticleMau JL, Chao GR, Wu KT. Antioxidant properties of methanolic extracts from several ear mushrooms. J Agric Food Chem. 2001;49:5461-7. PMid:11714344
View Article PubMed/NCBIYu M, Xu X, Qing Y, Luo X. Isolation of an anti-tumor polysaccharide from Auricularia polytricha (jew's ear) and its effects on macrophage activation. Eur Food Res Technol. 2009;228:477-85.
View ArticleZhao S, Rong C, Liu Y, Xu F. Extraction of a soluble polysaccharide from Auricularia polytricha and evaluation of its anti-hypercholesterolemic effect in rats. Carbohydr Polym. 2015;122:39-45. PMid:25817640
View Article PubMed/NCBISun Y, Li T, Liu J. Structural characterization and hydroxyl radicals scavenging capacity of a polysaccharide from the fruiting bodies of Auricularia polytricha. Carbohydr Polym. 2010;80:377-80.
View ArticleWang J, Li X, Song G. An efficient separation method of polysaccharides: preparation of an antitumor polysaccharide APS-2 from Auricularia polytricha by radial flow chromatography. Chromatographia. 2013;76:629-33.
View ArticleSheu F, Chien PJ, Chien AL, Chen YF. Isolation and characterization of an immunomodulatory protein (APP) from the Jew's Ear mushroom Auricularia polytricha. Food Chem. 2004;87:593-600.
View ArticleWu NJ, Chiou FJ, Weng YM, Yu ZR. hypoglycemic effects of hot water extract from (wood ear mushroom). Int J Food Sci Nutr. 2014;65:502-6. PMid:24524622
View Article PubMed/NCBIWu Y, Shan L, S, Ma A. Identification and antioxidant activity of melanin isolated from Hypoxylon archeri, a companion fungus of Tremella fuciformis. J Basic Microbiol. 2008;48:217-21. PMid:18506908
View Article PubMed/NCBIZou Y, Hu W, Ma K, Tian M. Physicochemical properties and antioxidant activities of melanin and fractions from Auricularia auricula fruiting bodies. Food Sci Biotechnol. 2015;24:15-21.
View ArticleMin Y, Fan Q, Zhang R, Kai C. Dragon fruit-like biocage as an iron trapping nanoplatform for high efficiency targeted cancer multimodality imaging. Biomaterials. 2015;69:30-7. PMid:26275860 PMCid:PMC4586283
View Article PubMed/NCBIChen Y, Xie MY, Nie SP, Li C. Purification, composition analysis and antioxidant activity of a polysaccharide from the fruiting bodies of Ganoderma atrum. Food Chem. 2008;107:231-41.
View ArticleBerg RVD, Haenen GRMM, Berg HVD, Vijgh WVD. The predictive value of the antioxidant capacity of structurally related flavonoids using the Trolox equivalent antioxidant capacity (TEAC) assay. Food Chem. 2000;70:391-5. 00092-3
View ArticleWang X, Wu Q, Wu Y, Chen G. Response surface optimized ultrasonic-assisted extraction of flavonoids from Sparganii rhizoma and evaluation of their in vitro antioxidant activities. Molecules. 2012;17:6769-83. PMid:22664466 PMCid:PMC6268284
View Article PubMed/NCBIAraujo M, Xavier JR, Nunes CD, Vaz PD. Marine sponge melanin: a new source of an old biopolymer. Struct Chem. 2012;23:115-22.
View ArticleIto S, Wakamatsu K, Ozeki H. Chemical analysis of melanins and its application to the study of the regulation of melanogenesis. Pigment Cell Melanoma Res. 2000;13:103–9.
View ArticleEllis DH, Griffiths DA. The location and analysis of melanins in the cell walls of some soil fungi. Can J Microbiol. 1974;20:1379-86.
View ArticleSuryanarayanan TS, Ravishankar JP, Venkatesan G, Murali TS. Characterization of the melanin pigment of a cosmopolitan fungal endophyte. Fungal biology. 2004;108:974-8.
Hou R, Liu X, Xiang K, Chen L. Characterization of the physicochemical properties and extraction optimization of natural melanin from Inonotus hispidus mushroom. Food chemistry. 2019;277:533-42. PMid:30502181
View Article PubMed/NCBICockell CS, John K. Ultraviolet radiation screening compounds. Biol Rev Camb Philos Soc. 1999;74:311-45.
View ArticleTu Y, Sun Y, Tian Y, Xie M. Physicochemical characterisation and antioxidant activity of melanin from the muscles of Taihe Black-bone silky fowl (Gallus gallus domesticus Brisson). Food Chem. 2009;114:1345-50.
View ArticleBabitskaia VG, Shcherba VV, Filimonova TV, Grigorchuk EZ. Melanin pigments of the fungi Paecilomyces variotii and Aspergillus carbonarius. Prikl Biokhim Mikrobiol. 2000;36:153-9. PMid:10780001
PubMed/NCBIHong L, Simon JD. Insight into the binding of divalent cations to Sepia eumelanin from IR absorption spectroscopy. Photochem Photobiol. 2006;82:1265-9. PMid:16696594
View Article PubMed/NCBIElnaggar NE, Elewasy SM. Bioproduction, characterization, anticancer and antioxidant activities of extracellular melanin pigment produced by newly isolated microbial cell factories Streptomyces glaucescens NEAE-H. Sci Rep. 2017;7:42129. PMid:28195138 PMCid:PMC5307326
View Article PubMed/NCBIChen SR, Jiang B, Zheng JX, Xu GY. Isolation and characterization of natural melanin derived from silky fowl (Gallus gallus domesticus Brisson). Food Chem. 2008;111:745-9.
View ArticleAghajanyan AE, Hambardzumyan AA, Hovsepyan AS, Asaturian RA. Isolation, purification and physicochemical characterization of water-soluble Bacillus thuringiensis melanin. Pigment Cell Res. 2005;18:130-5. PMid:15760342
View Article PubMed/NCBIMosca L, Blarzino C, Coccia R, Foppoli C. Melanins from tetrahydroisoquinolines: spectroscopic characteristics, scavenging activity and redox transfer properties. Free Radical Biol Med. 1998;24:161-7. 00211-6
View ArticleMadhusudhan DN, Mazhari BB, Dastager SG, Agsar D. Production and cytotoxicity of extracellular insoluble and droplets of soluble melanin by Streptomyces lusitanus DMZ-3. Biomed Res Int. 2014;2014:306895. PMid:24839603 PMCid:PMC4009274
View Article PubMed/NCBIKimura T, Fukuda W, Sanada T, Imanaka T. Characterization of water-soluble dark-brown pigment from Antarctic bacterium, Lysobacter oligotrophicus. J Biosci Bioeng. 2015;120:58-61. PMid:25533380
View Article PubMed/NCBITarladgis BG, Schoemakers AW, Begemann PH. 2,2′-Diphenyl-1-Picryl-Hydrazyl as a Reagent for the Quantitative Determination of Hydroperoxides. J Dairy Sci. 1964;47:1011-2. 88830-5
View ArticleCacciuttolo MA, Trinh L, Lumpkin JA, Rao G. Hyperoxia induces DNA damage in mammalian cells. Free Radical Biol Med. 1993;14:267-76. 90023-N
View ArticleZhao H, Fan W, Dong J, Lu J. Evaluation of antioxidant activities and total phenolic contents of typical malting barley varieties. Food Chem. 2008;107:296-304.
View ArticleQuanhong L, Caili F. Application of response surface methodology for extraction optimization of germinant pumpkin seeds protein. Food Chemistry. 2005;92:701-6.
View ArticleIto S, Fujita K. Microanalysis of eumelanin and pheomelanin in hair and melanomas by chemical degradation and liquid chromatography. Analytical Biochemistry. 1985;144:527-36. 90150-2
View Article