Chang-Hua Xu
Rapid recognition of origins and ages of Rice wine based on Tri-step IR and electronic tongue
Corresponding Author
Affiliation
Yu Yana, Xiao-peng Zhanga, Jia-juan Huanga,e, Xiao-zhen Hua, Jian-hong Gana,c,d, Zheng-quan Wanga,c,d, Yue Zhangf, Ning-ping Taoa,c,d, Xi-Chang Wanga,c,d , Chang-Hua Xua,b,c,d,e*
a College of Food Science and Technology, Shanghai Ocean University, Shanghai 201306, PR China
b Department of Pharmacology, Yale University, New Haven, CT, 06520, US
cLaboratory of Quality and Safety Risk Assessment for Aquatic Products on Storage and Preservation (Shanghai), Ministry of Agriculture, Shanghai 201306, China
d National R&D Branch Center for Freshwater Aquatic Products Processing Technology (Shanghai), Shanghai 201306, China
e Shanghai Food and Drug Administration
fFirst Teaching Hospital of Tianjin University of Traditional Chinese Medicine, Tianjin 300193, RP China
Article Reviewed By:
Rocco Longo(rocco.longo@utas.edu.au)
Banu Ozen(banuozen@iyte.edu.tr)
Fei Lao(lao.27@buckeyemail.osu.edu)
Figen Tokatli(figentokatli@iyte.edu.tr)
Citation
Chang-Hua Xu, Rapid recognition of origins and ages of Rice wine based on Tri-step IR and electronic tongue(2018)SDRP Journal of Food Science & Technology 3(3)
Abstract
Rice wine, an ancient drink of China, commonly has different origins and wine ages according to traditional processing methods, inducing great challenges to be authenticated and discriminated rapidly by conventional procedures. This study sought to develop an easy and reliable method, based on a Tri-step infrared spectroscopy, combined with electronic sensory for accurate and rapid discrimination of rice wine (RW). The class of nutrition (lipids, protein and other compounds), wine ages and origins were step-wisely evaluated and nutrition profile variations among different samples were integrated and interpreted by fast identification of their relative contents, based on spectral peak intensity. 140 batches of RW (twenty for each samples) were effectively classified by IR-PCA. In the sensory aspect, an electronic tongue distinguished rice wine objectively in taste with discrimination indexes that were greater than 95 for all the samples. The developed method would be an economic and simple approach for rapid chemotaxonomic discrimination of RW.
Key words: rice wine; identification; infrared spectroscopy; electronic tongue.
Introduction
Rice wine (RW), which generally made by rice, millet, corn and wheat, is one of the three ancient wines in the World. In addition to glucose in RW, there are isomaltoses, oligosaccharides, isomaltotraose, isomaltooligosaccharides and other low molecular sugars, so RW tastes sweet and is easily absorbed by the body (S. Chen & Xu, 2014; Shen, Yang, Ying, Li, Zheng, & Jiang, 2012). The organic acids in the RW are not only helpful for digestion, but also have the effect of promoting appetite. RW appeals to a lot of consumers because of its low consumption of raw material, low alcohol content, high nutrition, and occupies a dominant position in rice wine production, consumption and export. Nevertheless, to get high profits, some enterprises use illegal means, such as over-invoicing wine ages, origin and adulteration, which not only seriously violates consumer rights and disrupts the market order, but severely damages the brand reputation of rice wine.
The traditional method generally uses the sensory evaluation to identify the quality of RW, and is susceptible to experimental errors. Hence, high performance liquid chromatography (Beltrán, Duarte-Mermoud, Bustos, Salah, Loyola, Peña-Neira, et al., 2006), UV-visible spectra (Sen & Tokatli, 2016), gas chromatography and mass spectrometry (Kruzlicova, Mocak, Balla, Petka, Farkova, & Havel, 2009) techniques have been used to analyze the differences in flavor composition of RW from different origins and wine ages for obtaining more objective results by researchers. Although HPLC and GC-MS can improve results, these methods involve tedious preprocesses, are time-consuming or require well-trained personnel, and specially cannot acquire a full chemical and sensory attribute “image” of the target. A rapid, objective and holistic method to identify and discriminate RW origins and ages is still lacking.
Fourier transform infrared spectroscopy (FT-IR) is a quick, non-destructive and feasible vibration spectroscopic method that can be used to macro-analyze complicated mixtures, e.g. TCM, food and milk (Chang-Hua Xu; Coitinho, Cassoli, Cerqueira, Silva, Coitinho, & Machado, 2017; Daniel Cozzolino, 2015; Gu, Zou, Guo, Yu, Lin, Hu, et al., 2017; Hu, Guo, Wang, Zhao, Sun, Xu, et al., 2015). Second derivative infrared spectroscopy (SD-IR) can be used to handle severely over-lapped spectra and enhance the apparent resolution (D. Cozzolino, McCarthy, & Bartowsky, 2012; C. Xu, Wang, Chen, Zhou, Wang, Yang, et al., 2013). If the samples only showing tiny differences in FT-IR and SD-IR, two dimensional correlation spectroscopy (2DCOS-IR) can be employed to unfold FT-IR spectra on a second dimension to acquire a far improved spectral resolution and to obtain more chemical structural information (Mandak, Zhu, Godany, & Nyström, 2013). As a holistic analytical method, Tri-step infrared spectroscopy including FT-IR, SD-IR and 2DCOS-IR can achieved accurate analysis and identification of RW by identifying the overall chemical components. Principle component analysis (PCA) is an unsupervised clustering analytical method. According to (Jiao, Yang, & Chang, 2009; Oja, 1997), PCA as an essential technique in data compression and feature extraction, it provides a way of reducing the number of input variables entering some data processing system so that a maximal amount is retained in the mean square error sense. In addition, PCA shows the most significant features of data using calculated values. Eigenvalue for each cluster shows the most efficient can be used for separating the clusters from each other in every step. Therefore, utilizing PCA can enable us to identify the boundaries of clusters by the most efficient directions of eigenvalues (N, MT, & O., 2017; Parsi, Sorkhi, & Zahedi, 2016).
Electronic tongue (E-tongue) analysis is essential for the rapid detection of chemical components and sensory attributes (Kirsanov, Korepanov, Dorovenko, Legin, & Legin, 2017). It has emerged in recent years as a powerful taste sensor device for overall qualitative or quantitative analysis of basic gustatory substance e.g. acid, bitter, and sweet (Apetrei, Apetrei, Villanueva, de Saja, Gutierrez-Rosales, & Rodriguez-Mendez, 2010; Dias, Peres, Veloso, Reis, Vilas-Boas, & Machado, 2009; Zhang, Wei, Hu, Wang, Yu, Gan, et al., 2017). This device mimics the human senses of odor and taste. Furthermore, it enables the gathering of massive information on the analyzed solution, including analytical properties and sensory data that can be linked through suitable chemometric methods such as multivariate calibration methods. At present, the E-tongue has gotten application in green tea (Q. Chen, Zhao, Guo, & Wang, 2010), beer, coffee, milk, and wines (Vitae, Vitae, & Vitae, 2015).
The aim of this present study was to establish a rapid quality inspection and identification technology of RW based on multidimensional spectral analysis technique (Fourier transform infrared spectroscopy integrated with second derivative infrared spectroscopy and two-dimensional correlation infrared spectroscopy) combined with electronic sensory evaluation technology.
Materials & Methods
2.1. Apparatus
Thermo Scientific Nicolet Is-5 FT-IR, equipped with single-point ATR, in 400-4000 cm-1 range with a resolution of 4 cm-1. Spectra were recorded at 16 scans. The interferences of H2O and CO2 were subtracted when scanning. Alpha MOS IRIS VA300 computer vision technology (E-tongues) as an electronic sensory instrument was used.
The volatile compounds of RW were detected by HS-SPME-GC-MS. Squid sample (4.5 ul) and 4 μL 2-octanol in a glass vial were heated at 60˚C for 15 min, furthermore, the volatile compounds were absorbed by SPME for 30 min at 60˚C and then injected into the GC-MS. The GC and MS parameters were: column, DB-5MS (60 m×0.32 mm×0.25 μm); carrier gas, helium (99.999%); flow rate, 1.0 mL/min; detector interface temperature, 210˚C; ion source temperature, 200˚C; ionisation energy, 70 eV. Specially, the oven temperature was programmed from 50˚C to 70˚C at 4 ˚C /min, then from 70˚C to 150˚C at 6℃ /min, finally to 210˚C at 3˚C /min and held for 3 min.
2.2. Materials
Total samples of different kinds of rice wine were collected from Shanghai Food and Drug Administration, as shown in Table 1, including Hejiu silvery rice wine with three years fermentation (S-1), Hejiu golden rice wine with five years fermentation (S-2), Hejiu rice wine with five years fermentation (S-3), Hejiu jinsenianhua rice wine with five years fermentation (S-4), Shikumen boutique rice wine with five years fermentation (S-5), Shikumen ordinary rice wine with five years fermentation (S-6), Guyuelongshang base wine with five years fermentation (S-7), Guyuelongshan golden rice wine with five years fermentation (S-8), Guyuelongshan rice wine with three years fermentation (S-9).
Table 1. Information of different RW
|
English name |
Code |
name |
Origins |
||
|
Hejiu silvery rice wine with three years fermented |
S-1 |
和酒银标三年陈 |
Shang Hai |
||
|
Hejiu golden rice wine with five years fermented |
S-2 |
和酒金标五年陈 |
Shang Hai |
||
|
Hejiu rice wine with five years fermented |
S-3 |
和酒五年陈 |
Shang Hai |
||
|
Hejiu jinsenianhua rice wine with five years fermented |
S-4 |
和酒金色年华五年陈 |
Shang Hai |
||
|
Shikumen boutique rice wine with five years fermented |
S-5 |
石库门精品五年陈 |
Shang Hai |
||
|
Shikumen ordinary rice wine with five years fermented |
S-6 |
石库门普通五年陈 |
Shang Hai |
||
|
Guyuelongshang base wine with five years fermented |
S-7 |
古越龙山东方原酿五年 |
Shao Xing |
||
|
Guyuelongshangolden rice wine with five years fermented |
S-8 |
古越龙山库藏五年 |
Shao Xing |
||
|
Guyuelongshan rice wine with three years fermented |
S-9 |
古越龙山三年陈 |
Shao Xing |
||
2.3. Procedure
2.3.1. Acquisition of IR spectra
The FT-IR spectra of RW were collected at room temperature by single-point ATR. The raw FT-IR data was processed with Omnic spectrum software (Version 9.2.106) from Thermo FT-IR spectrometer. All the second derivative IR spectra were carried out after 13-point smoothing of the original IR spectra.
To obtain 2DCOS-IR, the prepared samples were put into ATR accessory, connected with the temperature controller, the temperature range was from 45℃ to 90℃ with an increasing rate of 2℃/min and dynamic original spectra at different temperatures were collected every 5℃ and then processed by SpectraCorr software to obtain 2DCOS-IR spectra.
2.3.2. Acquisition of electronic tongue data
The samples used for electronic tongue and were analyzed by AlphaSoft data processing software. The instrument included a detector unit, reference electrode, electrical signal processor and a pattern recognition software that were used to record and analyze data. The detector unit contained 7 chemical sensor arrays (SRS, GPS, STS, UMS, SPS, SWS and BRS). Before the samples were tested, the electronic tongue must be activated, calibrated and diagnosed. Each sample was repeated 7 times, and the last three results of signal stability were analyzed.
Results
3.1. IR spectra of Chinese rice wine
Since RW is a complex system, its IR spectrum (Figure 1(a)) represents an integrally overlapped absorption of all components in the range of 700-4000 cm-1. The major components of RW are water and alcohol, hence IR spectra of all RW are too similar to tell. To present the differences more distinctly, we analyzed the SD-IR spectra in the range of 1500-900 cm-1
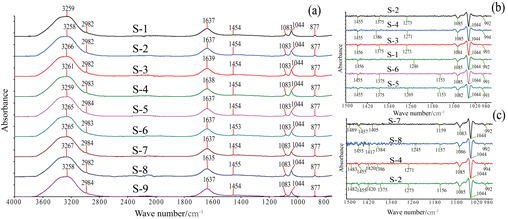
Figure 1. IR spectra of (a) IR spectra of all samples (b) Second derivative IR spectra of the same origin and different wine ages (c) Second derivative IR spectra of the same wine ages and different origins
3.2. Second derivative IR spectra of RW of different age and origins
Generally, the second derivative IR spectra (SD-IR) significantly enhance the apparent resolution and amplified even tiny differences in ordinary IR spectra. Hence, Second derivative infrared spectroscopy was applied to analyze further the subtle differences in the absorption peaks of RW that with different origin and wine ages.
In (Figure 1(b) & Table 2), although the SD-IR of the same origin and different wine age have common peaks in 1044 cm-1, 1085 cm-1, 1455 cm-1 and 992 cm-1, they have some differences. For example, S-2, S-3 and S-4 have remarkable differences in peak intensity and shape at 1455 cm-1. In addition, compared with others five years wine samples, the corresponding peak of S-4 to 1375 cm-1 blue shifted about 10 cm-1 to 1386 cm-1. Obviously, S-1 as a unique three year matured wine does not have 1375 cm-1 and has a weaker peak of 1456 cm-1 than other samples.
Wine samples with the same wine age and different origins have significant differences (Figure 1(c) and Table 2). Although S (2, 4, 7, 8) come from different origins, they have similar and strong absorption peaks, e.g. 992 cm-1, 1044 cm-1, 1085 cm-1. Shaoxing and Shanghai rice wines have extremely distinction in 1455 cm-1. In 1500-1300 cm-1, Shaoxing rice wine contains more complex compounds and more peaks (S-7, 8) than Shanghai rice wine (S-4,2) the reason being that the temperature and environmental factors during fermentation affect the reaction among the compounds in the rice wine, resulting in different compound species and concentrations.
Table 2. The preliminary assignment of main characteristic absorption peaks of RW
|
Peak position (cm-1) |
Base group and vibration mode |
Main attribution |
|
3259, 1637 |
u(O-H) |
H2O |
|
2982 |
us(C-H) |
CH2 |
|
1682, 1083, 1044 |
uas(C-O) |
Ethanol |
|
1675 |
u(C=C) |
Esters |
|
1650 |
u(C=O) |
Proteins |
|
1375 |
u(C-O) |
C-O |
|
1454 |
δ(C-H) |
CH3 |
|
992 |
δ(C-O) |
Sugars |
Note: u, stretching mode; s, symmetric; as, asymmetric; δ, bending mode
3.3. 2DCOS-IR spectra of RW of different origins and age
2DCOS-IR spectrum can obviously enhances the resolution of spectrum and get some useful information of molecular structure and interactions of functional groups within and between molecules (C.-H. Xu, Sun, Guo, Zhou, Tao, & Noda, 2006). In order to differentiate the rice wine more remarkably and convincingly, 2DCOS-IR synchronous spectroscopy was used in the wavenumber range of 1700-1100 cm-1. The auto-peaks on the diagonal line in synchronous IR spectrum show the susceptibility and self-correlativity of certain absorption bands, which cause the change of spectral intensity with thermal treatment. While the cross-peaks at the off-diagonal locations display the relativity of intensity variations of a pair of group vibrations corresponding to their frequencies. Positive correlation (red/green area) in 2DCOS-IR spectra indicates that a group of absorption bands change simultaneously (either stronger or weaker), while negative correlation (blue area) is just the opposite (namely, an enhanced and another weaker) (J. Chen, Wang, Liu, Rong, & Wang, 2018; Gan, Xu, Zhu, Mao, Yang, Zhou, et al., 2015; Wang, Wang, Pei, Li, Sun, Zhou, et al., 2018).
Figure 2 represents the synchronous 2DCOS-IR spectra from different origins and wine ages in the range of 1700-1400 cm-1. With the increase of temperature from 45℃-90℃, all of the samples show obvious difference In the 1150 cm-1-1600 cm-1, same origin (S-1,2) have a common absorption peak 1452 cm-1, besides S-1 has 1383 cm-1 that makes the formation of 2×2 peak clusters, and S-2 also has 1178 cm-1, 1482 cm-1 and 1537 cm-1 (stretching of C=N) forming 4×4 peak clusters. The typically strong autopeaks are 1452 cm-1, 1682 cm-1 in S-5 and S-6, but the relative intensity of peak at 1452 cm-1 is higher in S-5 than in S-6. For S-7, the presence of one strong amide I absorption peaks (1675 cm-1) and a weak absorption peak of 1450 cm-1, which is different from S-9. S-3 only had an absorption peak of 1625 cm-1, whereas S-8 has strong amide I absorption peak (1680 cm-1) and two weak absorption peaks of 1628 cm-1 and 1454 cm-1 and related 3×3 peak clusters. The three year fermented rice wine, from different origins, S-1 and S-9 have huge differences from the shape and the number of peaks.
Therefore, the eight species of rice wines from different origins and wine ages have individual fingerprints in the range of 1700-1100 cm-1, which can be used as an exclusive range for verifying each other.
Shanghai and Shaoxing contain seven and three unique chemical substances (Table 3), respectively, revealed by SPME-GC-MS. The numbers and shape of absorption peaks contributed by aldehydes, esters alcohols and alkanes have obvious differences among rice wines with different origins [(Figure 1(c) and Figure 2(Ⅱ)]. Therefore, IR spectra and GC-MS can be a mutual authentication of chemical substance, and crosscheck that different origins have individual characteristics.
Table 3. Unique substance differences with different origins
|
Origins |
Substances |
Species |
|
Shaoxing |
Benzaldehyde |
Aldehydes |
|
|
Ethyl linoleate Hexadecanoic acid ethyl ester 2, 3- butanediol, Dodecanol |
Esters Esters Alcohols |
|
|
Octanoic acid ethyl ester, Ethyl benzoate |
Esters |
|
Shanghai |
N-heptadecane, N-octadecane |
Alkanes |
|
|
Ethyl palmitate |
Esters |
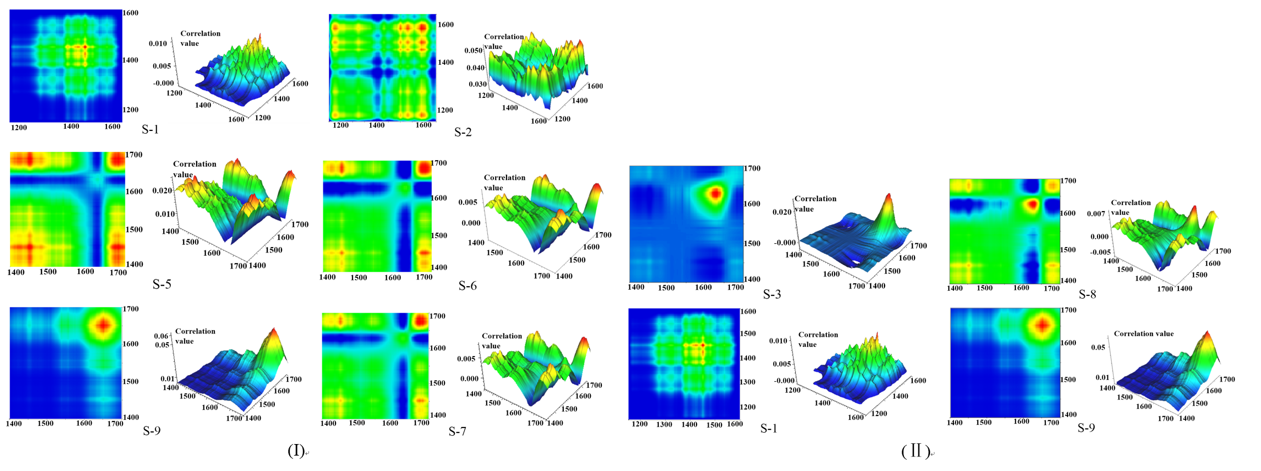
Figure 2: 2DCOS-IR synchronous spectra of (I) same origin and different wine ages (Ⅱ) same wines ages and different origins
3.4. Principal component analysis (PCA) of RW of different origins and age
In order to establish an objective and accurately classify a model for all rice wines, 140 parallel samples (Figure 3) were analyzed and the range of 1700-1050 cm-1 was selected for principal component analysis (PCA) (PerkinElmer, UK). Thirty five parallel samples (5 S-2, 5 S-3, 5 S-4, 5 S-6, 5 S-7, 5 S-8, 5 S-9) as unknown samples (US) were analyzed with the purpose of verifying the reliability of the model. The parameters for establishing a rice wine classification model were summarized in Table 4.
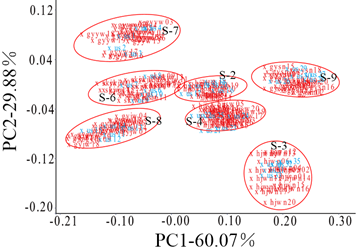
Figure 3: Classification plot of PCA for FT-IR data of CRW
Table 4. Parameters for model based on PCA
|
Parameters |
Values |
|
Analysis range |
1700-1050cm-1 |
|
Scaling(spectra) |
Mean |
|
Smooth |
None |
|
Baseline correction |
None |
|
Normalization |
SNV de-trending |
The rice wine from different origins and wine ages were completely separated (Figure 4) and indicated different rice wines have their own characteristics in compounds type and content. Peaks of lipids, protein (CH3) and ethanol (C-O) make dominating contributions to the PC1 score plot. Peaks of ethanol (C-O) make dominating contributions to the PC2 score plot (Figure 4). Because different origins and wine ages have great differences, all of the rice wines can be successfully recognized by established IR-PCA model with the help of these factors. The above results demonstrated that RW can be classified successfully applying IR combined with PCA, and this model could be used to distinguish the unknown rice wine.
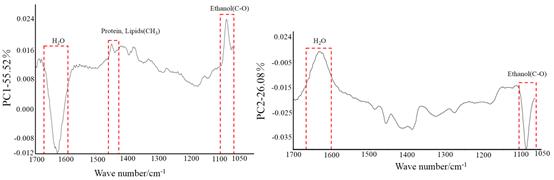
Figure 4: 4 PCA scores plots of PC1 (left) and PC2 (right)
3.5. Modeling and analysis of electronic tongue
Nowadays, electronic tongue system have to be a powerful tool for detecting various complex liquids (Eckert, Pein, Reimann, & Breitkreutz, 2013). A signal obtained by chemical sensors is processed with multivariate data analysis systems that permit quantitative and qualitative results by analyzing samples (Kirsanov & Babain, 2014).
Principal component analysis (PCA), is a combination of many of the original uncorrelated indicators with a certain set of new independent indicators to replace the original indicators. To make full use of the sample information contained in the data, the complex multidimensional data is usually dimensioned down. At the same time, the results are shown by scatter plot and a discriminatory effect of samples is revealed by PC1, PC2 of influencing the sample quality. To support the PCA results, DFA was used to discriminate RW.
The rice wine samples were analyzed by using principal component analysis (PCA) in order to distinguish their origins and wine ages (Figure 5). The PCA discrimination index is 98, 95, 96 and 96 respectively, indicating different rice wines were successfully differentiated. As shown in Figure 5, the main differences focus on the horizontal axis where there are notable cluster tends for the rice wine. To verify the PCA results, DFA was used to discriminate rice wines (Figure 5). The results, based on DFA methodology is presented in Figure 5. The values of 97.09%, 89.59%, 54.33%, 82.36%, are data variance explained by the horizontal axis and 2.911%, 10.413%, 43.487%, 16.682% data variance captured by the vertical axis, respectively. The cluster, based on DFA is in accordance with the result of PCA.
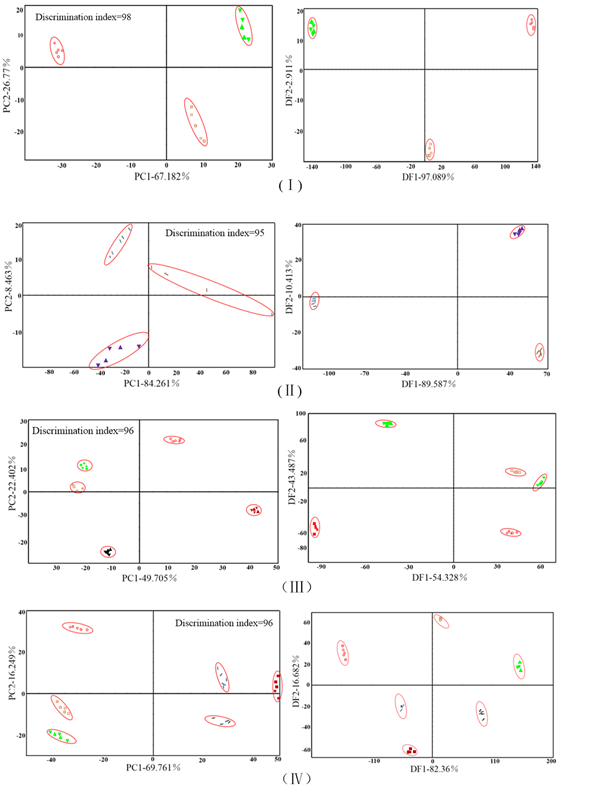
Figure 5: PCA and DFA distinguishing graph of (Ⅰ) Guyuelongshan of Shaoxing (Ⅱ) Hejiu of Shanghai (Ⅲ) Shikumen of Shanghai and Guyuelongshan of Shaoxing (Ⅳ) Hejiu of Shanghai and Guyuelongshan of Shaoxing
Conclusion
The rice wine from different origins and wine ages, have been quickly and effectively distinguished by the Tri-step infrared spectroscopy combined with electronic sensory evaluation analysis. In IR spectra, the significant absorption bands attributed to ethanol and protein in rice wine are the main differences. With applying second derivative infrared spectroscopy, the resolution of the differences was enhanced to reveal small differences. Different peak positions, intensities and shapes in the range of 1700-1000 cm-1 indicate that rice wines have different profiles of protein, lipids and ethanol. Through the 2D-IR spectra in the range of 1700-1050 cm-1, the clear distinctions among the rice wines are thoroughly visualized. Besides, 160 different rice wines (twenty for each) have been effectively classified by Principal Component Analysis (PCA). Finally, the electronic tongue distinguished the rice wine successfully by Principal Component Analysis (PCA) and Discriminant Function Analysis (DFA).
It has been demonstrated that the Tri-step infrared spectroscopy combined with electronic sensory evaluation analysis could be a scientific and powerful tool for rapid chemotaxonomic discrimination of rice wines in a holistic manner. Furthermore, linking between chemical components and electronic sensory will help to enhance the quality control, improve production process, and promoting the rational and healthy development of Rice wine industry.
Acknowledgement
This work is financially supported by National Natural Science Foundation of China (Grant No. 31401571), the National Key Research and Development Program of China (2016YFD0401501), Thermo Fisher Scientific Inc. (China) (Portable Spectral Technique Development and Applications, Grant No. D-8006-16-0075), and Key Projects in the National Science & Technology Pillar Program during the Twelfth Five-year Plan Period (Grant No. 2015BAD17B01 and Grant No. 2015BAD17B02) and Tianjin science and technology innovation fund (06FZZDSH00408); Tianjin Natural Science Fund (14JCQNJC11900
Abbreviations
RW, rice wine;
PDMS, polydimethylsiloxane
TCM, Traditional Chinese Medicine;
PCA, Principle component analysis;
DFA, Discriminant Function Analysis;
RTD, resistive thermal detector;
FT-IR, Fourier transform infrared spectroscopy;
SD-IR, Second derivative infrared spectroscopy;
2DCOS-IR, Two dimensional correlation spectroscopy;
SPME-GC-MS, Solid-Phase Microextraction-Gas Chromatography-Mass Spectrometer.
References
Apetrei, C., Apetrei, I. M., Villanueva, S., de Saja, J. A., Gutierrez-Rosales, F., & Rodriguez-Mendez, M. L. (2010). Combination of an e-nose, an e-tongue and an e-eye for the characterisation of olive oils with different degree of bitterness. Analytica Chimica Acta(No.1), 91-97. PMid:20172102
View Article PubMed/NCBIBeltrán, N. H., Duarte-Mermoud, M. A., Bustos, M. A., Salah, S. A., Loyola, E. A., Pe-a-Neira, A. I., & Jalocha, J. W. (2006). Feature extraction and classification of Chilean wines. Journal of Food Engineering(NO.1), 1-10.
View ArticleChang-Hua Xu, J.-B. C., Qun Zhou. Classification and identification of TCM by macro-interpretation based on FT-IR combined with 2DCOS-IR.
Chen, J., Wang, Y., Liu, A., Rong, L., & Wang, J. (2018). Two-dimensional correlation spectroscopy reveals the underlying compositions for Fr-NIR identification of the medicinal bulbs of the genus Fritillaria. Journal of Molecular Structure, 681-686.
View ArticleChen, Q., Zhao, J., Guo, Z., & Wang, X. (2010). Determination of caffeine content and main catechins contents in green tea (Camellia sinensis L.) using taste sensor technique and multivariate calibration. Journal of Food Composition and Analysis(No.4), 353-358.
View ArticleChen, S., & Xu, Y. (2014). Adaptive Evolution of Saccharomyces cerevisiae with Enhanced Ethanol Tolerance for Chinese Rice Wine Fermentation. Applied Biochemistry and Biotechnology(No.7), 1940-1954. PMid:24879599
View Article PubMed/NCBICoitinho, T. B., Cassoli, L. D., Cerqueira, P. H. R., Silva, H. K. d., Coitinho, J. B., & Machado, P. F. (2017). Adulteration identification in raw milk using Fourier transform infrared spectroscopy. Journal of Food Science and Technology(No.8), 2394-2402. PMid:28740297
View Article PubMed/NCBICozzolino, D. (2015). Sample presentation, sources of error and future perspectives on the application of vibrational spectroscopy in the wine industry. Journal of the Science of Food and Agriculture, 95(5), 861-868. PMid:24816857
View Article PubMed/NCBICozzolino, D., McCarthy, J., & Bartowsky, E. (2012). Comparison of near infrared and mid infrared spectroscopy to discriminate between wines produced by different Oenococcus Oeni strains after malolactic fermentation: A feasibility study. Food Control(No.1), 81-87.
View ArticleDias, L. A., Peres, A. M., Veloso, A. C. A., Reis, F. S., Vilas-Boas, M., & Machado, A. A. S. C. (2009). An electronic tongue taste evaluation: Identification of goat milk adulteration with bovine milk. Sensors and Actuators. B: Chemical, 209-217.
View ArticleEckert, C., Pein, M., Reimann, J., & Breitkreutz, J. (2013). Taste evaluation of multicomponent mixtures using a human taste panel, electronic taste sensing systems and HPLC. Sensors and Actuators. B: Chemical, 294-299.
View ArticleGan, J.-H., Xu, C.-H., Zhu, H.-Z., Mao, F., Yang, F., Zhou, Q., & Sun, S.-Q. (2015). Analysis and discrimination of ten different sponges by multi-step infrared spectroscopy. Chinese Chemical Letters, 26(2), 215-220.
View ArticleGu, D.-C., Zou, M.-J., Guo, X.-X., Yu, P., Lin, Z.-W., Hu, T., Wu, Y.-F., Liu, Y., Gan, J.-H., Sun, S.-Q., Wang, X.-C., & Xu, C.-H. (2017). A rapid analytical and quantitative evaluation of formaldehyde in squid based on Tri-step IR and partial least squares (PLS). Food Chemistry, 458-463. PMid:28372201
View Article PubMed/NCBIHu, W., Guo, X.-X., Wang, X.-C., Zhao, Y., Sun, S.-Q., Xu, C.-H., & Liu, Y. (2015). Rapid Discrimination of Different Grades of White Croaker Surimi by Tri-Step Infrared Spectroscopy Combined with Soft Independent Modeling of Class Analogy (SIMCA). Food Analytical Methods, 9(4), 831-839.
View ArticleJiao, W., Yang, S., & Chang, Y. (2009). DOA Estimation of Multiple Convolutively Mixed Sources Based on Principle Component Analysis. Neural Information Processing, 340-348.
View ArticleKirsanov, D., & Babain, V. (2014). Developing sensing materials for multisensor systems on the basis of extraction data. In Multisensor systems for chemical analysis: materials and sensors, (pp. 1-40): Pan Stanford Publishing.
View ArticleKirsanov, D., Korepanov, A., Dorovenko, D., Legin, E., & Legin, A. (2017). Indirect monitoring of protein A biosynthesis in E.coli using potentiometric multisensor system. Sensors and Actuators B: Chemical, 1159-1164.
View ArticleKruzlicova, D., Mocak, J., 2, Balla, B., Petka, J., Farkova, M., & Havel, J. (2009). Classification of Slovak white wines using artificial neural networks and discriminant techniques. Food Chemistry(No.4), 1046-1052.
View ArticleMandak, E., Zhu, D., Godany, T. A., & Nyström, L. (2013). Fourier transform infrared spectroscopy and Raman spectroscopy as tools for identification of steryl ferulates. Journal of agricultural and food chemistry, 61(10), 2446-2452. PMid:23414293
View Article PubMed/NCBINur, C., Mustafa, T. Y., & Osman, S. (2017). A rapid ATR-FTIR spectroscopic method for detection of sibutramine adulteration in tea and coffee based on hierarchical cluster and principal component analyses. Food Chem, 517-526.
Oja, E. (1997). The nonlinear PCA learning rule in independent component analysis. Neurocomputing(NO.1), 25-45. 00045-3
View ArticleParsi, A., Sorkhi, A. G., & Zahedi, M. (2016). Improving the unsupervised LBG clustering algorithm performance in image segmentation using principal component analysis. Signal, Image and Video Processing(No.2), 301-309.
View ArticleSen, I., & Tokatli, F. (2016). Differentiation of wines with the use of combined data of UV–visible spectra and color characteristics. Subtropical plant science, 101-107.
View ArticleShen, F., Yang, D., Ying, Y., Li, B., Zheng, Y., & Jiang, T. (2012). Discrimination Between Shaoxing Wines and Other Chinese Rice Wines by Near-Infrared Spectroscopy and Chemometrics. Food and Bioprocess Technology(No.2), 786-795.
View ArticleVitae, M. C., Vitae, I. S., & Vitae, J. W. G. (2015). Surface acoustic wave electronic tongue for robust analysis of sensory components. Sensors and Actuators B: Chemical, 1147-1153.
Wang, Z., Wang, X., Pei, W., Li, S., Sun, S., Zhou, Q., & Chen, J. (2018). Chemical transitions of Areca semen during the thermal processing revealed by temperature-resolved ATR-FTIR spectroscopy and two-dimensional correlation analysis. Journal of Molecular Structure, 1-6.
View ArticleXu, C.-H., Sun, S.-Q., Guo, C.-Q., Zhou, Q., Tao, J.-X., & Noda, I. (2006). Multi-steps Infrared Macro-fingerprint Analysis for thermal processing of Fructus viticis. Vibrational Spectroscopy(No.1), 118-125.
View ArticleXu, C., Wang, Y., Chen, J., Zhou, Q., Wang, P., Yang, Y., & Sun, S. (2013). Infrared macro-fingerprint analysis-through-separation for holographic chemical characterization of herbal medicine. J Pharm Biomed Anal, 74, 298-307. PMid:23245264
View Article PubMed/NCBIZhang, X., Wei, W., Hu, W., Wang, X., Yu, P., Gan, J., Liu, Y., & Xu, C. (2017). Accelerated chemotaxonomic discrimination of marine fish surimi based on Tri-step FT-IR spectroscopy and electronic sensory. Food Control, 1124-1133.
View Article