Qinqin Han, Xueshan Xia
Phone: 86(0871)65939528. Fax: 86(0871)65939528.
E-mail: qqhan10@kmust.edu.cn (Qinqin Han); oliverxia2000@aliyun.com (Xueshan Xia)
© 2019 Sift Desk Journals. All Rights Reserved
VOLUME: 3 ISSUE: 6
Page No: 497-508
Qinqin Han, Xueshan Xia
Phone: 86(0871)65939528. Fax: 86(0871)65939528.
E-mail: qqhan10@kmust.edu.cn (Qinqin Han); oliverxia2000@aliyun.com (Xueshan Xia)
Le Jing, Pu Qiao, Jie Li, Mingwei Qin, Xiaomeng Zhang, Yuzhu Song, Jinyang Zhang, Qiang Chen, Xueshan Xia*, Qinqin Han*
Engineering Research Center for Molecular Diagnosis, Faculty of Life Science and Technology, Kunming University of Science and Technology, Kunming 650500, Yunnan, People’s Republic of China
Zhaoyang Ding Z(zyding1@uw.edu)
Ming-Qi Wang MQ(wmq3415@163.com)
Yuanchen Dong Y(dongyuanchen@outlook.com)
Qinqin Han, Selection and characterization of DNA aptamer specially targeting ?-amanitin in wild mushrooms(2018)SDRP Journal of Food Science & Technology 3(6)
α-amanitin is a polypeptide isolated from the fruiting body of Amanita exitialis. It is the main toxin in wild mushrooms and toxic, often lethal, in animal and humans. In this study, the artificial nucleic acid aptamers targeting α-amanitin were screened by Systematic Evolution of Ligands by Exponential Enrichment (SELEX) in vitro, in order to develop an analytical tool for α-amanitin detection. The specificity of aptamer H06 with α-amanitin was confirmed using Enzyme-Linked OligoNucleotide Assay (ELONA) and Dot blot, and no non-specific was observed. Based on the ELONA platform, the minimum detectable concentration of aptamer H06 for α-amanitin was 8 ng/mL. The circular dichroism (CD) spectroscopy experiment indicated aptamer H06 forms a stem-loop and intramolecular G-quadruplex and it can stable exist in binding buffer and PBS buffer. Moreover, the affinity test showed a strong binding force between α-amanitin and the aptamer H06, with the dissociation constant (KD) of 37.5±5.135 nM. And the accurary of the ELONA assay based on aptame H06 was demonstrated in real mushroom samples. In summary, our data could demonstrate a possibility of the development of apta-based diagnostic platform and detection method for α-amanitin.
Keywords: α-amanitin, circular dichroism spectroscopy, DNA aptamer, ELONA, SELEX.
Fungi in the genus Amanita form ectomycorrhizal in association with plants, where they stimulate the growth and defense of the host organism [1, 2]. However, Amanita mushrooms can also produce some of the most toxic compounds in the world [3-5]. Every year mushroom poisoning caused by mushroom consumption is responsible for fatal accidents, in particular in China [6]. Approximately 50 of the over 2000 edible mushroom types identified worldwide have toxic effects [7]. Amanita toxins are classified into amatoxins, phallotoxins and virotoxins according to their amino acid composition and structure. Among them, α-amanitin is the main toxins in mushrooms of the Amanita genus and often is involved in animal and human intoxication and death. The lethal dose was 0.1 mg/kg weight for human [8]. α-amanitin is a cyclic octapeptide compound containing several special amino acids, which can specifically inhibit eukaryotic cells when acting on eukaryotic cells RNA polymerase II, to prevent the extension of mRNA, thereby inhibiting intracellular transcription and protein synthesis [9, 10].
At present, some direct detection methods are available for detection of α-amanitin, such as color reaction, paper layer chromatography (PLC), thin-layer chromatography (TLC), high efficiency liquid chromatography (HPLC), radio immune assay (RIA), capillary zone electrophoresis (CZE), RNA polymerase inhibition method and enzyme-linked immunosorbent assay (ELISA) [11-13]. All these assays have advantages and shortcomings, but in general most of them are complicated in technology and long in testing time. In recent years, aptamers were investigated as an alternative for antibody [14]. Aptamers are artificial single stranded oligonucleotides (RNA or DNA) that can bind to a wide range of target molecules with high affinity and specificity, ranging from large molecules to simple organic small molecules like protein, ATP, dyes, amino acids or small cations [15, 16]. They are developed by an effective selection process in vitro called systematic evolution of ligands by exponential enrichment (SELEX) [17]. SELEX is mainly divided into four steps: the establishment of ssDNA library, the combination of target and ssDNA library, the amplification of ssDNA and the enrichment of ssDNA. The candidate aptamers that can specifically recognize the target through the above method are screened out [18-20]. Meanwhile, aptamers have numerous advantages over antibodies because of their low molecular weight, low immunogenicity reaction, convenient synthesis, and easy modification [21-23]. Therefore, aptamers can readily be labeled with fluorescein, biotin or radio isotope to form molecular beacons, used as molecular recognition materials in various sensors. They play more and more important roles in the detection of toxins, microorganisms, heavy metals, antibiotics and pesticide analysis [24, 25].
Here, multiple aptamers against α-amanitin were selected using SELEX in vitro. Aptamer H06 was characterized by ELONA and Dot blot assay to determine the specificity and affinity. After optimizations, aptamer H06 was confirmed that it can be used as an identification element in the ELONA to detect α-amanitin from mushrooms in real detection, providing an accurate and quick analytical method.
2.1. Reagents
α-amanitin was obtained from Shi technology development co., LTD (Beijing), chemical products were obtained from GE Healthcare (China).
2.2. DNA library and primers
The ssDNA oligonucleotide library was synthesized as a single strand of 82 bases with the following sequence: 5’-GACATATTCAGTCTGACAGCG–N40-GATGGACGAATATCGTCTAGC–3’, and all ssDNA oligonucleotide consisted of different primer binding sizes and a random region, where the central 40 nucleotides based on equal incorporation of A, T, G and C at each position. The primers used for ssDNA amplification were Fw, 5’-GACATATTCAGTCTGACAGCG-3’, Rv, 5’-GCTAGACGATATTCGTCCATC-3’. Both the ssDNA oligonucleotide library and primers were chemically synthesized by Sangon Biotech Co., Ltd (Shanghai, China).
2.3. DNA library amplification
DNA library was amplified by Polymerase Chain Reaction (PCR), and the reaction master mix contained 5 μL of aptamer library (50 μM), 10×Taq buffer (Takara, Dalian, China), 0.2 mM dNTP mix (Takara, Dalian, China), 1 U Taq DNA polymerase (Takara, Dalian, China), and 1 µM of each primer, which were amplified with the following settings, denaturation at 95°C for 5 min, followed by 30 cycles at 95°C (45 s), 58 °C (45 s), 72 °C (1 min) and a final extension at 72 °C for 7 min, using a DNA Engine (PTC-200) Peltier Thermal Cycler-200 (MJ Research/Bio-Rad Laboratories, Hercules, CA).
2.4. In vitro selection of aptamers against α-amanitin
According to SELEX protocol, aptamers against α-amanitin were obtained by iterative rounds of selection and amplification. A process of SELEX is shown in Fig. 1. In the initial round, 2 nmol of ssDNA, denatured at 95°C for 10 min and then cooled on ice for 10 min, were mixed with sepharose 6B and 1.5 mg α-amanitin in 3 mL of binding buffer (50 mM Na2CO3-NaHCO3, pH 9.6) and incubated at 37°C for 1 h. The bound aptamer-α-amanitin-sepharose 6B complexes were purified using affinity column. The concentration of elution buffer were 10 mM, 20 mM, 30 mM, 40 mM and 50 mM KCl, respectively, one concentration was used for two rounds. After ten rounds of selection, the ssDNA bound to α-amanitin was amplified by PCR using the primers listed previousy. The dsDNA obtained by PCR was denatured for 10 min at 95°C and cooled for 10 min on ice to form ssDNA, which was used as the template of the next round.
2.5. Aptamer amplification, aptamer sequencing and secondary ssDNA structure prediction
Selected aptamer population was amplified via PCR, the 50 µL reaction system containing 10 x PCR buffer, 0.2 mM dNTP mix, 1 U Taq DNA polymerase, 1 µM Fw primer and 1 µM Rv primer as described above. The dsDNA product was cloned into pMD-19T Easy-cloning vector (Takara, Dalian, China) following manufacturer’s instructions.
Candidate ssDNA were conducted to secondary structure prediction by the Mfold software online (http://unafold.rna.albany.edu/?q=mfold/DNA-Folding-Form) [21]. The condition was set at 26°C in 150 mM Na+ and 1 mM Mg2+. The QGRS Mapper as a web-based server to predict the presence of G-quadruplexes in nucleotide sequence (http://bioinformatics.ramapo.edu/QGRS/ analyze.php).
2.6. Circular Dichroism Spectroscopy
The aptamers were diluted to 20 μM with ddH2O, denaturing at 95 °C for 30 s and rapidly cooling to 25°C. Then, the above denatured aptamers were diluted to 2.5 µM using 20 mM Tris-HCl buffer (pH 7.2) with different concentrations of KCl solution (0, 5, 10, 20, or 50 mM). Otherwise, the CD spectra of these aptamers in water and PBS buffer (10 mM) were measured by the same operations as above. The CD spectra was measured over a wavelength range of 220–340 nm at 25 °C, and the scanning speed was set at 1 nm/s, and the response time was 1 s. Each spectrum is measured on average five times.
2.7. Specificity and sensitivity studies by ELONA
ELONA was used to analyze the specificity and sensitivity of the aptamers for the target as described in Song [26]. In order to determine the specificity of the aptamers for α-amanitin, the 96-well microtiter plate were coated with 100 µL of 40 ng/mL α-amanitin and 100 µL of 40 ng/mL other toxins (β-amanitin, γ-amanitin, Glyphosate, Clenbuterol, NS1 protein, NS1 core protein) using coating solution (0.05 M pH 9.6 Na2CO3-NaHCO3, CBS), then the wells incubated at 37°C for 1h and washed three times with PBST buffer. Next, the wells were blocked for 1 h with 5% skimmed milk dissolved in PBST and washed three times, Biotin-labeled aptamer (Sangon, Shanghai) against α-amanitin was diluted to the concentration of 200 nM with PBS buffer, and then 100 µL of this solution was added to each well, incubated at 37°C for 1 h, washed three times. Afterwards, 100 µL of a 1/1000 dilution of streptavidin-HRP (GE Healthcare) was added to the individual well and incubated at 37°C for 30 min and washed three times. Then, 100 µL of TMB chromogenic solution was added and incubated without light for 15 min at 37°C. Finally the reaction was stopped with 50 µL stopping buffer (2 M H2SO4), the plates were measured with an enzyme-linked immunosorbent assay reader, and absorbance of each sample was measured at 450 nm. Results of each sample were calculated as the mean ± SD from three independent experiments.
To study the optimum concentration of the aptamers to recognize α-amanitin via the ELONA, the method was developed as above. Each well was coated with 100 µL of 40 ng/mL α-amanitin and incubated 1 h at 37°C, blocked operation as above. Afterwards, biotin-labeled aptamer were diluted in PBS buffer at 50 nM, 80 nM, 100 nM, 500 nM and 1000 nM. Then, 100 µL of the solution were added to each well, the plate incubated at 37°C for 1 h. Next, 100 µL of streptavidin-HRP were added to the individual wells. Following 30 min incubation at 37°C on a shaking platform, the plates were washed three times with PBST buffer and 100 µL of TMB solution was added. Finally, OD values at 450 nm were determined with an enzyme-linked immunosorbent assay reader. Results of each sample were calculated as the mean ± SD from three independent experiments.
In order to determine the sensitivity and the the limit of quantification (LOQ) in α-amanitin detection by aptamers, 100 µL of different concentrations of α-amanitin (0.05, 0.1, 1, 5, 8, 10, 20, 40, 80 ng/mL per well) were incubated with 100 µL of 80 nM biotin-labeled aptamer, the remaining steps were the same as for the ELONA method. Results of each sample were calculated as the mean ± SD from three independent experiments.
2.8. Dot blot analysis
Dot blot assay was used for a rapid analysis of the specificity of aptamers [27, 28]. The toxins were diluted to a concentration of 40 ng/mL primarily, then α-amanitin (5 µL) and other non-target protein (5 µL) were spotted onto nitrocellulose membrane (BA85 Protran, 0.45 µm, Whatman, USA) and allowed to air dry. Next, these samples were blocked with 5% skimmed milk for 2 h at 37 ℃ and incubated with biotin-labeled aptamer (80 nM) for 2 h at room temperature. After washing three times with washing buffer (PBST), the membrane was incubated with streptavidin-HRP (1 µg/mL) for 1 h at 37 ℃. Excess enzyme was removed by three subsequent washes with PBST. Finally, the membrane was incubated with TMB solution at room temperature for 15 min without light.
2.9. Determination of the dissociation constants (KD) of aptamer H06
ELONA was used to analyze the KD value of the aptamer H06 for α-amanitin as described. First, the plates were coated with 800 ng per well of α-amanitin and incubated in a 96-well microtiter plate 1 h at 37°C. The wells were blocked 1 h with 5% skimmed milk in PBST and washed three times with PBST. Then, the biotin-labeled aptamer (Sangon, Shanghai) were diluted in PBS buffer of 10 nM, 40 nM, 80 nM or 160 nM, and 100 µL of the solution were added to each well, the plate incubated at 37°C for 1 h and washed three times. Subsequently, streptavidin-HRP was added and TMB solution was added as above. OD values at 450 nm were determined. The KD values were determined by nonlinear regression for on-site binding using GraphPad Prism version 5.0.03 (San Diego, CA, USA).
2.10. Detection of α-amanitin in mushrooms with aptamer-based ELONA
Eight types of poisonous mushroom were provided by Kunming institute of botany, Chinese academy of sciences. In pre-treated step, 5 g of mushroom sample was added with 5 mL of ultrapure water, lapping the mixture evenly via homogenate machine (Huaao, China). Then the supernatant was gained after centrifugation at 12000 × g for 10 min and the collecting was tested the presence of α-amanitin by the ELONA method, treatments as above and each well was monitored at absorbance OD value of 450 nm. Besides, the standard curve for α-amanitin detection was established. The standard α-amanitin was diluted with ultrapure water to the final concentrations of 5, 10, 20, 30, 40, 60, and 80 ng/mL, and used to detect α-amanitin by the ELONA method as described above. The concentrations of the standard α-amanitin are presented in the abscissa axis and the absorbance value at 450 nm in the ordinate axis to draw a linear curve for analysis of the results. Results of each sample were calculated as the mean ± SD from three independent experiments.
3.1. Selection of aptamers against α-amanitin
In our study, the selection of aptamers against α-amanitin by SELEX, and this process is shown in Figure 1. The effect of ssDNA bound to α-amanitin was detected in round 1-10 via gel electrophoresis (Fig. 2A). Then the ssDNA pools of round 10 was cloned to get individual aptamers and sequenced before using for further experiments. Through sequences analysis and comparison with each other, ten different sequences were obtained finally (Table 1).
Table 1. The detailed sequences of aptamers by cloning
|
Name |
Sequence (5’-3’) |
|
E01 |
GACATATTCAGTCTGACAGCGTACTGTCGACTATTGGGCGGTATGGGGACAACATTGCGTTGATGGACGAATATCGTCTAGC |
|
E02 |
GACATATTCAGTCTGACAGCGATTCGAGCAGTGTCGGATCGAATTGTTATCAGTGCCTGGAGATGGACGAATATCGTCTAGC |
|
E03 |
GACATATTCAGTCTGACAGCGTGCCCTGCCGCTCCCTACTCGGGTGGGGGATGATTTGGATGATGGACGAATATCGTCTAGC |
|
F01 |
GACATATTCAGTCTGACAGCGCTAGAGCGTATGCTGCTGCGATCTTATCCAGCATGAGCCCGGATGGACGAATATCGTCTAGC |
|
F02 |
GACATATTCAGTCTGACAGCGAGTCTGCGGCACATTTCAACGAGTCGTCCCGTATGCTAGTGATGGACGAATATCGTCTAGC |
|
F03 |
GACATATTCAGTCTGACAGCGCACGTGCACAGTCATGCATTCTGGCTGTACTACGGGCACTGATGGACGAATATCGTCTAGC |
|
H05 |
GACATATTCAGTCTGACAGCGCGCATGCGGTAACACATGAGTGAATCGCGCTATCTGCGTGGATGGACGAATATCGTCTAGC |
|
H06 |
GACATATTCAGTCTGACAGCGGAAGCGGGTCAGTCCAACTCACGGTCTCGGATGCACGGGAGATGGACGAATATCGTCTAGC |
|
H07 |
GACATATTCAGTCTGACAGCGTTCGTTGTGCACGTCGATGGTATGTTGTGTATACGGACTGGATGGACGAATATCGTCTAGC |
|
G02 |
GACATATTCAGTCTGACAGCGCGGCCGGCCAAATTCGCGAAGAGTCTCATTATTCATGAACGATGGACGAATATCGTCTAGC |
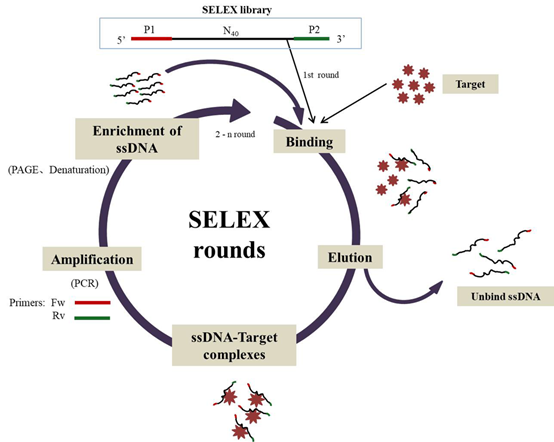
Figure. 1. SELEX procedure. The process includes iterative rounds, each round composed of several steps, construct ssDNA library (per oligonucleotide includes different primer regions and a randomized region ); ssDNA binds to the target; washing step; ssDNA amplification (via PCR); enrichment of ssDNA as the start of the next round
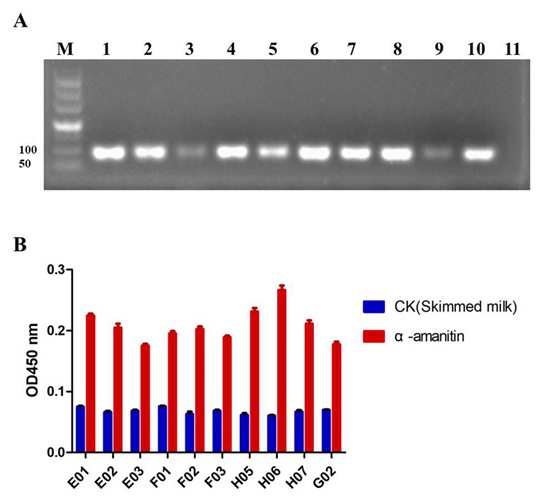
Fig. 2. The varification of SELEX and the preliminary selection of aptamers. (A) Agarose gel electrophoresis for PCR amplification of the DNA pools binding to α-amanitin in rounds 1-10 (lane 1-10, respectively), and the negative control is lane 11. (B) Ten sequences were obtained and the affinities of ten aptamers against their target were estimated by ELONA. The blank control is skimmed milk.
The binding ability of ten aptamers against the target was validated by ELONA preliminarily. In optical analysis, the titer was defined as the ratio of positive value to background value is greater than 2.1. The results indicated that ten aptamers all can recognize α-amanitin specifically, and the titer of aptamer named H06 exceeded the other aptamers, which suggested it able to detect α-amanitin with the highest specificity (Fig. 2B). Due to the binding force of the other nine aptamers was ordinary and the detection efficiency was approximately the same, aptamer H06 was ultimately chosen for further study of its secondary structure and ability to specifically bind α-amanitin. The sequence of aptamer H06 as follows: 5’-GACATATTCAGTCTGACAGCGGAAGCGGGTCAGTCCAACTCACGGTCTCGGATGCACGGGAGATGGACGAATATCGTCTAGC-3’.
3.2. Isolation and structural characterization of aptamers against α-amanitin
Aptamers can be combined with targets through their spatial conformation and secondary or tertiary structure. It is generally believed that the region which cannot form base pairings in the aptamer sequence may be the key sites that specifically interact with the target, whereas the regions of stable secondary structure formed in the aptamer are possibly an identifiable element that interacts with the space structure of the target. The structure prediction of aptamer H06 was analyzed by the online software Mfold, yielding one potential complex secondary structure (Fig. 3), including protruding loops and stems.
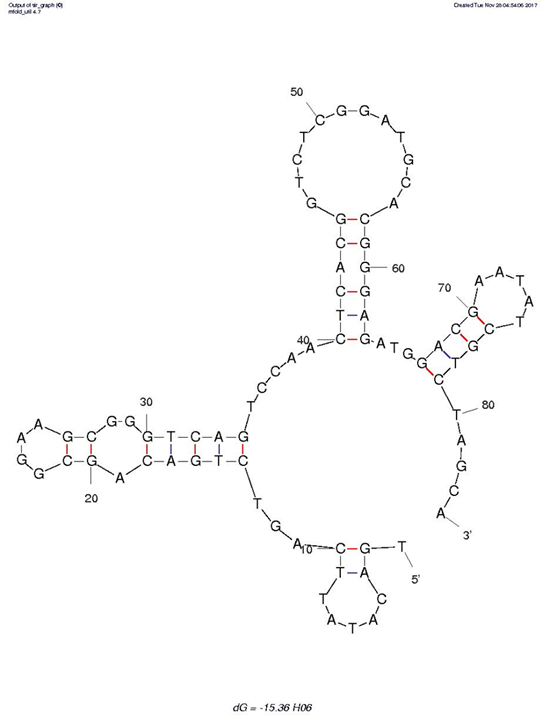
Figure. 3. Secondary structure of aptamers H06. The secondary structures of aptamer H06 was analyzed by the MFold software. The structure represents the secondary structure with the lowest free energy and stem-loop. Boxed G-doublets represent the highest probability (G-Score) of participating to the G-quadruplex formation, based on the QGRS Mapper software.
Normally, the hairpin structure is the most common structural element for aptamer recognition. Moreover, according to the Gibbs free energy (dG) value, aptamer H06 (dG=-15.36) indicates that a stable structure may be possessed. Afterwards, a QGRS-mapper was used to predict whether putative G-quadruplexes formed in aptamer H06, and the result displayed that a high probability for the presence of G-quadruplex structure, which also suggested the secondary structure of aptamer H06 was more stable in another way.
3.3. Circular Dichroism Spectroscopy
The secondary structure of aptamer may be significantly different in micelles with in solution, because micelles can cause unfavorable base pairing between oligonucleotides. Micelle may affect the oligonucleotide structure and the binding capability of the aptamers [29]. Aptamers can form a variety of secondary structures including hairpin structures, pseudoknots and G-quadruplexes etc. Hairpin structures is a kind of B-form DNA which formed by standard Watson-Crick base pairing between two strands of complementary DNA or one strand forming stem-loop structures. A G-quadruplexes is made by DNA with a large number of guanine nucleic acids through Hoogsteen hydrogen bonds [30]. CD spectroscopy can analyze the secondary structures of proteins and other biological macromolecules and it is a simple, fast and useful method to differentiate the parallel, anti-parallel, and mixed-type secondary structure of G-quadruplex DNA. To determine whether changes occur in the structure of aptamer H06 in different solutions, CD spectra were performed.
The aptamers were eluted from the affinity column by gradient concentrations of KCl solution. To determine if K+ has an effect on the aptamers, circular dichroism assay was used to detect the stability of the secondary structure of the aptamer H06 in different solutions, including 0 mM, 5 mM, 10 mM, 20 mM, 50 mM KCl and PBS buffer. Because the peak at 240 - 250 nm is the characteristic peak of the G-quadruplex and the peak at 275 - 285 nm is the characteristic peak of the stem-loop. As shown in Fig. 4, the chromatograms of aptamer H06 all have negative peaks between 240 - 250 nm and positive peaks between 275 - 285 nm at ultrapure water, PBS buffer and different concentrations of K+ solutions, respectively. Therefore, the secondary structure of aptamer H06 cannot affect by KCl solution in the elution operation of the SELEX, and aptamer H06 can be diluted with PBS buffer in the ELONA method.
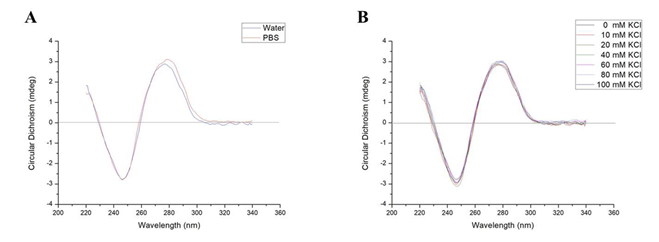
Figure. 4. Circular Dichroism Spectroscopy of aptamer. (A) Aptamer H06 was diluted in water and 10 mM PBS buffer (pH 7.4). (B) Aptamer H06 was diluted in 20 mM Tris-HCl buffer (pH 7.2) containing different concentrations of K+ solution, 0 mM (black), 5 mM (blue), 10 mM (green), 20 mM (purple), and 50 mM (red). Data show the mean of three independent experiments (n = 3).
3.4. Specificity characterization of the aptamers against α-amanitin
Specificity of aptamer H06 against α-amanitin was verified with two methods. The experiment was performed using the target (α-amanitin) or the structural analogs (β-amanitin, γ-amanitin) or the other non-target toxins. The result of ELONA indicated aptamer H06 can recognize α-amanitin with high specificity, but not non-specific binding to other toxins (Fig. 5A). Similarly, dot blot assay showed that the dot size and intensity of aptamer H06 were higher than any of the control protein, which also can confirm the specificity of aptamers H06 agaimst α-amanitin, (Fig. 5B). No cross-reaction with non-target protein was observed. In summary, the results above clearly showed that aptamer H06 displayed a strong specificity for α-amanitin determination.
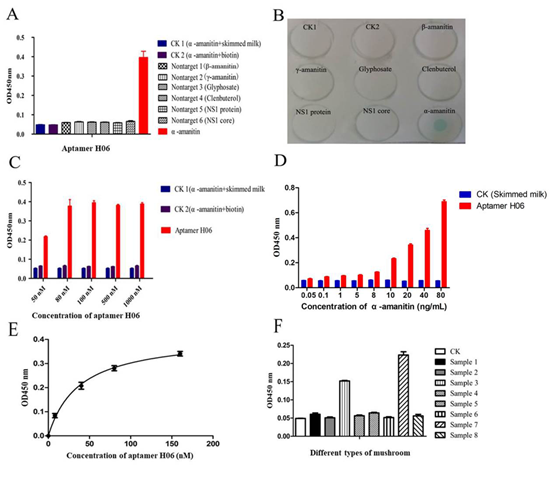
Figure. 5. Characterization and identification of aptamer H06 with α-amanitin. (A) ELONA plot for aptamer H06 binding to α-amanitin or nonspecific toxins. All the experiments were made in triplicate and the average of three different experiments is shown. Statistical significance was calculated between the value of α-amanitin /CK- >cut off 2.1. (B) Dot blot result for α-amanitin and CK or other protein probed with biotin-labeled aptamer H06. The membrane shown is representative of at least three different experiments. (C) ELONA results for 40 ng/mL α-amanitin incubated with biotin-labeled aptamer H06 (50 nM, 80 nM, 100 nM, 500 nM and 1000 nM). These data are the average of a triplicate experiment. (D) ELONA results for α-amanitin (4, 40, 100, 400, 500, 800, 1000, 2000, 4000 ng/well, 100 μL of each well) incubated in the presence of biotin-labeled aptamer H06. Statistical significance was calculated between the value of α-amanitin /CK- >cut off 2.1. These data are the average of a triplicate experiment. (E) Determination of binding affinity, KD value of the DNA aptamer H06 by ELONA. The biotin-labeled aptamer were diluted in selection buffer at 10 nM, 40 nM, 80 nM and 160 nM. The average mean OD450 of varying concentration of aptamer H06 obtained was plotted to determine dissociation constant KD. All experiments were repeated six times and an error bar represents the standard deviation of means. (F) Detection of α-amanitin in different mushroom samples. All experiments were repeated three times and an error bar represents the standard deviation of means.
3.5. Optimum working concentration of aptamer for α-amanitin detection
ELONA was performed to determinate the optimal working concentration of aptamer for α-amanitin detection. 40 ng/mL α-amanitin was incubated with the different concentrations of biotin-labeled aptamer H06 (50 nM, 80 nM, 100 nM, 500 nM or 1 µM) at 37℃ for 2 h and the absorbance at 450 nm was recorded. As shown in Fig. 5C, aptamer H06 can specifically bind with α-amanitin at a concentration of between 50 nM to 1000 nM, and when the concentration of aptamer H06 was 50 nM, the ratio of positive to negative values is greater than 2.1, which is of biological significance. Hence, we considered that the optimal concentration of aptamer H06 to detect α-amanitin was 50 nM.
3.6. Affinity characterization of the aptamer for α-amanitin detection
The affinity of the aptamer is represented by the dissociation constants. ELONA method was used to perform this characteristic of the aptamer H06 within the concentration range of 10 - 160 nM. The GraphPad Prism software was used to draw nonlinear curve fitting analysis for KD calculation. The KD value was 37.5±5.135 nM for aptamer H06 (Fig. 5E), which suggested the high affinity of aptamer H06 for α-amanitin detction.
3.7. Sensitivity characterization of the aptamer for α-amanitin detection
The sensitivity of aptamer H06 against α-amanitin was performed with ELONA. According to the absorbance value of control group at 450 nm, the ratio of positive value to negative value can be calculated. As shown in Fig. 5D, when the concentration of α-amanitin reaches 8 ng/mL, and the ratio was greater than 2.1. With the increase in the concentration of α-amanitin, the positive values at 450 nm show a linear growth trend, which means this apta-based assay may achieve quantitative detection in further study. Therefore, we can calculate the ELONA assay based on aptamer H06 had a minimum detectable concentration of α-amanitin was 8 ng/mL, when the coating concentration of aptamer H06 was 50 nM.
3.8. Detection of α-amanitin in mushroom samples
To determine if aptamer H06 can directly detect a-amanitin in mushrooms, we picked different kinds of mushrooms from four markets, numbered simple 1-8. ELONA was performed to set up a standard curve (Fig. 6) and validate whether the selected aptamer H06 could bind with α-amanitin in mushroom samples. The result showed that α-amanitin was detected specifically in sample 1 and sample 7 (Fig. 5F). In order to prove the reliability of the apta-based detection assay, we also conducted high performance liquid chromatography (HPLC) which is the national standard method to verify the result above, and it showed the same as the ELONA. Therefore, the data clearly suggest that aptamer H06 can be used as effective tool for detection of α-amanitin.
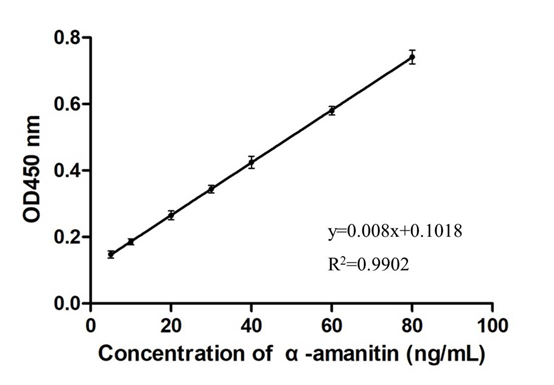
Figure. 6. The standard curve for α-amanitin detection by the ELONA method. The standard α-amanitin was diluted with ultrapure water to the final concentrations of 5, 10, 20, 30, 40, 60, and 80 ng/mL, and used to detect α-amanitin by the ELONA method as described above. The concentrations of the standard α-amanitin are presented in the abscissa axis and the absorbance value at 450 nm in the ordinate axis to draw a linear curve for analysis of the results.
The characterization of aptamer H06 displayed that it has a strong binding affinity and high specificity against α-amanitin, and a great potential for detection and recognition of α-amanitin for in-field application. Assay and manufacturing costs of aptamers are expected to be significantly lower than HPLC and ELISA that currently used for rapid α-amanitin detection because of the economical synthesized manner. In addition, our results suggested that aptamer H06 had great specificity for α-amanitin rather than β-amanitin or γ-amanitin. In 2015, Xu’s paper developed a novel assay to direct detect α-amanitin in serum using carbon quantum dots-embedded specificity determinant imprinted polymers [31]. Compared with HPLC, the fluorescence sensor has no any pre-treatment. But its detection sample is the serum which is provided by the poisoned patients, not mushroom entity. The aptamer-based detection method has more advantages than the above methods in several performances (Table 2), except no pre-treatment, it has easier operation, lower limit of detection and lower detection cost. In the future, the aptamer-based assay will likely to establish a direct detection platform for α-amanitin in the field of food safety and medical inspection.
Table 2. Comparison of the characteristics of various methods in detecting α-amanitin
|
Performances |
Detection methods |
|||
|
ELISA kit |
HPLC |
The fluorescent sensor |
The apta-based ELONA |
|
|
Detection sample |
wild mushroom |
wild mushroom |
serum |
wild mushroom |
|
Preparation and detection time (h) |
1.5 |
5 |
72 |
3.75 |
|
Difficulty of operation |
easy |
difficult |
medium |
easy |
|
Limit of detection (ng/mL) |
3000 |
5 |
15 |
8 |
|
Price / sample (rmb) |
15 |
250 |
no referred |
1.5 |
*The information of HPLC assay was provided by Analytic & Testing Research Center of Yunnan.
In conclusion, we successfully screened aptamers against α-amanitin via the SELEX process in vitro, and provided an aptamer-based detection system for α-amanitin. A series of studies about the properties of aptamers demonstrate that aptamer H06 has higher specificity and sensitivity. And the KD value of H06 was determined to be in a low level (KD=37.5±5.135 nM), with higher affinity. By detecting different kinds of mushrooms, the result of the apta-based ELONA method was coincident with HPLC. Hence, aptamer H06 can be considered as a useful identification element in the aptamer-based detecting system for α-amanitin. In future study, we will focus on the aptamer-based biosensors field, such as detection kits, later flow strip assay etc., developing a rapid, specific, sensitive and cost-effective detection method.
Funding: This work was supported by the National Natural Science Foundation of China (NSFC Grant No. 31560559), Yunnan Province Science and technology program (Project No. 2015FB121), and the Yunnan Province Science and technology program (Project No. 2016FB146).
Author’s contributions: Conceived and designed the experiments: Q.Q.H., Y.Z.S., J.Y.Z. and X.S.X. Performed the experiments: M.W.Q. and L.J. Analysed the data: L.J., J.L., Y.Z.S., Q.C. and J.Y.Z. Wrote the paper: Q.Q.H, X.M.Z. and L.J. All of the authors reviewed and approved the final manuscript.
Hess J., Skrede I., Wolfe B.E., et al., Transposable element dynamics among asymbiotic and ectomycorrhizal Amanita fungi, Genome Biol Evol. 2014, 6: 1564-1578. DOI: 10.1093/gbe/evu121.
View ArticleSchmutz M., Carron P.N., Yersin B., et al., Mushroom poisoning: a retrospective study concerning 11-years of admissions in a Swiss Emergency Department, Intern Emerg Med. 2016, 13: 1-9. DOI: 10.1007/s11739-016-1585-5.
View ArticleMikaszewska-Sokolewicz M.A., Pankowska S., Janiak M., et al., Coma in the course of severe poisoning after consumption of red fly agaric (Amanita muscaria), Acta Biochim Pol. 2016, 63: 181-182. DOI: 10.18388/abp.2015_1170.
View ArticleYilmaz I., Ermis F., Akata I., et al., A Case Study: What Doses of Amanita phalloides and Amatoxins Are Lethal to Humans?, Wilderness Environ Med. 2015, 26: 491-496. DOI: 10.1016/j.wem.2015.08.002.
View ArticleGarcia J., Costa V.M., Carvalho A., et al., Amanita phalloides poisoning: Mechanisms of toxicity and treatment, Food Chem Toxicol. 2015, 86: 41-55. DOI: 10.1016/j.fct.2015.09.008.
View ArticleRahmani F., Ebrahimi Bakhtavar H.,Ghavidel A., Acute hepatorenal failure in a patient following consumption of mushrooms: a case report, Iran Red Crescent Med J. 2015, 17: e17973. DOI: 10.5812/ircmj.17973.
View ArticleLi P., Deng W.,Li T., The molecular diversity of toxin gene families in lethal Amanita mushrooms, Toxicon. 2014, 83: 59-68. DOI: 10.1016/j.toxicon.2014.02.020.
View ArticleLima A.D., Costa Fortes R., Carvalho Garbi Novaes M.R., et al., Poisonous mushrooms: a review of the most common intoxications, Nutr Hosp. 2012, 27: 402-408. DOI: 10.1590/S0212-16112012000200009.
Kirchmair M., Carrilho P., Pfab R., et al., Amanita poisonings resulting in acute, reversible renal failure: new cases, new toxic Amanita mushrooms, Nephrol Dial Transplant. 2012, 27: 1380-1386. DOI: 10.1093/ndt/gfr511.
View ArticleSu J., Wang D., Norbel L., et al., Multicolor Gold-Silver Nano-Mushrooms as Ready-to-Use SERS Probes for Ultrasensitive and Multiplex DNA/miRNA Detection, Anal Chem. 2017, 89: 2531-2538. DOI: 10.1021/acs.analchem.6b04729.
View ArticleGarcia J., Costa V.M., Baptista P., et al., Quantification of alpha-amanitin in biological samples by HPLC using simultaneous UV- diode array and electrochemical detection, J Chromatogr B Analyt Technol Biomed Life Sci. 2015, 997: 85-95. DOI: 10.1016/j.jchromb.2015.06.001.
View ArticleSgambelluri R.M., Epis S., Sassera D., et al., Profiling of amatoxins and phallotoxins in the genus Lepiota by liquid chromatography combined with UV absorbance and mass spectrometry, Toxins (Basel). 2014, 6: 2336-2347. DOI: 10.3390/toxins6082336.
View ArticleKaya E., Karahan S., Bayram R., et al., Amatoxin and phallotoxin concentration in Amanita phalloides spores and tissues, Toxicol Ind Health. 2015, 31: 1172-1177. DOI: 10.1177/0748233713491809.
View ArticleSun H., Tan W.,Zu Y., Aptamers: versatile molecular recognition probes for cancer detection, Analyst. 2016, 141: 403-415. DOI: 10.1039/c5an01995h.
View ArticleSett A., Borthakur B.B.,Bora U., Selection of DNA aptamers for extra cellular domain of human epidermal growth factor receptor 2 to detect HER2 positive carcinomas, Clin Transl Oncol. 2017, 19: 976-988. DOI: 10.1007/s12094-017-1629-y.
View ArticleYu P., He X., Zhang L., et al., Dual recognition unit strategy improves the specificity of the adenosine triphosphate (ATP) aptamer biosensor for cerebral ATP assay, Anal Chem. 2015, 87: 1373-1380. DOI: 10.1021/ac504249k.
View ArticleBrozovic M., Dantec C., Dardaillon J., et al., ANISEED 2017: extending the integrated ascidian database to the exploration and evolutionary comparison of genome-scale datasets, Nucleic Acids Res. 2018, 46(D1): D718. DOI: 10.1093/nar/gkx1108.
View ArticleDuan N., Gong W., Wu S., et al., An ssDNA library immobilized SELEX technique for selection of an aptamer against ractopamine, Anal Chim Acta. 2017, 961: 100-105. DOI: 10.1016/j.aca.2017.01.008.
View ArticleDuan N., Gong W., Wu S., et al., Selection and Application of ssDNA Aptamers against Clenbuterol Hydrochloride Based on ssDNA Library Immobilized SELEX, J Agric Food Chem. 2017, 65: 1771-1777. DOI: 10.1021/acs.jafc.6b04951.
View ArticleMallikaratchy P., Evolution of Complex Target SELEX to Identify Aptamers against Mammalian Cell-Surface Antigens, Molecules. 2017, 22: 215. DOI: 10.3390/molecules22020215.
View ArticleSharma T.K., Bruno J.G.,Dhiman A., ABCs of DNA aptamer and related assay development, Biotechnol Adv. 2017, 35: 275-301. DOI: 10.1016/j.biotechadv.2017.01.003.
View ArticleTeng J., Yuan F., Ye Y., et al., Aptamer-Based Technologies in Foodborne Pathogen Detection, Front Microbiol. 2016, 7: 1426. DOI: 10.3389/fmicb.2016.01426.
View ArticleHu P.P., Recent Advances in Aptamers Targeting Immune System, Inflammation. 2017, 40: 295-302. DOI: 10.1007/s10753-016-0437-9.
View ArticleYang Q., Zhou L., Wu Y.X., et al., A two dimensional metal-organic framework nanosheets-based fluorescence resonance energy transfer aptasensor with circular strand-replacement DNA polymerization target-triggered amplification strategy for homogenous detection of antibiotics, Anal Chim Acta. 2018, 1020: 1-8. DOI: 10.1016/j.aca.2018.02.058.
View ArticleWang Y., Li J., Qiao P., et al., Screening and application of a new aptamer for the rapid detection of Sudan dye III, European Journal of Lipid Science & Technology. 2018: 1700112. DOI: 10.1002/ejlt.201700112
View ArticleSong Q., Qi X., Jia H., et al., Invader Assisted Enzyme-Linked Immunosorbent Assay for Colorimetric Detection of Disease Biomarkers Using Oligonucleotide Probe-Modified Gold Nanoparticles, J Biomed Nanotechnol. 2016, 12: 831-839. DOI: 10.1166/jbn.2016.2257
View ArticleAlbuquerque P., Ribeiro N., Almeida A., et al., Application of a Dot Blot Hybridization Platform to Assess Streptococcus uberis Population Structure in Dairy Herds, Front Microbiol. 2017, 8: 54. DOI: 10.3389/fmicb.2017.00054.
View ArticleNg K.Y.,Machida K., Rosette Assay: Highly Customizable Dot-Blot for SH2 Domain Screening, Methods Mol Biol. 2017, 1555: 437-451. DOI: 10.1007/978-1-4939-6762-9_26.
View ArticleTakahashi S.,Sugimoto N., Volumetric contributions of loop regions of G-quadruplex DNA to the formation of the tertiary structure, Biophys Chem. 2017, 231: 146-154. DOI: 10.1016/j.bpc.2017.02.001.
View ArticleNagatoishi S.,Sugimoto N., Interaction of water with the G-quadruplex loop contributes to the binding energy of G-quadruplex to protein, Mol Biosyst. 2012, 8: 2766-2770. DOI: 10.1039/c2mb25234a.
View ArticleFeng L., Tan L., Li H., et al., Selective fluorescent sensing of alpha-amanitin in serum using carbon quantum dots-embedded specificity determinant imprinted polymers, Biosens Bioelectron. 2015, 69: 265-271. DOI: 10.1016/j.bios.2015.03.005.
View Article