Shan Xiao,
Phone: +86-0769-22861828; Fax: +86-0769-22861828;
E-mail:xiaoshan@dgut.edu.cn
© 2019 Sift Desk Journals. All Rights Reserved
VOLUME: 4 ISSUE: 6
Page No: 822-829
Shan Xiao,
Phone: +86-0769-22861828; Fax: +86-0769-22861828;
E-mail:xiaoshan@dgut.edu.cn
Ji-hui Wang1,2, Xiao-yu Zhao2, Jia-ming Cai2, Han Wang2, Shan Xiao1*
1 Engineering Research Center of Health Food Design & Nutrition Regulation, School of Chemical Engineering and Energy Technology, Dongguan University of Technology, Dongguan, 523808, China
2 College of Biological Engineering, Dalian Polytechnic University, Dalian, 116034, China
Sajjad Pourmozaffar(Sajjad5550@gmail.com)
Hideo Ozawa(ozawa@bio.kanagawa-it.ac.jp)
Guangxu Liu(guangxu_liu@zju.edu.cn)
Jing Xing(xingjing@ouc.edu.cn)
Shan Xiao, Ji-hui Wang, Xiao-yu Zhao, Jia-ming Cai, Han Wang, The quality assessment of frozen shrimp (Metapenaeus ensis): protein changes, texture and total volatile basic nitrogen(2019)Journal of Food Science & Technology 4(6)
Proteins of shrimp muscle suffered chemical and physical changes during frozen storage which may result in quality deterioration. There are lots of parameters widely used to assess the degree of protein changes. While, not much information was available on using different parameters to investigate changes in proteins of frozen shrimp. The present study was conducted to evaluate the changes in proteins using different parameters, including myofibrillar solubility, myofibrillar size distribution and myofibrillar UV absorption spectrum. Meanwhile, in order to make clear the direct effects of these protein changes on frozen shrimp quality, the variation in total volatile basic nitrogen (TVB-N), texture and microstructure were determined as well. The results of this research may help to better understand the mechanism of frozen shrimp quality deterioration. The results showed that the protein had been changed during shrimp frozen storage which could result from protein freeze denaturation, protein oxidation, protein degradation and other biochemical actions. All the three parameters could well characterize the changes in protein during shrimp frozen storage. It was shown that the TVB-N levels increased, and the texture and microstructure went worse over shrimp frozen storage. These variations could be the results of protein changes.
Keywords Shrimp, Frozen, Quality, Protein
Shrimp is a good source of high-quality protein, additionally, since it is low in fat and rich in omega-3 fatty acids, it has become the most-favored seafood product all over the world. While, fresh shrimp is highly perishable after capture leading to its quality deterioration which is associated with microbial spoilage, chemical changes and melanosis (blackening) (Ghaly et al., 2010). It has been estimated that chemical deterioration and microbial spoilage are responsible for loss of 25% of fishery products every year (Manheem et al., 2012). And around 4-5 million tons of trawled shrimp are lost every year due to enzymatic and microbial spoilage because of improper storage (Ghaly et al., 2010). In general, quality spoilage of shrimp starts within 24 h after their catch due to chemical, enzymatic or microbial activities. It not only results in nutritional value loss but also leads to significant economic loss in shrimp. Thus, many methods are used to retard quality loss during shrimp and other muscle foods storage, such as adding preservatives, pre-cooking, modified atmosphere packing, freezing and high pressure storage, etc (Zhou et al., 2010). Among them, freezing is most common and more easily available. While, although freezing is the best way to inhibit microbial growth and slow chemical changes, it is reported that frozen shrimp also suffered quality deterioration due to oxidative, enzymatic and microbial spoilage continue at slower rate (Neumeyer et al., 1997). These changes from freezing could lead to shrimp quality deterioration in texture, water-holding capacity, protein solubility, off-flavors, rancidity, dehydration, weight loss, juiciness loss, drip loss and toughening, as well as microbial spoilage and autolysis (Jackson et al., 2001; Hassan and Ali, 2011).
Protein is the most abundant solid material for muscle food. On average, shrimp muscle tissue contains around 20% crude protein which formed by three large groups, they are referred to myofibrillar protein, sarcoplasmic protein and stromal protein (Lu et al., 2011). There are lots of parameters widely used to assess the degree of protein changes including protein solubility, SDS-PAGE, protein oxidation, protein degradation, etc. The changes of these biochemical parameters in shrimp are closely related to quality changes (Wang et al., 2013). While, not much information was available on using different parameters to investigate changes in protein during shrimp frozen storage. The present study was conducted to track protein changes using different parameters, including myofibrillar solubility, myofibril size distribution and myofibrillar UV absorption spectrum during shrimp (Metapenaeus ensis) frozen storage. Meanwhile, in order to make clear the possible effects of these changes on frozen shrimp quality, the variations in total volatile basic nitrogen (TVB-N), texture and microstructure were determined as well. The results of this research may help to better understand the mechanism of quality deterioration in frozen shrimp.
Materials
Sample collection
The shrimps (Metapenaeus ensis) were obtained from a local aquaculture farm in Dalian, Liaoning province, China. The shrimps were kept in an ice bath and transported to the laboratory in 2 h. Shrimps were packed in the polyethylene bags (polyethylene, 2,300 mL/m2/24 h at 0 ℃, Rande Packaging Products, Shanghai, China). And then samples were frozen at -18 ℃ for up to 7 weeks. The quality of shrimp was analyzed before freezing (0 wk) and after 1, 3, 5, and 7 weeks frozen storage. At each storage point, protein changes (solubility, size distribution, UV absorption spectrum), TVB-N, texture and microstructure were determined.
Methods
Myofibrillar determination
Myofibrillar protein extraction
The myofibrillar protein was extracted according to the method of Srinivasan et al (1997) with slight modification. Shrimp muscle (10 g) was homogenized in 50 ml buffer containing 0.1 M KCl, 2 mM MgCl2, 1 mM EDTA and 10 mM K2HPO4 (pH 7.0) at a speed of 20,000×g for 15 s. And then it was centrifuged at 2,000×g (4 ℃) for 10 min. After decanting the supernatant, the sediment was collected. Then repeated above steps for more than three times. After the suspension was filtered with gauze. The protein concentration was determined using Bradford method (1976), and then the myofibrillar protein was collected and stored at -80 ℃.
Protein solubility determination
Based on the method of Srinivasan et al (1997), the solubility of myofibril was determined. Briefly, the myofibrillar protein solution of 10 mg/ml was centrifuged for 40 min at 4000 ×g at 4 ℃, the absorbance value of the supernatant was determined by Biuret method. The solubility was calculated according to the following formula:
s=m1/m2 ´100%
s---solubility, %
m1--- protein content in supernatant, mg/ml
m2--- protein content in sample, mg/ml
Protein size distribution determination
The size distribution of myofibrillar protein was measured by dynamic light scattering (SZ-100, Horiba Scientific, Kyoto, Japan) according to the method of Pan and Yeh (1993). Briefly, the myofibrillar protein solution of 1 mg/ml was prepared with deionized water. The particle size and distribution were measured at room temperature (25 ℃), the distilled water was used as dispersion medium and the refractive index of dispersant was 1.330.
UV absorption spectrum
The myofibrillar protein was diluted with 0.6 M NaCl followed by centrifuge at 10,000×g for 15 min at 4 ℃. The supernatant was diluted to a concentration of 0.5 mg/ml and the absorption spectrum was obtained through measuring the absorption spectrum over the range of 220 to 360 nm.
TVB-N
Total volatile base-nitrogen (TVB-N) measurement was conducted following the method described by Aubourg et al (1997). Briefly, finely mincing shrimp muscle (5 g) was dissolved with distilled water. The mixture was prepared for use after efficiently stirring and 30 min standing. The extracted solution was obtained after filtering, and then it was analyzed by Semi-micro kjeldahl nitrogen determination apparatus (KDY-9820, Tongrunyuan Electromechanical Technology, Beijing, China). The results were expressed as mg TVB-N/100 g muscle.
Texture determination
The texture of the shrimp samples was measured using a texture analyzer (TAXT-2, Stable Micro System, Make, UK) equipped with 25 kg load cell. Samples were thawed at room temperature for 30 min before analysis. The second quarter of the shrimp was compressed to 40% of its original length using a cylindrical probe with a test speed of 1 mm/s. The values of adhesiveness, springiness, hardness, cohesiveness and chewiness were obtained directly from the acquired force-time curve.
Microstructure
The second segment of shrimp was cut into 5 mm wafer and then it was fixed using 2.5% glutaraldehyde at 4 ℃ over night. The sample was washed using 0.1 M phosphate buffer for three times and dehydrated with ethanol. After freeze-drying, the samples were scanned using a Scanning Electron Microscopy (JSM-6460LV, Jeol Ltd., Tokyo, Japan).
Statistical analysis
The changes in protein, TVB-N and texture were analyzed using SPSS program (Version 22.0, SPSS inc, Chicago, USA). Two-way analysis of variance (ANOVA) was used for differences in the means of the values of protein, TVB-N and texture. These differences were further identified using two-sample Student-t tests assuming equal variances. The statistical significance was set at p ≤ 0.05.
Protein changes
Protein solubility
Many scientists reported that frozen storage resulted in shrimp quality deterioration which was accompanied by loss in muscle protein characteristics mainly solubility, water retention, gelling ability, etc (Colmenero and Borderias, 1983; Lee and Um, 1995). As shown in Fig.1, myofibrillar soluble protein concentration decreased over storage time, the significant (p<0.05) decreases were found at first (0-1 wk) and third (3-5 wk) stages. The decrease in myofibrillar soluble protein concentration could be caused by the process known as freeze denaturation which resulted in protein tertiary structure destroyed and the precipitation of protein-protein cross-linking occurred. Sultanbawa and Li-Chan concluded that, during muscle food frozen storage, the decrease in protein solubility was a primary criterion of protein denaturation, which mainly triggered by hydrophobic interaction, oxidation and ionic interaction (Sultanbawa and Li-Chan,1998). The results of present study were in line with previous reports which carried out in shrimp and fish. Sriket et al (2007) reported that white shrimp and black tiger shrimp protein solubility decreased as the freeze-thaw cycles increased. Faruk et al (1997) reported that myofibrillar protein solubility of rohu fish (Labeo rohita) decreased to 32% during 24 days of ice storage. While, Duum and Rustad (2007) found that Atlantic cod’s salt soluble protein concentration (mainly myofibril) increased during frozen storage.
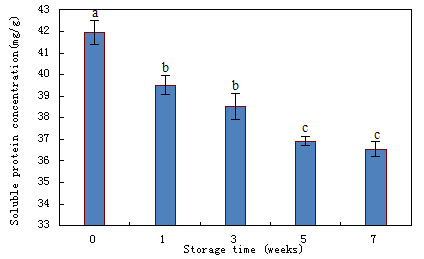
Fig.1. The soluble myofibrillar protein concentration changes during shrimp frozen storage. Bars represent the standard deviation (n=5). Different letters on the bars indicate the significant differences (p<0.05).
Myofibril size distribution
To our knowledge, very rare information was available about the changes of myofibril size distribution during seafood or shrimp storage. In current study, as shown in Fig.2, at wk 0, the myofibril size distribution was presented three characteristic peaks, which distributed from 1 nm to 1000 nm. As storage time prolonged, the main typical characteristic peak moved to the right along the abscissa, which means the myofibrillar diameter increased gradually and became larger and larger with storage time extended. This phenomenon could be attributed to the decreased proportion of lower molecular-weight protein and protein aggregation induced by protein oxidation and other biochemical reactions. As a result, the myofibrillar diameter increased over frozen storage. These data were consistent with the decreased myofibrillar solubility during shrimp frozen storage which were obtained in pork (Pan, 2011).
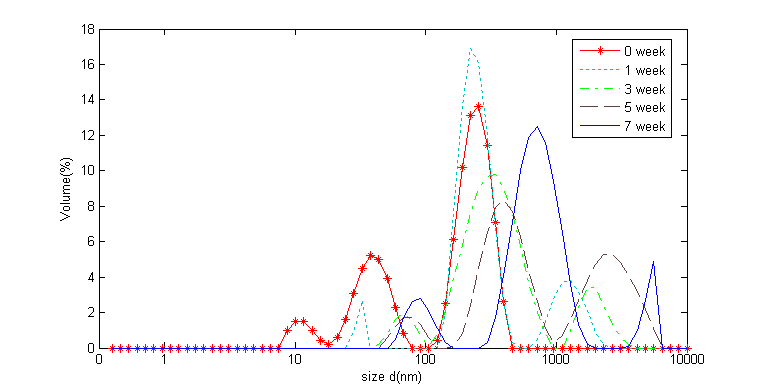
Fig.2. The changes of the protein size distribution during shrimp frozen storage
UV absorption spectrum
The UV absorption spectrum of myofibril during shrimp frozen storage was shown in Fig.3. It was demonstrated that, for fresh shrimp (wk 0), a characteristic absorption peak at 270 nm was observed in myofibril. With storage time prolonged, the square of characteristic absorption peak decreased. From wk 5 to wk 7, the characteristic absorption peak almost disappeared. For muscle food, the characteristic absorption peak at 270 nm is closely associated with the concentration of aromatic amino acid (such as Tyr, Trp and Phe) (Park and Xiong, 2007; Pan, 2011). The severe changes of the characteristic absorption peak could be attributed to protein freeze denaturation and oxidation in shrimp which subjected to freezing process which were found in fish (Hao and Sterling, 1970) and pork product (Pan, 2011).
In this study, three different parameters were used to track the changes of protein over shrimp frozen storage. All the data indicated that the protein had been changed during shrimp frozen storage. And these parameters gave us evidences why and how did the protein change. As for which parameter is better indicator, we could not give the clues, because all three parameters could characterize the changes of protein in different ways. And it is no doubt that using multiple indexes to characterize protein changes is better than the single index.
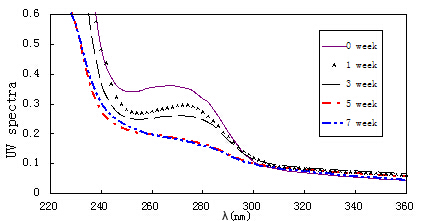
Fig.3. The UV absorption spectrum of myofibrils during shrimp frozen storage
Texture
Texture is an important quality index for aquatic product which was used to represent comprehensive feeling, including the tissue state, structure and taste. Many studies showed that fresh shrimp was relatively firm, and then became mushy during further storage (Ashie and Simpson, 1996; Hultmann and Rustad, 2004). It is reported that fish stored several months in freezer (-18 ℃) became tough, chewy and rubbery (Sikorski and Kołakowska, 1995). In this study, texture of shrimp was measured using texture analyzer in TPA mode to simulate fingers. As shown in Table 1, the adhesiveness of fresh Metapenaeus ensis showed an increase trend over frozen storage duration. This phenomenon maybe attributed to protein denaturation which was discussed above. Meanwhile, the reduced binding force between cells resulted in adhesiveness increased. Springiness reflects the recovery degree after the external force actions, and it can also reflect the visual effect (Jiang and Wu, 2004). As shown in Table 1, compared with the fresh shrimp, the springiness of the Metapenaeus ensis declined rapidly during the initial 5 wk storage. Hardness reflects the internal binding force for keeping certain shape of food (Malcolm, 2002). In the present study, it was indicated that the hardness of the shrimp significantly decreased during the initial 5 wk frozen storage (Table 1, p<0.05). This could partially due to the freezing denaturation process happened in shrimp. And the formation of ice crystals led mechanical damage to muscle cells which resulted in protein damage and lower hardness. Cohesiveness expresses resistance when chewing food, and it is used to simulate the internal binding force of sample (Storey et al., 1984). The cohesiveness of the shrimp showed a decreasing trend over freezing storage (Table 1). It may be caused by the action of enzymes and microorganism which resulted in degradation in protein. Chewiness is defined as the ability to chew solid food which is connected with hardness, springiness and cohesiveness (Malcolm, 2002). As shown in Table 1, the chewiness of the shrimp decreased significantly from wk 0 to 3. The reduced chewiness could be a result of the combined effects of muscle hardness, elasticity and cohesiveness.
Overall, from our study, it was shown that the texture of shrimp went worse over storage duration, and the rapid changes were found in initial storage stages. These variations could be the results of protein changes we discussed above.
Table 1. Changes of adhesiveness, cohesiveness, springiness, hardness and chewiness during shrimp frozen storage1
|
Structure |
Storage time (weeks) |
||||
|
0 |
1 |
3 |
5 |
7 |
|
|
Adhesiveness (g/sec) |
-30.87±1.83a |
-21.45±2.7b |
-19.51±1.96b |
-14.64±2.03c |
-14.48±2.34c |
|
Springiness (mm) |
0.85±0.04a |
0.75±0.06b |
0.62±0.05c |
0.54±0.07d |
0.52±0.04d |
|
Hardness (g) |
1105.91±90.07a |
891.35±81.46b |
840.79±75.81b |
723.30±53.12c |
705.60±35.31c |
|
Cohesiveness |
0.58±0.08a |
0.53±0.06ab |
0.48±0.07ab |
0.46±0.07b |
0.45±0.054b |
|
Chewiness (g/mm) |
1055.17±213.44a |
937.70±152.64b |
556.55±132.28c |
494.52±105.54c |
472.93±112.79c |
1The values are mean±standard deviation. On the same row, means with different letters differ significantly (p<0.05), n=5.
Microstructure
The effects of different freezing time on the muscular transection were shown in Fig.4. It was shown that the transection of fresh metapenaeus ensis was smooth and dense. And the structure was complete. There were some small and regular holes between the muscular tissue. After one week frozen, the muscular structure was relatively dense and the holes became bigger. At wk 7, the transverse had been gelatinized. This maybe caused by freezing process which converted most of water in muscle into ice. Sultanbawa and Li-Chan (2001) reported that surimi without cryoprotectant lost more water due to freeze denaturation. As the storage time extended, the number of small ice crystals was reduced even finally vanished, while the number of big ice crystals increased. The formation of large ice crystals damaged the walls of cells which could result in these changes. Besides, the endomysium of muscle tissue especially connective tissue could degrade during frozen storage, which caused more gaps forming between tissues. The results were consistent with the data which the size of the protein particle increased during frozen storage we found above. Chantarasataporn also found the microstructure of Pacific white shrimp became more swollen in width, detachable in length and distorted in sacromere during storage (Chantarasataporn et al., 2013).
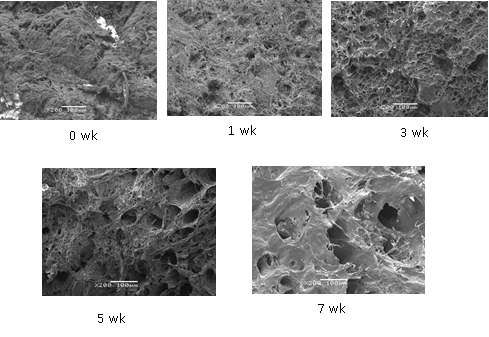
Fig.4. The changes of the protein microstructure during shrimp frozen storage
TVB-N
It is known that determination of TVB-N is an indicator of freshness commonly used in aquatic trade (Storey et al., 1984), and the low value of TVB-N is an indication of freshness. And it can indicate quantity of nitrogenous bases (trimethylamine, dimethylamine and ammonia) produced from spoilage of shrimp (Galleguillos, 1996). In current study, the changes of TVB-N during shrimp frozen storage were shown in Table.2. The initial TVB-N value was 3.15 mg N/100 g muscle, and then the value continued to increase until reached a maximum at wk 7. It is reported that when the TVB-N concentration of shrimp was greater than 30 mg N/100 g muscle, it would have a significant negative effect on the consumption (Ricque et al., 1998). In present study, the concentrations of frozen shrimp were much lower than the critical value. It means that shrimp could keep fresh and it can be accepted by consumers after 7 weeks frozen storage. Similar results were observed by Imran, Chawalit and Somrote (2013). The decreased levels of TVB-N during shrimp frozen storage could result from proteolysis and protein oxidation evidenced by the changes in protein we found above, and the microbial action could be another reason.
Table 2. Changes of TVB-N value during shrimp frozen storage1
|
Parameter |
Storage time (weeks) |
||||
|
0 |
1 |
3 |
5 |
7 |
|
|
TVB-N (mg/100 g) |
3.15±0.13a |
5.13±0.20b |
5.24±0.11b |
6.03±0.23c |
6.11±0.20c |
1The values are mean±standard deviation. On the same row, means with different letters differ significantly (p<0.05), n=5.
In this study, three different parameters (myofibrillar solubility, myofibril size distribution, myofibrillar UV absorption spectrum) were used to track the changes of protein over shrimp frozen storage. All the data indicated that the protein had been changed during shrimp frozen storage which resulted from protein freeze denaturation, protein oxidation, protein degradation and other biochemical actions. It was shown that the TVB-N levels increased over frozen storage. The texture and microstructure went worse for shrimp subjected to freezing process. These variations could be results of protein changes.
This work was supported by funding from Dalian Science and Technology Innovation Fund (2018J11CY028) and Institute of Science and Technology Innovation, DGUT (No.KCYCXPT2017007;GB200902-51).
Ashie, I.N.A. and Simpson, B.K. (1996). Application of high hydrostatic pressure to control enzyme related fresh seafood texture deterioration. Food Res. Int., 29, 569-575. 00012-9
View ArticleAubourg, S., Sotelo, C. and Gallardo, J. (1997). Quality assessment of sardines during storage by measurement of fluorescent compounds. J. Food Sci., 62, 295-299.
View ArticleBradford, M.M. (1976). A rapid and sensitive for the quantification of microgram quantities of protein utilizing the principle of protein-dye binding. Anal. Biochem., 72, 248-254. 90527-3
View ArticleColmenero, F.J. and Borderias, A.J. (1983). A study of the effects of frozen storage on certain functional properties of meat and fish protein. Int. J. Food Sci. Technol., 18, 731-737.
View ArticleChantarasataporn, P., Yoksan, R., Visessanguan, W. and Chirachanchai, S. (2013). Water-based nano-sized chitin and chitosan as seafood additive through a case study of Pacific white shrimp (Litopenaeus vannamei). Food Hydrocolloids, 32, 341-348.
View ArticleDuun, A.S. and Rustad, T. (2007). Quality changes during superchilled storage of cod (Gadus morhua) fillets. Food Chem., 105, 1067-1075.
View ArticleFaruk, M.A.R., Kamal, M., Hossain, M.A., Hossai, M.R.A. and Hossain, M.I. (1997). Studies on rigor-mortis and changes in Muscle pH on the drip loss under different storage for ruho fish. Bang ladesh J. Agr. Sci, 24(2), 43-49.
Ghaly, A.E., Dave, D., Budge, S. and Brooks, M.S. (2010). Fish spoilage mechanisms and preservation techniques: review. Am. J. Appl. Sci., 7, 859-877.
View ArticleGalleguillos, M. (1996). Certification control quality fishmeal. In: "Proceeding of the nutricion acuicola 2nd international symposium," ed. by R.E. Mendoza-Alfaro, L.E. CruzSuarez, D. Ricque. FCB/UANL, Monterrey, USA, pp. 367-372.
Hao, C.G. and Sterling, C. (1970). Parameters of texture change in processed fish: myosin denaturation. J. Texture Stud., 1(2), 214-22. PMid:28371971
View Article PubMed/NCBIHassan, F. and Ali, M. (2011). Quality Evaluation of some fresh and imported frozen seafood. Adv. J. Food Sci. Technol., 3, 83-88.
Hultmann, L. and Rustad, T. (2004). Iced storage of atlantic salmon (Salmo salar) effects on endogenous enzymes and their impact on muscle proteins and texture. Food Chem., 87, 31-41.
View ArticleImran, A., Chawalit, J. and Somrote, K. (2013). Characterization of quality degradation during chilled shrimp (Litopenaeus vannamei) supply chain. Int. Food Res. J., 20(4), 1833-1842.
Jackson, T.C., Marshall, D.L., Acuff, G.R. and Dickson, J.S. (2001). Fundamentals and Frontiers. In "Food Microbiology" ed. by Doyle M.P. Doyle, Beuchat L.R. Beuchat and T.J. Montyille. ASM Press, Washington D.C., USA, pp. 91-109.
Jiang, S. and Wu, H.O. (2004). TPA and effect of experimental conditions on TPA test of apple slices. Food Sci., 25, 68-71. (In Chinese).
Lu, F., Zhang, J.Y., Liu, S.L., Wang, Y. and Ding, Y.T. (2011). Chemical, microbiological and sensory changes of dried Acetes chinensis during accelerated storage. Food Chem., 127, 159-168.
View ArticleLee, Y.C. and Um, Y.S. (1995). Quality determination of shrimp (penaeus japonicas) during iced and frozen storage. Korean J. Food Sci. Technol., 27, 520-524.
Malcolm, C. B. (2002). Texture, viscosity and food, Volume Ⅱ. In "Food texture and viscosity". Elsevier Inc., Amsterdam, Holland, pp. 1-32.
View ArticleManheem, K., Benjakul, S., Kijroongrojana, K. Visessanguan, W. (2012). The effect of heating conditions on polyphenol oxidase, proteases and melanosis in pre-cooked Pacific white shrimp during refrigerated storage. Food Chem., 131, 1370-1375.
View ArticleNeumeyer, K., Ross, T., Thomson, G. and McMeekin, T.A. (1997). Validation of a model describing the effect of temperature and water activity on the growth of psychrotrophic pseudomonads. Int. J. Food Microbiol., 38, 55-63. 00090-1
View ArticlePan, B. and Yeh, W.T. (1993). Biochemical and morphological changes in grass shrimp (Penaeus Monodon) muscle following freezing by air blast and liquid nitrogen methods. J. Food Biochem., 17, 147-160.
View ArticlePan, J.H. (2011). The relationship of frozen storage, porcine myofibrillar protein oxidation and quality of pork products. M. Sc. Thesis. Jiangnan University, China.
Park, D. and Xiong, Y.L. (2007). Oxidative modification of amino acids in porcine myofibrillar protein isolates exposed to three oxidizing systems. Food Chem., 103, 607-616.
View ArticleRicque, D., Cruz-Suarez, L.E., Abdo-de, L., Parra, M.I. and Pike, I. (1998). Raw material freshness: A quality criterion for fish meal fed to shrimp. Aquaculture, 165, 95-109. 00229-4
View ArticleSikorski, Z.E. and Kołakowska, A. (1995). Changes in proteins in frozen stored fish. Seafood Proteins, 99-112.
View ArticleSriket, P., Benjakul, S., Visessanguan, W. and Kijroongrojana, K. (2007). Comparative studies on the effect of the freeze-thawing process on the physico-chemicalproperties and microstructures of black tiger shrimp (Penaeusmonodon) and white shrimp (Penaeusvannamei) muscle. Food Chem., 104(1), 113-121.
View ArticleSrinivasan, S. and Xiong, Y.L., Blanchard, S.P., James, H.T. (1997). Physicochemical changes in prawns (Machrobrachium rosenbergii) subjected to multiple freeze-thaw cycles. J. Food Sci., 62, 123-127.
View ArticleStorey, R.M., Davis, K., Owen, D. and Moore, L. (1984). Rapid approximate estimation of volatile amines in fish. Int. J. Food Sci. Technol., 19, 1-10.
View ArticleSultanbawa, Y. And Li-Chan, E.C.Y. (1998). Cryoprotective effects of sugar and polyolblends in ling cod surimi during frozen storage. Food. Res. Int., 31(2), 87-98. 00063-5
View ArticleSultanbawa, Y. and Li-Chan, E.C.Y. (2001). Structural changes in natural actomyosin and surimi from ling cod (Ophiodon elongatus) during frozen storage in theabsence or presence of cryoprotectants. J. Agr. Food. Chem, 49(10), 4716-4725. PMid:11600013
View Article PubMed/NCBIWang, H., Luo, Y.K. and Shen, H.X. (2013). Effect of frozen storage on thermal stability of sarcoplasmic protein and myofibrillar protein from common carp (Cyprinus carpio) muscle. Int. J. Food Sci. Technol., 48, 1962-1969.
View ArticleZhou, G.H., Xu, X.L. and Liu, Y. (2010). Preservation technologies for fresh meat - a review. Meat Sci., 86, 119-128. PMid:20605688
View Article PubMed/NCBI