Prof. Dr. Baoshan Wang
Tel.: 0086 531 86180197; Fax: 0086 531 86180197
Email: bswang@sdnu.edu.cn
© 2019 Sift Desk Journals. All Rights Reserved
VOLUME: 5 ISSUE: 3
Page No: 125-135
Prof. Dr. Baoshan Wang
Tel.: 0086 531 86180197; Fax: 0086 531 86180197
Email: bswang@sdnu.edu.cn
Xiu Jing1, Ping Mi1, Xianzhi Xie2, Baoshan Wang1*
1 Shandong Provincial Key Laboratory of Plant Stress, College of Life Science, Shandong Normal University, Ji’nan, Shandong, China, 250014
2 Rice Research Institute of Shandong Academy of Agricultural Sciences, Ji’nan, Shandong, China, 250100
Xiu Jing: 2370862474@qq.com; Ping Mi: miping0315@foxmail.com; Xianzhi Xie: xzhxie2010@163.com
V%c3%adctor Quesada(vquesada@umh.es)
Dr. Pramod Kumar(pramod@nipgr.ac.in)
Hua Zhong(zhonghua0103@whu.edu.cn)
Charu Lata(charulata@nbri.res.in)
Xiu Jing, Ping Mi, Xianzhi Xie, Baoshan Wang, Large-scale integrated evaluation of salt tolerance in japonica rice at the germination stage (2020)Journal of Food Science & Technology 5(3) pp:125-135
Background: Salt stress, one of the most important abiotic stresses, severely reduces crop yields. Identifying salt-tolerant rice germplasm resources at the germination stage, developing salt tolerance indicators, and cultivating salt-tolerant rice cultivars are crucial for improving rice production in saline soil.
Results: We measured the germination parameters of 140 japonica rice cultivars on the 7 day after sowing (DAS) in 0 and 150 mmol L−1 NaCl. To accurately assess salt tolerance and identify reliable indicators of salt tolerance, we measured the germination rate (GR), shoot length (SL), root length (RL), root fresh weight (RFW), shoot fresh weight (SFW), total fresh weight (TFW) and salt tolerance (STI) index after 7 days of salt-stress treatment. The 140 rice cultivars were divided into four categories based on the mean MFVs: highly salt tolerant (HST: 19 cultivars), salt tolerant (ST: 74 cultivars), weakly salt tolerant (WST: 43 cultivars), and salt sensitive (SS: 4 cultivars). Based on the physiological indicators, we established a mathematical model to accurately evaluate salt tolerance in japonica rice cultivars. STI of TFW under 150 mmol L−1 NaCl treatment showed the highest correlation with salt tolerance during the germination stage.
Conclusions: Japonica rice is sensitive to salt stress during the germination stage, and there are significant differences among different japonica rice cultivars. Based on the cluster analysis of physiological indexes during the germination stage, 140 japonica rice cultivars were divided into 4 groups: 19 HST, 74 ST, 43 WST, and 4 SS. What’s more, we proposed a formula to evaluate salt tolerance in japonica rice cultivars. STI of TFW is a reliable, accurate indicator for the rapid identification of salt tolerance in japonica rice. These findings should greatly facilitate the evaluation of japonica rice cultivars during seed germination and the breeding of salt-tolerant rice cultivars.
Keywords: Germination, japonica rice, mathematical model, salt-tolerance evaluation, salt-tolerance traits
Soil salinization is an important ecological problem that seriously affects crop growth and reduces agricultural production worldwide. It is estimated that salinization affects 800 million hectares of land around the world to varying degrees. (Munns 2005). A huge area of saline-alkali soil is mainly distributed in the northern part of China, with a total area of about 100 million hm2(Yuan et al. 2016). Recently, salinization is increasing rapidly due to the overuse of chemical fertilizers, poor irrigation practices, and industrial pollution (Yuan et al. 2016), while the availability of farmland has decreased due to urbanization and industrialization (Tan et al. 2005). The worldwide population has been increasing rapidly and is projected to reach 9 billion by 2050 (Fouilleux et al. 2017). Therefore, the mismatch between population size and the decreasing availability of cultivated land will become increasingly acute.
It is crucial to decipher the salt tolerance mechanisms of crops for breeding salt-tolerant crops which can be planted in saline-alkali lands (Hanin et al. 2016a). Salinity has three major negative effects on crops: water stress, ion toxicity, and secondary damage such as disturbing nutrient balance (Munns and Tester 2008). As the salt concentration in soil increases, the osmotic potential decreases, making it difficult for seeds and plants to absorb water from the soil, thereby impairing seed germination and growth. With increasing salt stress, harmful exogenous Na+ accumulates in the cytosol, leading to a series of disturbances such as enzyme deactivation, protein denaturation, and a decline in photosynthesis (Zhang et al. 2018). Therefore, salt stress inhibits crop growth and development, ultimately reducing crop production (Anugoolprasert et al. 2012).
Sensitivity to salt stress varies throughout the life cycle of a plant, with germination being one of the most sensitive stages. High germination ability is required to generate high yields in saline soils. However, salt stress significantly reduces the rate and percentage of germination, as it decreases the ability of plants to take up water, resulting in reduced growth rates and crop yield (Ding et al. 2018). For example, with increasing NaCl concentration, the germination rate, seedling length, and seed vigor of various maize (Zea mays) varieties decrease significantly (Khodarahmpour and Motamedi 2011). Salt stress also inhibits the growth and development of sunflower (Helianthus annuus) plants (Mutlu and Bozcuk 2007).
As a food crop, rice is very important in food safety in the world (Chattopadhyay et al. 2018). Due to its wide planting range, rice is often affected by various abiotic stresses, resulting in significant yield reductions (Chen et al. 2017). High salinity is a major factor restricting rice growth and reducing yield. Various methods have been used to evaluate salt tolerance in rice, including image-based phenotyping (Hairmansis et al. 2014), pot-culture (Kakar et al. 2019), genome-wide association (Li et al. 2019), clustering (Pongprayoon et al. 2019) and the membership function method (Liu et al. 2017). Most of these studies have focused on a simple analysis of several salt tolerance indexes in indica rice. By contrast, few studies have evaluated salt tolerance in japonica rice via multivariate statistical methods. There is currently no reliable indicator or formula for the rapid identification of salt tolerance in japonica rice.
In the current study, we used a panel of 140 widely representative japonica rice cultivars to evaluate salt tolerance. After measuring various germination and growth parameters, we used the membership function method, cluster analysis, and stepwise regression analysis to evaluate salt tolerance in japonica rice. We identified 19 HST, 74 ST, 43 WST and 4 SS japonica rice cultivars. Finally, we established a mathematical model for the rapid and accurate identification of salt tolerance in japonica rice cultivars. Our findings should greatly facilitate the breeding of salt-tolerant rice cultivars that can be planted in saline soils.
2.1 Plant materials
In this study, 140 japonica rice cultivars with different genetic backgrounds were used for the germination experiments. The seeds were placed in a refrigerator after harvest in 2018 and stored at <4°C. Professor Xianzhi Xie of the Rice Research Institute of Shandong Academy of Agricultural Sciences kindly provided the rice seeds.
2.2 Determining the optimal NaCl concentration
To determine a suitable NaCl concentration and culture time for evaluating salt tolerance in japonica rice, a germination test was carried out in a plant growth chamber using the salt-tolerant cultivar pokkali and the salt-sensitive cultivar Nipponbare. Twenty uniform, healthy seeds were soaked in 250 mL of distilled water for 24h and germinated on filter paper in 9-cm Petri dishes for 7 days in 1/4 Hoagland solution (pH 6.2) supplemented with 0, 100, 125, 150, 175, or 200 mmol L−1 NaCl. For the control group, seeds were treated with 1/4 Hoagland solution (0 mmol L−1 NaCl).
The seed germination were performed as described by Wu et al.(Wu et al. 2019). After 7 days of treatment, seed germination was recorded once daily, and the optimal NaCl concentration and days in culture were determined. The germination standard is that the radicle length of seed reaches 2 mm long. Three replicates were performed.
2.3 Determining physiological parameters
Seeds of the 140 japonica rice cultivar were grown in the presence of 0 and the optimal NaCl concentration (150 mmol L−1 NaCl) as described in Section 1.2. Seed germination was observed every day beginning at 1DAS. After 7 days of the treatment, the growth indexes of the seedlings were measured.
To evaluate the salt tolerance of each japonica rice cultivar at the germination stage, GR, SFW, RFW, TFW, SL and RL were determined. GR is calculated according to the method (Zheng et al. 2018).
To compare the growth parameters at 7 DAS, seedlings with health, uniform growth were selected for measurement of SFW, RFW, TFW, SL and RL.
Salt tolerance index (STI) is the ratio between the NaCl-treated value and control.
2.4 Data analysis and evaluation of salt tolerance
Salt tolerance in different japonica rice was evaluated based on fuzzy comprehensive evaluation by determining the membership function value (MFV) for salt tolerance for each rice cultivar (Basra et al. 2005). We evaluated the salt tolerance of each japonica rice cultivar based on the average MFVs of all physiological parameters.
For each cultivar, the average MFV represents the average RL, SL, RFW, SFW, and TFW. Therefore, we evaluated the salt tolerance of each rice cultivar based on the mean MFV. Salt tolerance of a specific japonica rice cultivar was positively correlated with mean MFV.
2.5 Hierarchical cluster analysis of physiological indicators of salt tolerance in japonica rice at the seedling stage
In order to quickly and accurately identify salt tolerance of the 140 japonica rice cultivars, hierarchical cluster analysis was performed. The cultivars were divided into four categories: HST, ST, WST and SS. The relationship between the mean MFV (dependent variable Y) and STI (independent variable Xi) of each cultivar was analyzed by multiple regression analysis with SPSS software. In addition, we established a mathematical model for the rapid and accurate identification of the salt tolerance of japonica rice: Y = β1X1+β2X2+ β3X3+ β4X4+ β5X5+ µ
In the above formula, Y is the mean MFV of a specific japonica rice cultivar, X1 is the STI of RL, X2 is the STI of SL, X3 is the STI of RFW, X4 is the STI of SFW, X5 is the STI of TFW, β (B) is the unstandardized coefficient, and µ is the constant (random error term).
2.6 Statistical analysis
The data are presented as means ± standard deviation (SD). Data were processed using Microsoft Office Excel 2013. The saline tolerance characteristics of the cultivars, including significant differences, cluster analysis, and correlation analysis, were analyzed using SPSS 22.0 software. Salt tolerance was comprehensively evaluated using the membership function method.
3.1 Optimal germination time and NaCl concentration
We statistically analyzed the GR of salt-tolerant pokkali and salt-sensitive Nipponbare under different NaCl concentrations. The seeds germinated from 2 to 6 DAS. Therefore, the experimental observation period was set at 7 days. The relative GRs of pokkali and Nipponbare were inhibited to different degrees with increasing NaCl concentration (Fig. 1). There was no significant difference in GR between pokkali and Nipponbare when NaCl was <100 mmol L−1. However, at a NaCl concentration of 100~200 mmol L−1, GR of Nipponbare seeds decreased much more rapidly than that of pokkali. The GRs of both pokkali and Nipponbare were markedly reduced at NaCl concentrations >180 mmol L−1; in particular, under these salt concentrations, the GR of salt-sensitive Nipponbare was less than 50%. Due to the large amount of variation in salt tolerance among the 140 japonica rice cultivars, 150 mmol L−1 NaCl was chosen as the optimal NaCl concentration for subsequent experiments.
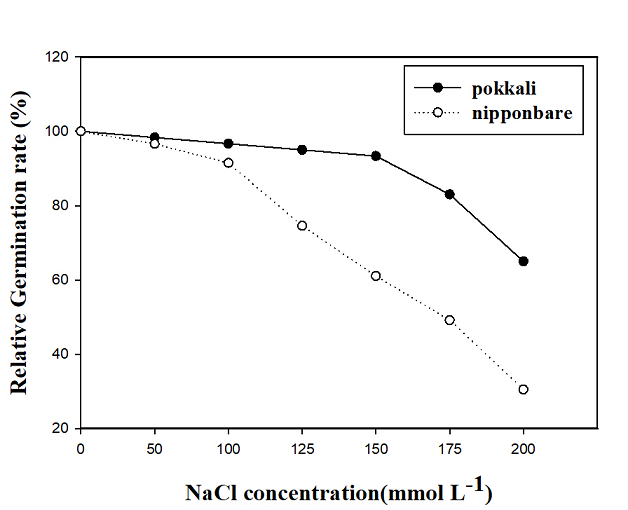
Figure 1. Relative germination rates of salt-tolerant (pokkali) and salt-sensitive (Nipponbare) rice under different NaCl concentrations. Data are the means of three replicates at each NaCl concentration. The GR of pokkali and Nip+ponbare was 100% and 98.33%, respectively, in the presence of 0 mmol L−1 NaCl.
3.2 Hierarchical cluster analysis
We calculated the MFV of each physiological parameter and the mean MFV of the 140 japonica rice cultivars, as shown in Table S1. The 140 cultivars were classified into four categories based on their mean MFVs. Among them, 4 cultivars were SS (mean MFV=0), 43 were WST (0.031<mean MFV<0.175), 74 were ST (0.175<mean MFV<0.326), and 19 were HST (0.354<mean MFV<0.866) (Figure 2).
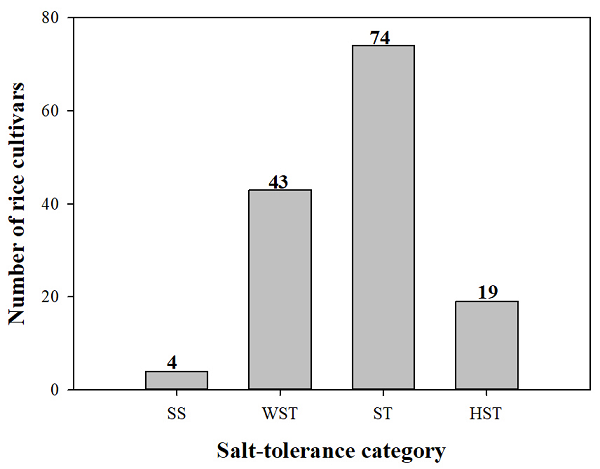
Figure 2. Proportion of the 140 japonica rice cultivars with different degrees of salt tolerance based on their mean MFVs under 150 mmol L−1 NaCl. HST, highly salt tolerant; ST, salt tolerant; WST, weakly salt tolerant; SS, salt sensitive. The number above each column represents the number of cultivars.
To verify the effectiveness of using mean MFV to evaluate salt tolerance in japonica rice, we evaluated the salt tolerance of a specific japonica rice cultivar using hierarchical cluster analysis based on Ward’s method (Figure 3). Two categories were divided at a Euclidean distance of 25. The first mixed category (I) was composed of ST and WST cultivars, and the second mixed category (II) was composed of HST cultivars. When the Euclidean distance was 6, the mixed category was further subdivided into three subcategories: WST, ST, and HST (Fig. 3). The number and names of the 140 japonica rice cultivars with different levels of salt tolerance differentiated by hierarchical cluster analysis under 150 mmol L−1 NaCl treatment are shown in Supplementary Table S2.
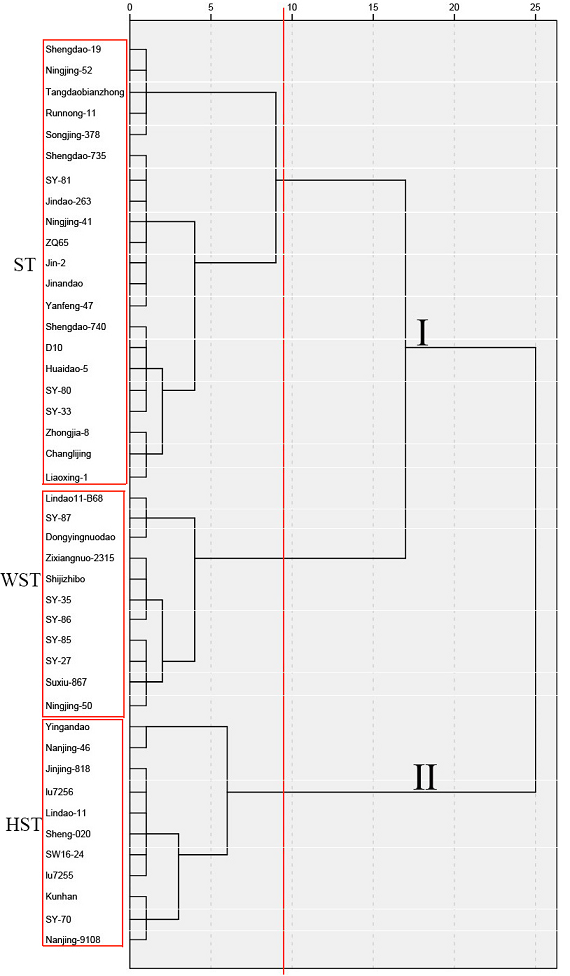
Figure 3. Hierarchical cluster analysis based on Ward’s method to evaluate the salt tolerance of 140 japonica rice cultivars. The names in the red boxes refer to cultivar names of the category. HST, highly salt tolerant; ST, salt tolerant; WST, weakly salt tolerant; and SS, salt sensitive.
3.3 Correlation analysis
The physiological characteristics of the rice cultivars during the germination stage differed under salt stress compared to normal culture conditions. We therefore used correlation analysis between different physiological parameters to reveal whether and how these indicators are correlated to salt tolerance (Ding et al. 2018).
We recorded the RL, SL, RFW, SFW, and TFW of each japonica rice cultivar at 7 days of 0 and 150 mmol L−1 NaCl treatment (Table S3) and calculated the STI of each physiological parameter (Table S4). We conducted a correlation analysis to determine whether different physiological parameters were correlated under salt stress (Table 1). There was a significant positive correlation between any two of the STIs of RL, SL, RFW, SFW, and TFW. Furthermore, the highest correlation coefficient is between TFW and RFW, which is 0.92. The lowest correlation coefficient is between RFW and SL, which is 0.38.
Table 1. Correlation analysis between salt tolerance indices of root length (STI of RL), shoot length (STI of SL), root fresh weight (STI of RFW), shoot fresh weight (STI of SFW), and total fresh weight (STI of TFW) of 140 Japonica rice cultivars under the salt stress of 150 mmol L−1 NaCl.
|
|
|
STI of RL |
STI of SL |
STI of RFW |
STI of SFW |
STI of TFW |
|
STI of RL |
Pearson correlation |
1 |
0.58** |
0.45** |
0.60** |
0.58** |
|
STI of SL |
Pearson correlation |
0.58** |
1 |
0.38** |
0.48** |
0.47** |
|
STI of RFW |
Pearson correlation |
0.45** |
0.38** |
1 |
0.66** |
0.92** |
|
STI of SFW |
Pearson correlation |
0.60** |
0.48** |
0.66** |
1 |
0.88** |
|
STI of TFW |
Pearson correlation |
0.58** |
0.47** |
0.92** |
0.88** |
1 |
**Correlation is significant at the 0.01 level (two tailed)
3.4 Establishment of a regression model and a reliable indicator of salt tolerance
We established a mathematic model to rapidly and accurately evaluate the salt tolerance of 140 japonica rice cultivars during germination stage. The mean MFV was taken as the dependent variable and the STI value of each physiological parameter as the independent variable for regression analysis. The optimal regression equation is: Y = −0.001+0.201∗STI of RL+0.516∗STI of SL+0.171∗STI of RFW+0.201∗STI of SFW+0.196∗STI of TFW (P < 0.01) (Table 2), here, Y represents salt tolerance of a specific rice cultivar and 0.201, 0.516, 0.171, 0.201, and 0.196 are the unstandardized coefficients of the STIs of RL, SL, RFW, SFW, and TFW, respectively. The random error term was −0.01.
Table 2. Multiple regression analysis for salt tolerance indices of root length (STI of RL), shoot length (STI of SL), root fresh weight (STI of RFW), shoot fresh weight (STI of SFW), and total fresh weight (STI of TFW) in the presence of 150 mmol L−1 NaCl.
|
Model |
Unstandardized coefficients |
Standardized coefficients |
t |
Significance |
|
|
μ or B |
SE |
β |
|||
|
Constant |
-0.001 |
0.000 |
|
-23.199 |
0.000 |
|
STI of RL |
0.201 |
0.000 |
0.237 |
1102.619 |
0.000 |
|
STI of SL |
0.516 |
0.000 |
0.286 |
1474.317 |
0.000 |
|
STI of RFW |
0.171 |
0.000 |
0.241 |
343.437 |
0.000 |
|
STI of SFW |
0.201 |
0.000 |
0.239 |
407.125 |
0.000 |
|
STI of TFW |
0.196 |
0.001 |
0.218 |
193.166 |
0.000 |
Dependent variable: mean MFV, P<0.01. Where B is unstandardized coefficients(β). Constant(μ) means the random error term.
We randomly selected 14 cultivars and calculated their Y values to determine whether the formula could predict their levels of salt tolerance (Table 3). Surprisingly, the equation can accurately predict the salt tolerance of any japonica rice cultivar. For example, the Y of Longjing-21 is −0.001+0.201*0.37+0.516*0.18+0.171*0.88+0.201*0.51+0.196*0.59; therefore Y = 0.53, and its mean MFV is 0.55, which is HST; the Y of Ningjing-47 is 0.30, and its mean MFV is 0.32, which is ST. The Y of Liaoyan-207 is 0.07, and its mean MFV is 0.08, which is WST. In all cases, the mean MFVs were similar to Y, indicating that our model is reliable and accurate.
Table 3. Salt tolerance verification of multiple regression analysis with their MFVs.
|
Japonica rice |
STI of RL |
STI of SL |
STI of RW |
STI of SW |
STI of TW |
Mean MFV |
Y |
|
Wuyousidaohuaxiang |
0.00 |
0.00 |
0.00 |
0.00 |
0.00 |
0.00 |
0.00 |
|
Kenyu-38 |
0.01 |
0.05 |
0.04 |
0.02 |
0.03 |
0.05 |
0.04 |
|
Liaoyan-207 |
0.02 |
0.08 |
0.07 |
0.03 |
0.05 |
0.08 |
0.07 |
|
SY-82 |
0.13 |
0.11 |
0.09 |
0.05 |
0.06 |
0.13 |
0.12 |
|
F1-1-1 ③ |
0.17 |
0.12 |
0.04 |
0.04 |
0.04 |
0.13 |
0.12 |
|
SY-81 |
0.20 |
0.17 |
0.09 |
0.09 |
0.09 |
0.19 |
0.18 |
|
ZQ-65 |
0.27 |
0.13 |
0.10 |
0.12 |
0.11 |
0.20 |
0.18 |
|
Shengdao-735 |
0.23 |
0.11 |
0.21 |
0.08 |
0.10 |
0.19 |
0.17 |
|
Huaidao-5 |
0.31 |
0.17 |
0.13 |
0.11 |
0.12 |
0.20 |
0.22 |
|
Shengdao-740 |
0.28 |
0.17 |
0.05 |
0.16 |
0.10 |
0.20 |
0.20 |
|
SY-77 |
0.38 |
0.22 |
0.14 |
0.19 |
0.16 |
0.28 |
0.28 |
|
Ningjing-47 |
0.28 |
0.27 |
0.23 |
0.16 |
0.19 |
0.31 |
0.30 |
|
Naiyandanzhu-76 |
0.56 |
0.23 |
0.21 |
0.43 |
0.31 |
0.41 |
0.41 |
|
Longjing-21 |
0.37 |
0.18 |
0.88 |
0.51 |
0.59 |
0.53 |
0.53 |
Where numbers in the first column refer to No. of rice cultivar; salt tolerance index of root length (STI of RL), shoot length (STI of SL), root fresh weight (STI of RFW), shoot fresh weight (STI of SFW), and total fresh weight (STI of TFW), Y = -0.001+0.201∗STI of RL+0.516∗STI of SL+0.171∗STI of RFW+0.201∗STI of SFW+0.196∗STI of TFW.
To determine which physiological parameter best reflects the salt tolerance of a specific rice cultivar during the germination stage, we analyzed the consistency of the STI of a single parameter vs. the mean MFV (Figure 4). According to our analysis, the highest R2 (0.84) is between STI of TFW and mean MFV, the second highest R2 (0.74) is between STI of SFW and mean MFV, and the lowest R2 (0.61) is between STI of RFW and mean MFV. These results are similar to those shown in Table 1, where the highest standardized β coefficient is also between STI of TFW and mean MFV. Therefore, STI of total fresh weight per plant under the 150 mmol L−1 NaCl treatment can be used as a reliable indicator for the mass screening of salt-tolerant japonica rice cultivars during the germination stage.
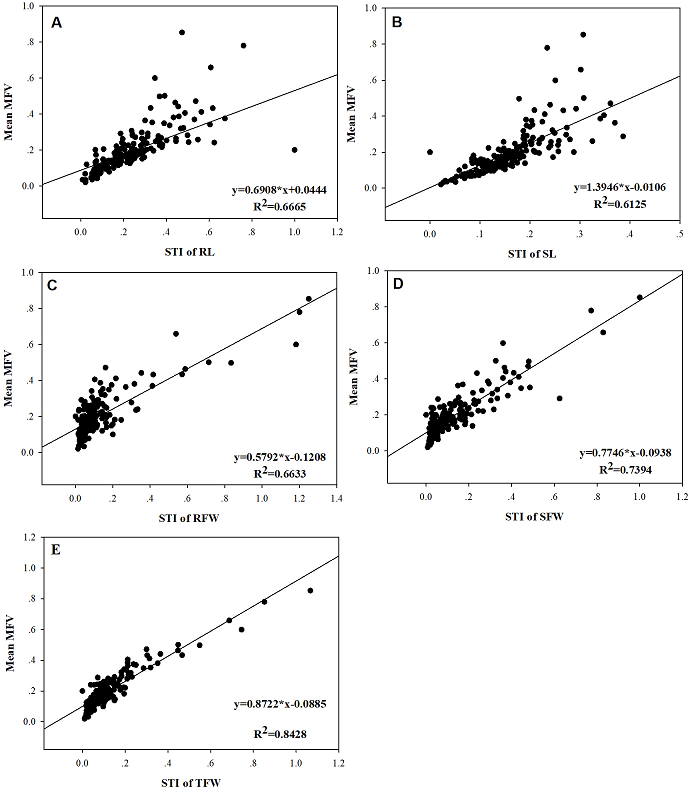
Figure 4. The linear fit between the STI of each physiological parameter and the mean MFV of a specific rice cultivar (140 japonica rice cultivars with different levels salt tolerance). (A): between mean MFV and STI of RL; (B): between mean MFV and STI of SL; (C): between mean MFV and STI of RFW; (D): between mean MFV and STI of SFW; (E): between mean MFV and STI of TFW.
To verify that the total fresh weight accurately reflects the salt tolerance of a specific cultivar, we randomly selected three cultivars in each salt-tolerance category and measured the total fresh weight at 7 DAS under 0 and 150 mmol L−1 NaCl (Fig. 5). Under control conditions (without NaCl), no significant difference in growth among different japonica rice cultivar was found. However, as the salt tolerance of the rice cultivars decreased, the total fresh weights significantly decreased in response to salt stress. As the salt tolerance of the japonica rice cultivars decreased (HST>ST>WST>SS), salt stress severely inhibited the growth of each cultivar and reduced the total fresh weight. Under the condition of 150 mmol L-1 NaCl, SS cultivars hardly germinated (A, a). The average total fresh weight of an individual plant was 1 mg in the WST group (WST, B, b), 3 mg in the ST group (ST, C, c), and 6 mg in the HST group (D, d).
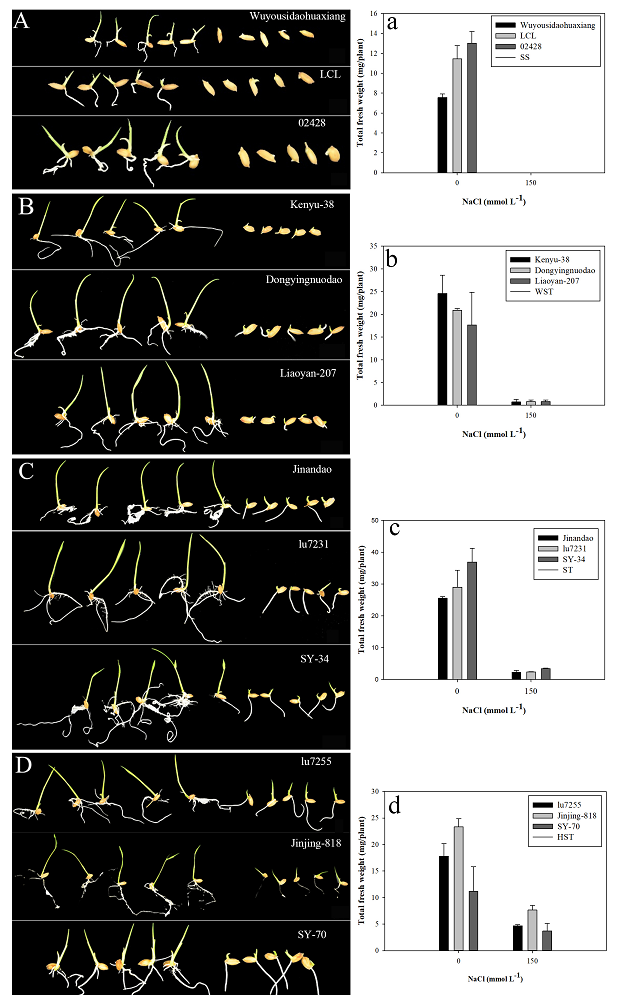
Figure 5. Phenotypes of different rice cultivars (SS, A; WST, B; ST, C and HST, D) germinated at 7 DAS under 0 (left) and 150 mmol L-1NaCl (right) treatment and the total fresh weight per plant for SS, a; WST, b; ST, c and HST, d, respectively. Data are means (n = 3) ± SD. Different letters indicate significant differences at P < 0.05.
Efficient and reliable methods and indicators are crucial to evaluate the salt tolerance of the rice germplasm for planting salt-tolerant cultivars in saline soil and breeding salt-tolerant cultivars. In the current study, 140 japonica rice cultivars were used to evaluate their salt tolerance with different methods and indicators. Based on their mean MFVs, four categories of salt tolerance were divided, i.e. 19 HST, 74 ST, 43 WST, and 4 SS cultivars. We also established a mathematical model that can rapidly and accurately predict the salt tolerance of any japonica rice cultivar. Furthermore, STI of TFW under 150 mM NaCl is an efficient, reliable physiological indicator for the convenient and accurate identification of salt tolerance in japonica rice during the germination stage. These findings will be highly valuable for evaluating and breeding salt-tolerant rice, and lay the foundation for uncovering the mechanisms underlying salt tolerance in rice.
Much work has been done to evaluate salt tolerance with different salt-tolerance indicators in crops such as wheat (Triticum aestivum L.) (Zhu et al. 2016; Sardouie-Nasab et al. 2014; Feng et al. 2018; El-Hendawy et al. 2005), barley (Hordeum vulgare) (Kuuliala et al. 2018; Qiu et al. 2011; Ben Chikha et al. 2016; Allel et al. 2019), cotton (Gossypium hirsutum L.)(Zhang et al. 2011), and rapeseed (Brassica napus L.) (Wu et al. 2019; Janagard et al. 2008; Bybordi and Tabatabaei 2009). Salinity significantly inhibits crop growth and development, leading to yield losses (Hakim et al. 2010).
Various indicators have been used to evaluate salt tolerance in rice. In 1979, the International Rice Research Institute suggested that the “morphological damage assessment method” can be used to measure salt tolerance in rice. However, the classification of plant injury symptoms using this method is mainly based on qualitative human observation, as it is difficult to quantitatively and accurately evaluate salt tolerance in rice. In 1982, the “single stem (plant) classification method” was established by the National Cooperative Program of Rice Salt Tolerance Identification. However, using this method, it is difficult to accurately identify salt tolerance in rice due to poor comparability and the availability of different cultivars with different growth periods, leaf numbers, or developmental processes.
Direct seeding has become a popular rice planting method. Therefore, it is important to find a method to quickly and accurately assess the salt tolerance of japonica rice during seed germination. Relative salt damage rate was recently used to evaluate rice salt tolerance during the germination stage and the physiological parameters such as GR, RL decreased to varying degrees after salt stress(Zheng et al. 2018). Similar results were reported in soybean (Glycine max)(Chen et al. 2018; Cao et al. 2019; Tuyen et al. 2010; Jin et al. 2019), Arabidopsis (Orsini et al. 2010; Zhu 2000), sorghum (Ding et al. 2018), and other crops. However, which growth indicator is reliable and best reflects salt tolerance and how salt tolerance in a rice cultivar should be evaluated are still unresolved due to the small number of cultivars and inconsistency of physiological indicators and analysis methods. Convenient, effective, reliable salt tolerance indicators are the basis for accurately evaluating salt tolerance and for breeding salt-tolerant crops (Vitart et al. 2001).
Because salt tolerance in rice is controlled by multiple genes, and the performance of salt tolerance-related traits varies among genotype, it is difficult to evaluate salt tolerance comprehensively and accurately based on a single identification index. Various statistical analysis methods can be used to quantify salt tolerance-related indicators, establish a quantitative relationship with the degree of salt tolerance, and effectively identify the salt tolerance of crops. Multivariate statistical analysis methods include correlation analysis, factor analysis, principal component analysis, cluster analysis, correspondence analysis, and multivariate analysis of variance (Kuuliala et al. 2018).
In the current study, MFVs and STIs of the physiological parameters such as RL, SL, RFW, SFW, TFW and their average MFVs of 140 japonica rice cultivars at the germination stage were calculated (Table S1, 3, 4). The mean MFV is a multi-index for the rapid and accurate identification of salt tolerance in plants: the larger the mean MFV, the more salt tolerant the plant. Therefore, we used the MFVs of 140 Japonica rice cultivars and hierarchical cluster analysis based on Ward’s method to evaluate the salt tolerance of 140 japonica rice cultivars during the germination stage (Table 2 and Table S2, Figure 3). Among these cultivars, 90 were salt tolerant (including HST and ST), 46 were WST, and 4 were salt sensitive (including HSS and SS) during the germination stage (Figure 2).
The use of mean MFVs can avoid information overlap caused by one-sided evaluation of rice salt tolerance and the different degrees of correlation among indicators. To assess salt tolerance of japonica rice cultivars conveniently and reliably, we established the equation for the rapid and accurate identification of salt tolerance (Table 2).Using this formula, the salt tolerance of any japonica rice cultivar can be estimated by the Y value: i.e. the y value is highly positive correlated with the salt tolerance of japonica rice cultivar. This is the first mathematical model designed to evaluate the salt tolerance of any japonica rice cultivar. Although the model is reliable and accurate for evaluating salt tolerance in japonica rice, it involves measuring many physiological parameters, a time-consuming and laborious process.
To more effectively measure salt tolerance in rice during seed germination, we analyzed the consistency between the STI of each single parameter and the mean MFV (Figure 4), as this relationship could be used to further identify salt tolerance in rice. According to our data, the STI of TFW (total fresh weight) under 150 mM NaCl treatment was the most consistent (R2=0.84) with salt tolerance in the 140 japonica rice cultivars. Therefore, STI of TFW can be considered as a reliable screening trait to effectively evaluate salt tolerance in japonica rice, which was further proved using twelve cultivars with different salt tolerance (Figure 5).
We identified 19 HST, 74 ST, 43 WST, and 4 SS japonica rice cultivars during the germination stage. Furthermore, an equation is established for the rapid and accurate identification of salt tolerance in japonica rice cultivar. STI of TFW is a reliable, accurate indicator of salt tolerance in japonica rice. These findings should greatly facilitate the salt tolerance identification and breeding in japonica rice.
Funding
This work was supported by the NSFC (National Natural Science Research Foundation of China, project No. 31570251; 31770288) and the Shandong Province Key Research and Development Plan (2017CXGC0313; 2016GNC113012).
Author’s contributions
BSW and XXZ designed the research. XJ and PM performed the experiments. All authors analyzed the data. XJ and BSW wrote the paper with contributions from the other authors. All authors have read and approved the manuscript.
Availability of data and materials
The datasets used and/or analyzed during the current study are included in this published article.
Competing interests
The authors declare that they have no competing interests.
Allel D, BenAmar A, Badri M, Abdelly C (2019) Evaluation of salinity tolerance indices in North African barley accessions at reproductive stage. Czech Journal of Genetics and Plant Breeding 55 (2):61-69. doi:10.17221/50/2017-cjgpb
View ArticleAnugoolprasert O, Kinoshita S, Naito H, Shimizu M, Ehara H (2012) Effect of low pH on the growth, physiological characteristics and nutrient absorption of sago palm in a hydroponic system. Plant Prod Sci 15 (2):125-131. doi:10.1626/pps.15.125
View ArticleBasra SMA, Farooq M, Tabassam R, Ahmad N (2005) Physiological and biochemical aspects of pre-sowing seed treatments in fine rice (Oryza sativa L.). Seed Sci Technol 33 (3):623-628. doi:10.15258/sst.2005.33.3.09
View ArticleBen Chikha M, Hessini K, Ourteni RN, Ghorbel A, Zoghlami N (2016) Identification of barley landrace genotypes with contrasting salinity tolerance at vegetative growth stage. Plant Biotechnology 33 (4):287-295. doi:10.5511/plantbiotechnology.16.0515b PMid:31274990
View Article PubMed/NCBIBybordi A, Tabatabaei J (2009) Effect of salinity stress on germination and seedling properties in canola cultivars (Brassica napus L.). Notulae Botanicae Horti Agrobotanici Cluj-Napoca 37 (2):71-76
Cao D, Yan YL, Xu DH (2019) Assessment of salt tolerance and analysis of the salt tolerance gene Ncl in Indonesian soybean germplasm. Plant Genetic Resources-Characterization and Utilization 17 (3):265-271. doi:10.1017/s1479262118000618
View ArticleChattopadhyay K, Nayak AK, Marndi BC, Poonam A, Chakraborty K, Sarkar RK (2018) Novel screening protocol for precise phenotyping of salt-tolerance at reproductive stage in rice. Physiol Mol Biol Plants 24 (6):1047-1058. doi:10.1007/s12298-018-0591-7 PMid:30425422
View Article PubMed/NCBIChen G, Liu C, Gao Z, Zhang Y, Jiang H, Zhu L, Ren D, Yu L, Xu G, Qian Q (2017) OsHAK1, a high-affinity potassium transporter, positively regulates responses to drought stress in rice. Front Plant Sci 8. doi:10.3389/fpls.2017.01885 PMid:29163608
View Article PubMed/NCBIChen H, Liu X, Zhang H, Yuan X, Gu H, Cui X, Chen X (2018) Advances in salinity tolerance of soybean: Genetic diversity, heredity, and gene identification contribute to improving salinity tolerance. Journal of Integrative Agriculture 17 (10):2215-2221. doi:10.1016/s2095-3119(17)61864-1 61864-1
View ArticleDing T, Yang Z, Wei X, Yuan F, Yin S, Wang B (2018) Evaluation of salt-tolerant germplasm and screening of the salt-tolerance traits of sweet sorghum in the germination stage. Funct Plant Biol 45 (10):1073-1081. doi:10.1071/fp18009 PMid:32291006
View Article PubMed/NCBIEl-Hendawy SE, Hu YC, Yakout GM, Awad AM, Hafiz SE, Schmidhalter U (2005) Evaluating salt tolerance of wheat genotypes using multiple parameters. Eur J Agron 22 (3):243-253. doi:10.1016/j.eja.2004.03.002
View ArticleFeng K, Cui L, Lv S, Bian J, Wang M, Song W, Nie X (2018) Comprehensive evaluating of wild and cultivated emmer wheat (Triticum turgidum L.) genotypes response to salt stress. Plant Growth Regulation 84 (2):261-273. doi:10.1007/s10725-017-0337-5
View ArticleFouilleux E, Bricas N, Alpha A (2017) 'Feeding 9 billion people': global food security debates and the productionist trap. J Eur Public Policy 24 (11):1658-1677. doi:10.1080/13501763.2017.1334084
View ArticleHairmansis A, Berger B, Tester M (2014) Image-based phenotyping for non-destructive screening of different salinity tolerance traits in rice. Rice 7 (1):1-10 PMid:26055997
View Article PubMed/NCBIHakim MA, Juraimi AS, Begum M, Hanafi MM, Ismail MR, Selamat A (2010) Effect of salt stress on germination and early seedling growth of rice (Oryza sativa L.). African Journal of Biotechnology 9 (13):1911-1918
View ArticleJanagard MS, Tobeh A, Esmailpour B (2008) Evaluation of salinity tolerance of three canola cultivars at germination and early seedling growth stage. Journal of Food Agriculture & Environment 6 (2):272-275
Jin T, Sun Y, Zhao R, Shan Z, Gai J, Li Y (2019) Overexpression of Peroxidase Gene GsPRX9 Confers Salt Tolerance in Soybean. International Journal of Molecular Sciences 20 (15). doi:10.3390/ijms20153745 PMid:31370221
View Article PubMed/NCBIKakar N, Jumaa SH, Redona ED, Warburton ML, Reddy KR (2019) Evaluating rice for salinity using pot-culture provides a systematic tolerance assessment at the seedling stage. Rice (N Y) 12 (1):57. doi:10.1186/s12284-019-0317-7 PMid:31363935
View Article PubMed/NCBIKhodarahmpour Z, Motamedi M (2011) Evaluation of drought and salinity stress effects on germination and early growth of two cultivars of maize (Zea mays L.). Afr J Biotechnol 10 (66):14868-14872. doi:10.5897/ajb11.1969
View ArticleKuuliala L, Abatih E, Ioannidis AG, Vanderroost M, De Meulenaer B, Ragaert P, Devlieghere F (2018) Multivariate statistical analysis for the identification of potential seafood spoilage indicators. Food Control 84:49-60. doi:10.1016/j.foodcont.2017.07.018
View ArticleLi N, Zheng H, Cui J, Wang J, Liu H, Sun J, Liu T, Zhao H, Lai Y, Zou D (2019) Genome-wide association study and candidate gene analysis of alkalinity tolerance in japonica rice germplasm at the seedling stage. Rice (N Y) 12 (1):24. doi:10.1186/s12284-019-0285-y PMid:30976929
View Article PubMed/NCBILiu N, Liu S, Gan Y, Zhang Q, Wang X, Liu S, Dai J (2017) Evaluation of mercury resistance and accumulation characteristics in wheat using a modified membership function. Ecol Indic 78:292-300. doi:10.1016/j.ecolind.2016.12.025
View ArticleMunns R (2005) Genes and salt tolerance: bringing them together. New Phytol 167 (3):645-663. doi:10.1111/j.1469-8137.2005.01487.x PMid:16101905
View Article PubMed/NCBIMunns R, Tester M (2008) Mechanisms of salinity tolerance. Annu Rev Plant Biol 59:651-681. doi:10.1146/annurev.arplant.59.032607.092911 PMid:18444910
View Article PubMed/NCBIMutlu F, Bozcuk S (2007) Salinity-induced changes of free and bound polyamine levels in sunflower (Helianthus annuus L.) roots differing in salt tolerance. Pak J Bot 39 (4):1097-1102
Orsini F, D'Urzo MP, Inan G, Serra S, Oh D-H, Mickelbart MV, Consiglio F, Li X, Jeong JC, Yun D-J, Bohnert HJ, Bressan RA, Maggio A (2010) A comparative study of salt tolerance parameters in 11 wild relatives of Arabidopsis thaliana. Journal of Experimental Botany 61 (13):3787-3798. doi:10.1093/jxb/erq188 PMid:20595237 PMCid:PMC2921208
View Article PubMed/NCBIPongprayoon W, Tisarum R, Theerawittaya C, Cha-um S (2019) Evaluation and clustering on salt-tolerant ability in rice genotypes (Oryza sativa L. subsp. indica) using multivariate physiological indices. Physiol Mol Biol Plants 25 (2):473-483. doi:10.1007/s12298-018-00636-2 PMid:30956429
View Article PubMed/NCBIQiu L, Wu D, Ali S, Cai S, Dai F, Jin X, Wu F, Zhang G (2011) Evaluation of salinity tolerance and analysis of allelic function of HvHKT1 and HvHKT2 in Tibetan wild barley. Theoretical and Applied Genetics 122 (4):695-703. doi:10.1007/s00122-010-1479-2 PMid:20981400
View Article PubMed/NCBISardouie-Nasab S, Mohammadi-Nejad G, Nakhoda B (2014) Field screening of salinity tolerance in iranian bread wheat lines. Crop Science 54 (4):1489-1496. doi:10.2135/cropsci2013.06.0359
View ArticleTan MH, Li XB, Xie H, Lu CH (2005) Urban land expansion and arable land loss in China - a case study of Beijing-Tianjin-Hebei region. Land Use Pol 22 (3):187-196. doi:10.1016/j.landusepol.2004.03.003
View ArticleTuyen DD, Lal SK, Xu DH (2010) Identification of a major QTL allele from wild soybean (Glycine soja Sieb. & Zucc.) for increasing alkaline salt tolerance in soybean. Theoretical and Applied Genetics 121 (2):229-236. doi:10.1007/s00122-010-1304-y PMid:20204319
View Article PubMed/NCBIVitart V, Baxter I, Doerner P, Harper JF (2001) Evidence for a role in growth and salt resistance of a plasma membrane H+-ATPase in the root endodermis. Plant Journal 27 (3):191-201. doi:10.1046/j.1365-313x.2001.01081.x PMid:11532165
View Article PubMed/NCBIWu H, Guo J, Wang C, Li K, Zhang X, Yang Z, Li M, Wang B (2019) An effective screening method and a reliable screening trait for salt tolerance of Brassica napus at the germination stage. Frontiers in Plant Science 10. doi:10.3389/fpls.2019.00530 PMid:31105727
View Article PubMed/NCBIYuan F, Leng B, Wang B (2016) Progress in studying salt secretion from the salt glands in recretohalophytes: How do plants secrete salt? Front Plant Sci 7. doi:10.3389/fpls.2016.00977
View ArticleZhang G, Lu H, Zhang L, Chen B, Zhou Z (2011) Salt tolerance evaluation of cotton (Gossypium hirsutum) at its germinating and seedling stages and selection of related indices. The journal of applied ecology 22 (8):2045-2053
Zhang Y, Fang J, Wu X, Dong L (2018) Na+/K+ balance and transport regulatory mechanisms in weedy and cultivated rice (Oryza sativa L.) under salt stress. BMC Plant Biol 18. doi:10.1186/s12870-018-1586-9 PMid:30594151
View Article PubMed/NCBIZheng C, Zhang Z, Xie X (2018) Evaluation on salt tolerance of different rice varieties during germination stage. Shandong Agricultural Sciences 50(10):38-42. doi:10.3390/agronomy9040211
View ArticleZhu JK (2000) Genetic analysis of plant salt tolerance using arabidopsis. Plant Physiology 124 (3):941-948. doi:10.1104/pp.124.3.941 PMid:11080272
View Article PubMed/NCBIZhu M, Shabala S, Shabala L, Fan Y, Zhou MX (2016) Evaluating Predictive Values of Various Physiological Indices for Salinity Stress Tolerance in Wheat. Journal of Agronomy and Crop Science 202 (2):115-124. doi:10.1111/jac.12122
View Article