Yan-Yan Zhao and Shui-Zhong Luo
E-mail address: zhaoyanyan@hfut.edu.cn (Y.-Y. Zhao), shuizhongluo@hfut.edu.cn (S.-Z. Luo).
© 2019 Sift Desk Journals. All Rights Reserved
VOLUME: 4 ISSUE: 1
Page No: 581-590
Yan-Yan Zhao and Shui-Zhong Luo
E-mail address: zhaoyanyan@hfut.edu.cn (Y.-Y. Zhao), shuizhongluo@hfut.edu.cn (S.-Z. Luo).
Xia Ge a, Dong-Dong Mu a,b, Hong Zhang a, Zhi Zheng a,b, Shao-Tong Jiang a,b, Yan-Yan Zhao a,b,*, and Shui-Zhong Luo a,b,*
aSchool of Food and Biological Engineering, Hefei University of Technology, Hefei 230009, China
bKey Laboratory for Agricultural Products Processing of Anhui Province, Hefei 230009, China
hlr(hlr88888@163.com)
Xin Chen(cx@jaas.ac.cn)
Min Zhang(zmin@th.btbu.edu.cn)
Yan-Yan Zhao,Shui-Zhong Luo, Transglutaminase-induced gelation properties of soy protein isolate glycosylated with maltodextrin(2019)SDRP Journal of Food Science & Technology 4(1)
In this study, we explored the effect of the glycosylation of soybean protein isolate (SPI) with maltodextrin (MD) on its functional properties. Glycosylation with MD was confirmed from the changes in the free amino content and by polyacrylamide gel electrophoresis. With increasing time, the degree of glycosylation (DG) of the products gradually increased from 8.35% to 12.81%. Glycosylation significantly improved the solubility of SPI from 52.62% to 77.18% and altered the secondary structure of the samples, resulting in a reduction in the number of α-helices, β-turns, and random coils and an increase in the number of β-sheets. We also investigated the microbial transglutaminase (MTG)-induced SPI-MD conjugate gel properties. The SPI glycosylated with MD forms a gel after treatment with MTG, and, with increasing glycosylation time, the gel strength increased from 91.83 to 219.23 g and water holding capacity gradually increased from 72.13% to 89%. The storage modulus (G') and loss modulus (G") of the glycosylated SPI gels were improved with increasing glycosylation time, and a denser and more homogeneous gel network was formed.
Highlights
Keywords: soy protein isolate; maltodextrin; glycosylation; microbialtransglutaminase; gel.
Soybean protein isolate (SPI) is not only high in nutritional value but also has many good functional properties, such as solubility, foaming, emulsifying, gelation, and water holding capacity [1]. Of these functional properties, the gel properties play an important role in determining the texture of the final foodstuff, such as soy products. Therefore, it is of great significance to study the gelation of soy proteins. However, the gelling of SPI is affected by many factors, which results in many uncertainties in the industrial production of soy protein gel products. For example, Tang et al. found that heat-induced gelation of soy proteins was not easily controlled, resulting in the formation of gels that were often stiff and coarse [2].
SPI can be modified by various methods to improve its functional properties. Among the multiple modification methods, glycosylation is promising because it is natural and results in a harmless product. Glycosylation is a covalent cross-linking reaction between the ε-amino acids of a protein and the carbonyl groups of sugar chains under controlled temperature and humidity [3]. After modification, the steric hindrance of the protein is enhanced, the number of monomers required for the formation of aggregates when the protein is in the pre-gel state is decreased, the intermolecular hydrophobic interactions are increased, and the gel network structure forms more easily [1]. Additionally, the glycosylation of proteins affects the strength and textural properties of protein gels [4, 5, 6].
In glycosylation, polysaccharides are often used to form protein–polysaccharide systems for the preparation of biopolymer gels with different properties. Zhang et al. [7] characterized a β-conglycinin–dextran conjugate. Glucomannan, xanthan gum, and oligochitosan have also been combined with soy protein for glycosylation to improve the functional properties of the final gels [1, 8, 9]. When there are a large number of reducing sugars and proteins in a food system, browning reactions are easily caused by high temperature treatment. Because of the low dextrose equivalent value (DE) of maltodextrin (MD) and the low degree of browning reactions, MD was chosen as a raw material for the glycosylation reaction in this study.
The gel was prepared using a cross-linking agent, in this case, MTG, which results in the formation of a gel network with high mechanical strength and good stability [4, 10]. Of the many methods for preparing soy protein gels, MTG cross-linking of soy protein gel is more readily accepted than other methods because it is environmentally friendly and nontoxic. Furthermore, there are few reports concerning the formation of gels and the gel properties of MTG cross-linked SPI-MD glycosylation products.
In this study, we used SPI and MD as the protein and polysaccharide, respectively, for conjugation. The protein–polysaccharide conjugate was induced to form a gel by MTG. Some functional properties of the modified products were evaluated, and the properties of the MTG-induced gel were investigated. The results of our study should be useful in future studies of modified proteins with food applications.
2.1. Materials
SPI (>90% protein) was obtained from Kunhua Reagent Company, Henan, China. MD was provided by Shanghai Kangda Food Engineering Co., Ltd. MTG was purchased from Yiming Biological Products Co., Ltd., Jiangsu, China. Glycine, Tris, bovine serum albumin (BSA), 1-anilino-8-naphthalene-sulfonate (ANS), and Coomassie Brilliant Blue G-250 were purchased from Solarbio Science & Technology Co., Ltd., Beijing, China. Other chemicals were supplied by Sinopharm Chemical Reagent Co., Ltd., Shanghai, China. All other chemicals were analytical reagent grade.
2.2. Preparation of the SPI-MD glycosylation product
The SPI-MD glycosylated product was prepared by wet heating. The SPI and MD were dissolved in distilled water in a 1:2 ratio and stirred at 25 °C for 2 h with an electric mixer. The mixture was placed in a magnetically stirred water bath at 95 °C for reaction for 0, 1, 2, 4, 6, 8, and 10 h. After the reaction had completed, the samples were cooled immediately in an ice bath and centrifuged at 8000 r/min for 20 min (Hitachi Ltd., Tokyo, Japan). The resulting supernatant was freeze-dried and ground. All samples were stored in a 4 °C refrigerator before further treatment.
2.3. Determination of the degree of glycosylation
The DG of the SPI-MD glycosylation product was assessed by measuring the number of free amino groups that the SPI reduced after the Maillard reaction using the modified o-phthalaldehyde (OPA) method [11]. The preparation of the OPA reagent was slightly modified following the method of Guan et al. [12]. Briefly, 200 μL sample solution (protein content of 2.5 mg/mL) and 4 mL of freshly prepared OPA reagent mixture were placed in a water bath (Changzhou Guohua Electric Appliance Co., Ltd., Changzhou, Jiangsu, China) at 35 ℃ for 3 min. Then, the absorbance of the solution was measured at 340 nm. The content of free amino groups was calculated using a standard lysine calibration curve. The DG was determined as
DG = [(A0 - A1)/A0] ´ 100%, (1)
where A0 and A1 are the absorbances of the solutions before and after glycosylation, respectively.
2.4. SDS-PAGE of the glycosylation product
Sodium dodecyl sulfate polyacrylamide gel electrophoresis (SDS-PAGE) was conducted in a discontinuous buffered system based on Laemmli’s method using 12% separating gel and 5% stacking gel [13]. The sample was dispersed in 0.125 M Tris-HCl buffer (pH 6.8) (1.0% w/v SDS, 2.0% v/v b-mercaptoethanol, 0.25% (w/v) bromophenol blue, and 5% (v/v) glycerol). The current is set to 20mA in the electrophoresis process, and the current is set to 40mA after the separation. After electrophoresis, the gel sheets were stained with Coomassie Brilliant Blue R-250 and periodic acid–Schiff (PAS) stain, respectively. The protein stain was destained and photographed, and the changes in the subunit bands were observed.
2.5. Determination of the solubility of the glycosylation product
The solubility of the glycosylation product was determined based on the nitrogen solubility index (NSI (%)). First, a sample was prepared with distilled water to make a 1% sample solution, shaken for another 10 min, and then centrifuged until the solution produced a supernatant. The Coomassie Brilliant Blue method was used to calculate the protein content in the supernatant [14]. BSA was used to obtain a standard curve. The solubility of the glycosylation product was calculated based on the ratio of the protein content in the supernatant to the total protein content in the solution.
2.6. FTIR spectra of the glycosylation product
A freeze-dried sample, as described in Section 2.2, was ground to a uniform powder using a mortar and pestle and sieved through a 120-mesh sieve to yield fine granules. The FTIR spectrum of the powder was assessed using a Nicolet 6700 FTIR spectrometer following the method of Alvarez with slight modifications [15]. The sample and KBr were mixed and ground in appropriate proportions using an agate mortar. A 1–2-mm thin sheet was formed using a hydraulic press. The measurements were carried out from 4000 to 400 cm-1, and the number of scans was 64. The secondary structure changes in the amide-I bands from 1600 to 1700 cm-1 were analyzed using Omnic 6.0 and PeakFit 4.12. The baseline was corrected and then subjected to deconvolution and second derivative fitting. The ratios of each secondary structure according to the peak area were calculated.
2.7. Preparation of MTG-induced SPI-MD gels
MTG (40 U/g) was added to the glycosylated samples (Section 2.2), and the pH of the solution was adjusted to 7.5. The dispersions were incubated in water baths at 45 °C for 1 h, and, then, the MTG in the samples was inactivated by heating at 90 °C for 10 min [16]. The MTG-induced SPI-MD gels were stored at 4 °C in a refrigerator overnight to stabilize, and, subsequently, the water holding capacity and gel strength were determined.
2.8. Determination of gel strength
The gel strength of the MTG-induced SPI-MD gels was examined using a TA-XT Plus (Texture Technologies) texture analyzer according to the method of Campbell [17] and using a P/0.5 diameter probe attachment. The glycosylated gels were penetrated at a constant speed of 4.0 mm/s to a maximum target depth of 8 mm with a trigger force of 10 g. The gel strength was defined as the maximum force required to puncture the gel.
2.9. Water holding capacity
The water holding capacity (WHC) of the MTG-induced SPI-MD gel was measured according to the method of Qin et al. [18] with slight modifications. Portions (4 g) of the gels were placed in 10-mL centrifuge tubes and centrifuged at 8000 r/min for 15 min at 4 ℃. Following centrifugation, the water was removed and the tubes and samples were weighed. The WHC was computed as
WHC = (Wt - Wr)/Wt × 100 %, (2)
where Wt is the total weight (g) of water, and Wr is the total weight (g) of the removed water.
2.10. Rheological properties of the glycosylation product
The rheological properties were determined using the method of Sun and Arntfield [19] with some modifications, and the dynamic gelation properties of the SPI-MD glycosylation products prepared at different reaction times were examined using a DHR-3 rheometer (TA Instruments, Leatherhead, UK). The rheometer was equipped with parallel plates and the temperature of the parallel plate was maintained at 45 °C. The gap between the two plates was set to 1.0 mm. MTG (40 U/g protein) was added to the sample solution described in Section 2.2. Then, after stirring for 1 min, a sample solution of 1 mL was dropped onto the parallel plate and the dynamic oscillation test was started immediately. Samples were heated from 25 to 95 °C at a speed of 5 °C/min, kept at 95 °C for 10 min, and cooled to 25 °C at a speed of 5 °C/min. The experiments were performed at an invariable strain of 0.01% and oscillatory frequencies from 0.01 to 10 Hz. The storage modulus G' and loss modulus G'' were recorded.
2.11. Scanning electron microscopy
The gels described in Section 2.7 were cut into squares and freeze-dried. The second-order structure of the lyophilized gel samples was slightly modified according to the method of Chin et al. [20]. The sample was treated by gold sputtering before the secondary structure was observed, the processed sample was measured using a JSM-6490LV scanning electron microscope (JEOL Ltd., Tokyo, Japan) and the scanning electron microscopy (SEM) images were obtained using a 20-kV acceleration voltage. The images were used to observe the microstructure of the MTG-induced SPI-MD gels.
2.12. Statistical analysis
In this study, all experiments were performed in triplicate. The reported values are the averages of three parallel values, and the error line represents the standard deviation. Origin 8.5 and SPSS were used to fit the experimental data and carry out statistical analysis (P < 0.05) processing, respectively.
3.1. Determination of the degree of glycosylation
Glycosylation is the formation of a covalent bond between the free amino group of a protein and the carbonyl group of a reducing sugar. DG is a measure of the change in the number of free amino groups in solution and is often used to reflect the extent to which the glycosylation reaction has taken place [21]. The changes in the DG of glycosylated SPI at different times are shown in Fig. 1.
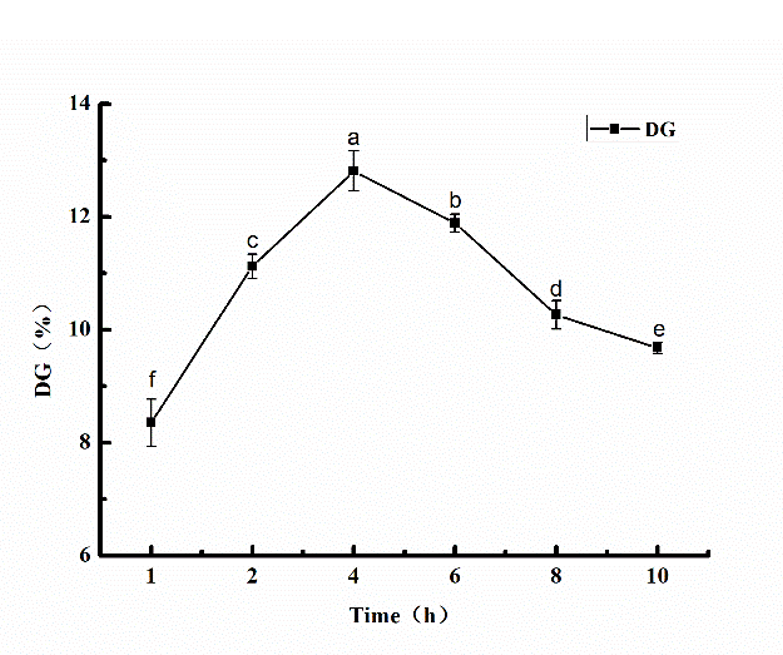
Figure 1. The DG for glycosylated SPI (SPI:MD = 1:2, heated at 95 °C for 1, 2, 4, 6, 8, and 10 h, respectively). The different letters at the top of the bars indicate significant differences (P < 0.05).
Fig. 1 shows that the DG of glycosylated SPI increased at first and then decreased with increasing glycosylation time. The maximum degree of grafting was 12.81%, obtained at a reaction time of 4 h. As the glycosylation time increased further, the DG of the SPI reduced. This might be due to the fact that as the reaction time increases, SPI and MD fully react, and the DG gradually increases. However, as time goes on, the degree of protein denaturation increases, and protein re-aggregation occurs, leading to a decrease in the DG.
3.2. SDS-PAGE analyses
SDS-PAGE was performed to confirm the glycosylation reaction between SPI and MD [22]. The SDS-PAGE results are shown in Figs. 2a and 2b. Compared with the untreated SPI-MD (lane 1), the color of the bands corresponding to glycosylation products became weaker (a, lanes 2–6); meanwhile, new bands corresponding to higher-molecular-weight compounds (conjugates) appeared near the top of the stacking gel and separation gel. In addition, there were many macromolecular substances that had low mobility and could not enter the gel. As shown in Fig. 2b, with increasing glycosylation time, the number of macromolecules in part 1 (P1) increased. Compared with those of MD (lane T), the bands corresponding to the glycosylation products in P1 have a lighter color, indicating that the SPI and MD underwent glycosylation reactions. Several bands in part 2 (P2) became weaker or disappeared. Staining with Coomassie Brilliant Blue R-250 and PAS indicated that the conjugates were produced via covalent bonding. Based on the intensity of the staining color, the SDS-PAGE results in Figs. 2a and 2b indicate that the protein re-aggregated over time and protein denaturation increased.
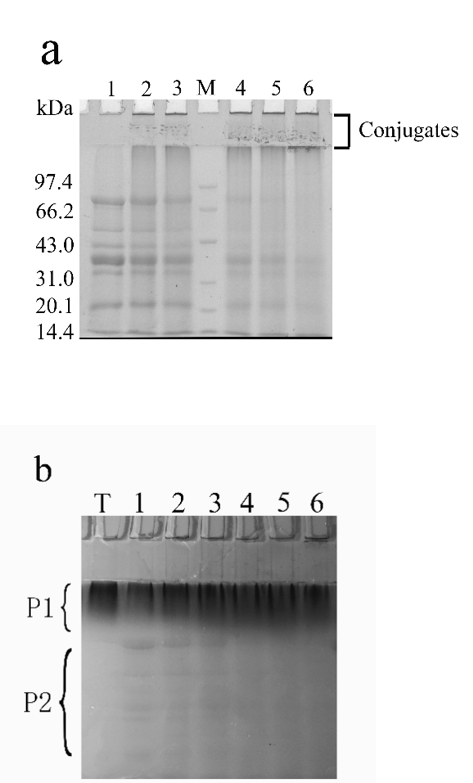
Figure 2. SDS-PAGE profiles stained for proteins with Coomassie Brilliant Blue R-250 (a) and stained for carbohydrate with periodic acid–Schiff stain (b). Lane M, standard protein markers; lane T, maltodextrin solution; lanes 1–6, glycosylation products prepared with 5% (w/v) SPI solution, SPI:MD = 1:2, heated at 95 °C for 0, 2, 4, 6, 8, and 10 h, respectively.
3.3. Determination of solubility
As shown in Fig. 3, the solubility of the glycosylation product first increased and then gradually decreased with increasing reaction time, and the solubilities of the modified samples were all higher than that of the unmodified sample, indicating that the glycosylation improves the solubility of the SPI. This is because of the covalent bond forming reaction between the SPI and the glycosyl groups in the initial stages of the glycosylation reaction, which results in more hydrophilic groups, thus increasing the solubility. In contrast, with increasing exposure to heat as the reaction time increased, the protein was denatured. As a result, the solubility of the glycosylated product improved, but, with further increasing reaction time, some protein molecules aggregated, the steric hindrance of the product increased, and the solubility decreased gradually.
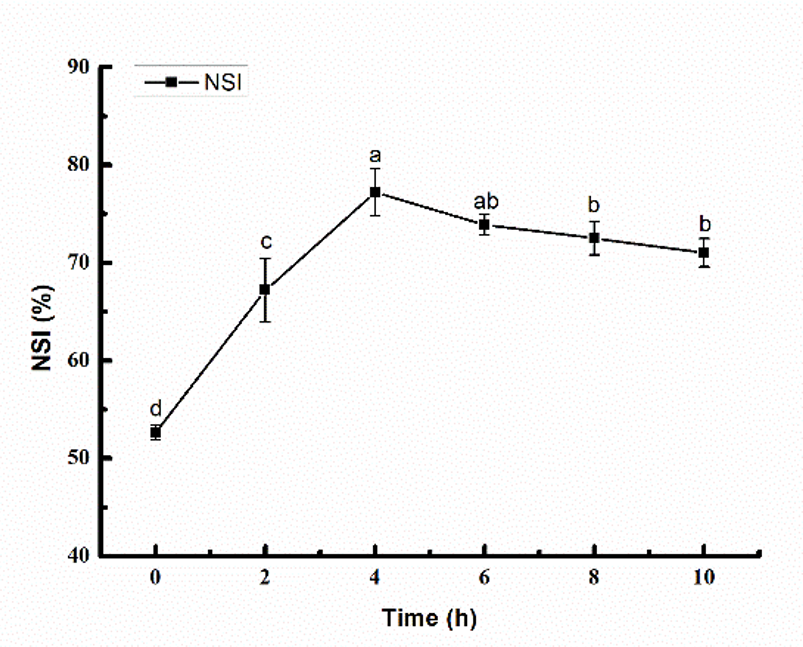
Figure 3. Solubility of glycosylated SPI (SPI:MD = 1:2, heated at 95 °C for 1, 2, 4, 6, 8, and 10 h). The different letters at the top of the bars indicate significant differences (P < 0.05).
3.4. FTIR spectroscopy
FTIR analysis of the amide I band indicates the changes in the protein secondary structure of the samples, including α-helices (1650–1660 cm-1), β-sheets (1618–1640 cm-1) and (1670–1690 cm-1), β-turns (1660–1670 cm-1), and random coils (1690–1700 cm-1) [23]. The amide I band in the FTIR spectra was deconvoluted, followed by second derivative fitting, to allow peak assignment and to calculate the proportion of the different secondary structures after the glycosylation of SPI for different periods.
As shown in Table 1, the data obviously indicate that the secondary structure of SPI changed after glycosylation. Furthermore, compared with the secondary structure of the untreated sample (0 h), which contained 22.51% α-helices, 35.96% β-sheets, 19.99% β-turns, and 21.54% random coils, the α-helix, β-turn, and random coil contents in the glycosylated samples decreased slightly with increasing glycosylation time, but the β-sheet content increased markedly. However, the small difference might be due to the lower secondary structure contents in the samples because both the pre-glycosylation and glycosylated samples contain highly soluble MD. Tay et al. [24] suggested that these modifications might alter the protein–protein interactions and WHC, thereby increasing the dynamic viscoelastic properties. Alvarez et al. [15] also found that changes in the contents of these secondary structures might alter the interactions between proteins, as well as the WHC, thereby also increasing the dynamic viscoelastic properties of the protein gels. Compared with the α-helix structure, the other secondary structures have poor conformational stability, but the protein flexibility was significantly improved, which is beneficial to the functional properties of the protein. Thus, glycosylation changes the molecular structure of SPI, increasing the possibility of protein cross-linking by MTG.
Table 1: Secondary structure constituents of different samples
|
Samples |
Secondary structure components (%) |
|||
|
α-Helix |
β-Sheet |
β-Turn |
Random coil |
|
|
0 h |
22.51 ± 0.31a |
35.96 ± 0.11d |
19.99 ± 0.12a |
21.54 ± 0.24a |
|
2 h |
21.62 ± 0.25b |
37.55 ± 0.43c |
19.76 ± 0.45b |
21.07 ± 0.36b |
|
4 h |
20.99 ± 0.16c |
38.86 ± 0.07a |
19.56 ± 0.31d |
20.59 ± 0.18b |
|
6 h |
21.56 ± 0.46bc |
37.77 ± 0.56b |
19.63 ± 0.26cd |
21.04 ± 0.15b |
|
8 h |
21.59 ± 0.17bc |
37.67 ± 0.19b |
19.72 ± 0.42bc |
21.02 ± 0.17b |
|
10 h |
21.61 ± 0.09bc |
37.64 ± 0.37b |
19.72 ± 0.52bc |
21.03 ± 0.09b |
Values are means ± SD from triplicate experiments. Different letters within a column indicate significant differences (p < 0.05)
3.5. Gel strength and WHC
The gel strength and WHC are two important properties of gels and show the protein–water interactions in the gel system. After glycosylation and the cross-linking of MTG to form the SPI-MD gel, we analyzed the gel strength and WHC. The results of these analyses are shown in Fig. 4.
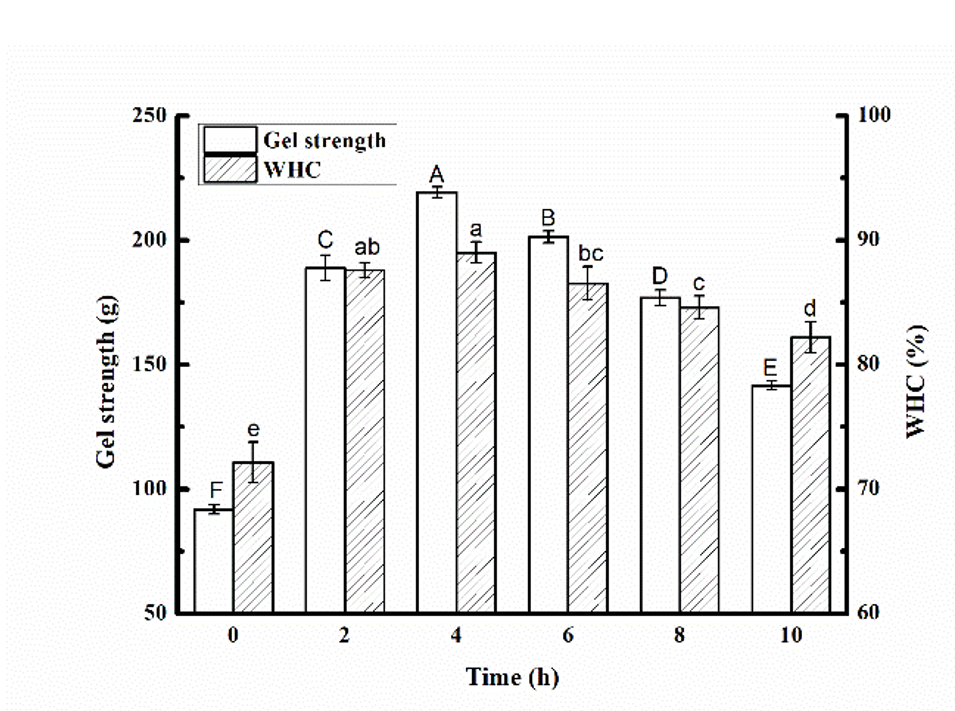
Figure 4. Effect of glycosylation time (0, 2, 4, 6, 8, and 10 h) on gel strength and water holding capacity of the MTG-induced cross-linked SPI-MD gels. The different letters at the top of the bars indicate significant differences (P < 0.05).
The gel strength and WHC of the gel formed after glycosylation were significantly higher than that of the untreated sample (0 h), indicating that glycosylation significantly improved the gel strength and WHC of the MTG-induced SPI-MD gels. Because of the higher concentration of MD in the untreated sample, the MTG crosslinked gel network was weakened [25, 26]. In addition, it was concluded that the gel samples prepared by the 4-h treatment had the highest gel strength and WHC. The gel strength of the gel sample corresponds to its rheological properties (Fig. 5a and 5b), indicating that the MTG cross-linked SPI-MD glycosylation products form gels that are more stable and have higher gel strengths.
3.6. Rheological properties
A rheometer can be used to determine the change in the storage modulus, G', and the loss modulus, G'', of the protein gel. G' reflects the solid part of the system, which is related to the elasticity of the gel, and G'' reflects the liquid part of the system, which is related to the viscosity of the gel [27]. After glycosylation and cross-linking with MTG to form a gel, the rheological properties of the SPI-MD gels prepared at different glycosylation times were analyzed, and the results are shown in Figs. 5a and 5b. The dynamic viscoelasticity was determined at 0.01% strain as a function of the oscillation frequency.
As shown in Fig. 5a, the storage modulus (G') of the MTG-induced SPI-MD gel increased with increasing frequency. Similar results have been reported by Sittikijyothin et al. [28], who reported that the G' value of β-lactoglobulin also increased with increasing frequency. In addition, Wang et al. [29] reported that the G' value of wheat gluten increased with increasing frequency. Compared with those of the untreated samples, the G' values of the glycosylated gel samples were significantly increased over the entire frequency range, as shown in Fig. 5a. The highest sample G' was obtained for the gel prepared over 4 h, and the change in G' for each treatment time correlated with the DG. The figure also shows that glycosylation resulted in stronger MTG-induced SPI-MD gels. This might be due to the increased WHC of the gel after glycosylation, which increases the gel strength. Yang et al. [30] observed a linear relationship between G' and the WHC of MTG-induced SPI-MD gels.
Similarly, the loss modulus (G") values are shown in Fig. 5b. As shown in Fig. 5b, the loss modulus (G") of the MTG-induced SPI-MD gel increased with increasing frequency. The changes in G'' are generally consistent with the changes in G'. This indicates that the glycosylated samples have better gel properties than the untreated sample. In addition, the increase in G' and G'' in the gels might be caused by changes in the interactions between protein molecules.
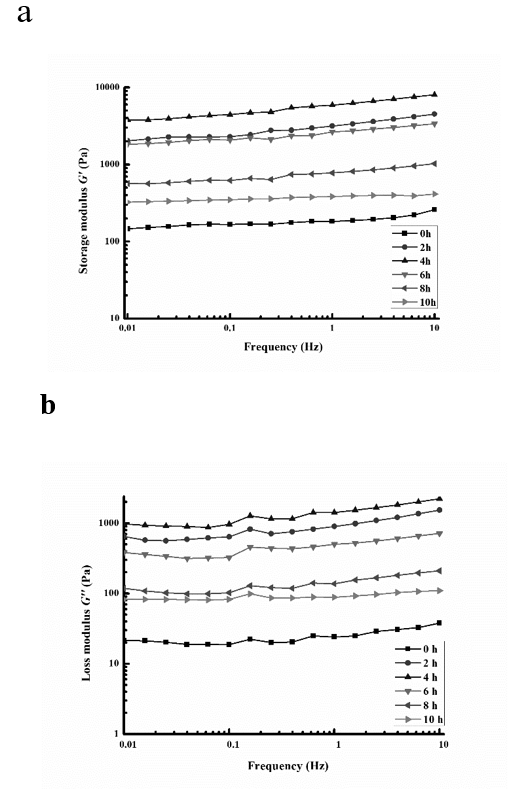
Figure 5. Frequency dependence of the storage modulus (G') (a) and frequency dependence of the loss modulus (G'') (b) of the glycosylated (0, 2, 4, 6, 8, and 10 h) MTG-induced cross-linked SPI-MD gels.
3.7. Scanning electron microscopy
SEM analysis can be used to assess the three-dimensional network structure of the MTG-induced SPI-MD gels. Fig. 6 shows the SEM images of the glycosylated SPI-MD gels cross-linked by MTG at different times. As shown in Fig. 6, the non-glycosylated gels have a rough and insignificant network structure with irregular pores (Fig. 6A). In contrast, the glycosylated gels have high pore densities, smooth structures, and uniform gel networks (Figs. 6B–F). The microstructure of the gel sample is related to the gel modulus, G', (Fig. 5), gel strength, and WHC (Fig. 4). The more ordered network structure of the MTG-induced SPI-MD gel might result in higher gel strengths. In addition, Tay et al. [24] reported that SPI can catalyze the formation of protein aggregates after heat treatment, which affected the microstructure of GDL-induced SPI gels. As shown in Fig. 6, the gel network reacted for 4 h had the smallest pores and most ordered network structure, whereas those prepared at longer glycosylation times (6, 8, and 10 h) had larger pores, consistent with the observed changes in the gel rheology. The differences in the structures of these three-dimensional gel networks may be caused by the different glycosylation times, which result in the dissociation of the free thiol and hydrophobic groups on the surface of the SPI-MD protein. Simultaneously, the dissociation promoted by disulfide bond formation and hydrophobic interactions results in a series of reactions, thus forming a dense and uniform gel network.
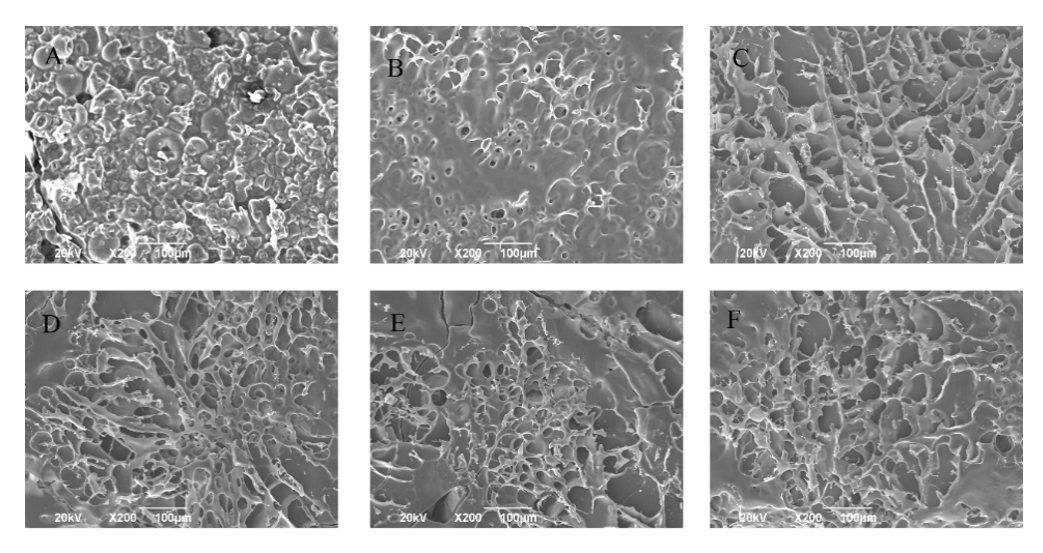
Figure 6. SEM images (200 ´ magnification, scale bar =10 μm) of the glycosylated (0, 2, 4, 6, 8, and 10 h) MTG-induced cross-linked SPI-MD gels: (A–F) 0, 2, 4, 6, 8, and 10 h, respectively.
The glycosylation of the SPI solution significantly improved the functional properties of SPI and the structural properties of the MTG-induced SPI-MD gels. DG and SDS-PAGE analysis confirmed that glycosylation had occurred. The solubility, rheological, and gelation properties of SPI were improved by glycosylation. The experimental results show that the gel strength, storage modulus (G'), loss modulus (G"), and WHC were improved, and a denser and more uniform MTG-induced SPI-MD gel network was formed. Furthermore, there is a correlation between these factors. In addition, based on FTIR measurements, we found that glycosylation altered the secondary structure of the gel samples, which showed a reduction in α-helices, β-turns, and random coils and an increase in β-sheets. These results indicate that glycosylation promotes the cross-linking of MTG by changing the structure of the protein. Therefore, glycosylation can be used to promote the gelation of MTG-induced SPI-MD gels and may expand their use in the food protein gel industry.
This research was supported by The National Key Research and Development Program of China (2018YFD0400600、2018YFD0400400), and by Key Scientific and Technological Project of Anhui Province of China (No. 17030701014 and 15czz03096).
Conflicts of interest
There are no conflicts to declare.
Author’s Contributions
Xia Ge collected test data, interpreted results and drafted the manuscript. Shuizhong Luo, Yanyan Zhao, and Dongdong Mu designed the study and interpreted results. Hong Zhang, Zhi Zheng and Shaotong Jiang designed the study and gave final approval of the version to be submitted.
H. Zhang and Y.J. Chi, Int. J. Food Sci. Tech. 46: 14-22 (2011).
View ArticleC.H. Tang, H. Wu, H.P. Yu, L. Li, Z. Chen and X.Q. Yang, J. Food Biochem. 30: 35-55 (2006).
View ArticleM. Aminlari, R. Ramezani and F. Jadidi, J. Sci. Food Agr. 85: 2617-2624 (2005).
View ArticleC. Y. Gan, L. H. Cheng and A. M. Easa, Food Res. Int. 41: 600-605 (2008).
View ArticleJ. A. Gerrard and P. K. Brown, 1245: 211-215 (2002).
L. D. Melton, Crit. Rev. Food Sci. 46: 337-350 (2006). PMid:16621753
View Article PubMed/NCBIX. Zhang, J. R. Qi, K. K. Li, S. W. Yin, J. M. Wang, J. H. Zhu and X. Q.Yang, Food Res. Int. 49: 648-654 (2012).
View ArticleR. Li, N. Hettiarachchy, S. Rayaprolu, M. Davis, S. Eswaranandam, A. Jha and P. Chen, J. Food Sci. Technol. 52: 6067-6072 (2015). PMid:26345030 PMCid:PMC4554612
View Article PubMed/NCBIC. L. Song and X. H. Zhao, Food Chem. 163: 114-119 (2014). PMid:24912705
View Article PubMed/NCBIC. Y. Gan, A. A. Latiff, L. H. Cheng and A. M. Easa, Food Res. Int. 42: 1373-1380 (2009).
View ArticleJ. J. Guan, A. Y. Qiu, X. Y. Liu, Y. F. Hua and Y. H. Ma, Food Chem. 97: 577-585 (2006).
View ArticleJ. J. Guan, T. B. Zhang, M. Hui, H. C. Yin, A. Y. Qiu and X. Y. Liu, Food Res. Int. 44: 2647-2654 (2011).
View ArticleU. K. Laemmli, Nature, 227: 680-685 (1970). PMid:5432063
View Article PubMed/NCBIC. X. Qu, S. D. Shen, X. F. Wang, Y. H. Cui and W. P. Song, Journal of Suzhou University. (2006).
P. A. Alvarez, H. S. Ramaswamy and A. A. Ismail, J. Food Eng. 88: 331-340 (2008).
View ArticleX. S. Qin, S. Z. Luo, J. Cai, X. Y. Zhong, S. T. Jiang, Y. Y. Zhao and Z. Zheng, Ultrason. Sonochem. 31: 590-597 (2016). PMid:26964986
View Article PubMed/NCBIL. J. Campbell, G. Xin, S. J. Dewar and S. R. Euston, Food Hydrocolloid. 23: 344-351 (2009).
View ArticleX. S. Qin, S. S. Chen, X. J. Li, S. Z. Luo, X. Y. Zhong, S. T. Jiang and Z. Zheng, Food Bioprocess Tech. 10: 866-874 (2017).
View ArticleX. D. Sun and S. D. Arntfield, Food Hydrocolloid. 27: 394-400 (2012).
View ArticleC. Koob, G.Miy and Y. Xiong, Food Res. Int. 42: 941-948 (2009).
View ArticleL. Delphine, I. Claude, B. Céline, V. Éric, D. Laurent and G. Fabienne, Food Chem. 111: 1032-1042 (2008).
View ArticleN. Diftis and V. Kiosseoglou, Food Chem. 96: 228-233 (2006).
View ArticleZ. Wang, Y. Li, L. Jiang, B. Qi and L. Zhou, J. Chem. 2014:1-10 (2014).
S. L. Tay, G. Q. Xu and C. O. Perera, Food Chem. 91: 457-462 (2005).
View ArticleE. Çakır, C. R. Daubert, M. A. Drake and C. J. Vinyard, Food Hydrocolloid. 26: 33-43 (2012).
View ArticleB. Lvanden, V. Tvan, L. Evander, B. Majsvan and V. Fvande, Food Hydrocolloid. 21: 961-976 (2007).
View ArticleL. Vls, G. E. Remondetto and M. Subirade, Food Hydrocolloid, 19: 269-278 (2005).
View ArticleK. Q. Wang, S. Z. Luo, X. Y. Zhong, J. Cai, S. T. Jiang and Z. Zheng, Food Chem. 214: 393-399 (2017). PMid:27507490
View Article PubMed/NCBIW. Sittikijyothin, P. Sampaio and M. P. GonçAlves, Food Hydrocolloid. 24: 726-734 (2010).
M. Yang, F. Liu and C. H. Tang, Food Res. Int. 52: 409-418 (2013).
View Article